

The 10 CRM metrics worth tracking in 2026 are Customer Acquisition Cost, Customer Lifetime Value, the CLV:CAC ratio, lead conversion rate, sales win rate, average sales cycle length, customer churn rate, net revenue retention, average deal size, and pipeline coverage ratio. Each has a fixed formula and a known benchmark range, so any spreadsheet can calculate them.
Last updated: September 2026
Key takeaways
- A healthy business keeps its CLV:CAC ratio at roughly 3:1 — below 1:1 you lose money on every customer, above 5:1 you are under-investing in growth.
- Best-in-class net revenue retention is above 100%, meaning existing customers grow faster than they churn, before a single new logo is added.
- The most common CRM metrics mistake is putting open deals in the win-rate denominator, which silently inflates the number every sales leader reports upward.
- Every metric in this guide is a simple ratio or average — the CRM KPI Dashboard in Excel ($14.99) calculates the full set from one input sheet.
- You do not need a $150/user Salesforce seat to track CRM metrics; eight ready-made NGT templates from $6.99 cover Excel, Google Sheets, Power BI and HTML.
The 10 CRM metrics at a glance
Every metric below is defined once, given its exact formula, a realistic benchmark range, and the one mistake teams make when they calculate it. Use this table as the quick reference, then read the section under it for the detail.
| CRM metric | Formula | Benchmark range | Where to see it |
|---|---|---|---|
| 1. Customer Acquisition Cost (CAC) | Total sales & marketing spend ÷ new customers won | $45–$90 e-commerce; $700–$1,200 B2B SaaS | CRM KPI Dashboard |
| 2. Customer Lifetime Value (CLV) | ARPA × gross margin % ÷ churn rate | Healthy when ≥ 3× CAC | Customer Lifetime Value Dashboard |
| 3. CLV:CAC ratio | CLV ÷ CAC | 3:1 target; <1:1 loss-making | Customer Lifetime Value Dashboard |
| 4. Lead conversion rate | (Leads converted ÷ total leads) × 100 | 1–3% lead-to-close; ~13% MQL→SQL | CRM KPI Dashboard |
| 5. Sales win rate | (Deals won ÷ deals closed) × 100 | 15–30% overall | CRM KPI Dashboard |
| 6. Average sales cycle length | Total days to close ÷ deals closed | 30–60 days SMB; 90–180 enterprise | CRM Dashboard (HTML) |
| 7. Customer churn rate | (Customers lost ÷ customers at start) × 100 | <5–7% annual B2B SaaS | Customer Engagement Dashboard |
| 8. Net revenue retention (NRR) | (Start MRR + expansion − contraction − churn) ÷ start MRR × 100 | >100% good; 120%+ elite | Customer Engagement Dashboard |
| 9. Average deal size / ARPA | Total revenue ÷ number of deals (or accounts) | Track the trend, not an absolute | CRM KPI Dashboard |
| 10. Pipeline coverage ratio | Open pipeline value ÷ quota | 3×–4× quota | CRM KPI Dashboard |
The 10 CRM metrics, defined with formulas and benchmarks
1. Customer Acquisition Cost (CAC)
CAC is what it costs, all-in, to win one new customer. Formula: total sales and marketing spend in a period ÷ number of new customers acquired in the same period.
Benchmark: roughly $45–$90 per customer for e-commerce and $700–$1,200 for B2B SaaS, but the honest target is any CAC you recover within 12 months of gross margin. The mistake teams make: counting only ad spend and leaving out salaries, commissions and tool subscriptions, which understates true CAC by half and makes the whole funnel look profitable when it is not.
2. Customer Lifetime Value (CLV)
CLV is the total gross profit you expect from a customer across the whole relationship. Formula: average revenue per account (ARPA) × gross margin % ÷ churn rate. A commonly cited definition of customer lifetime value underpins this calculation.
Benchmark: there is no universal dollar figure; CLV is healthy when it is at least three times CAC. The mistake teams make: using raw revenue instead of gross-margin-adjusted value, which inflates CLV and hides the fact that a low-margin customer may never repay their acquisition cost.
3. CLV:CAC ratio
This single ratio tells you whether your growth engine makes or loses money. Formula: CLV ÷ CAC.
Benchmark: 3:1 is the widely accepted target. Below 1:1 you lose money on every customer; above 5:1 you are usually under-spending on acquisition and leaving growth on the table. The mistake teams make: treating a very high ratio as unambiguously good — a 7:1 ratio often means marketing is starved of budget, not that the business is winning.
4. Lead conversion rate
Lead conversion rate is the share of leads that become paying customers. Formula: (leads converted to customers ÷ total leads) × 100.
Benchmark: 1–3% lead-to-close across most industries, with roughly 13% of marketing-qualified leads advancing to sales-qualified. The mistake teams make: reporting one blended rate instead of a stage-by-stage rate, which hides exactly where in the funnel prospects leak out.
5. Sales win rate
Win rate is how often a closed deal is won rather than lost. Formula: (deals won ÷ total deals closed, won plus lost) × 100.
Benchmark: 15–30% overall is typical, higher once deals are properly qualified. The mistake teams make: leaving open, unclosed deals in the denominator, which mathematically inflates the win rate every reporting period and produces forecasts that never land.
6. Average sales cycle length
This is how long, on average, a deal takes from first contact to close. Formula: total days to close all deals ÷ number of deals closed.
Benchmark: 30–60 days for SMB, 60–90 for mid-market, and 90–180+ days for enterprise. The mistake teams make: reporting a single mean across all deal sizes, so a handful of slow enterprise deals drag the average up and make the SMB pipeline look slower than it is.
7. Customer churn rate
Churn rate is the percentage of customers who leave in a period. Formula: (customers lost during the period ÷ customers at the start of the period) × 100.
Benchmark: under 5–7% annually is considered good for B2B SaaS, and under 1% monthly. The mistake teams make: tracking only logo churn (accounts lost) and ignoring revenue churn, so losing one large account looks the same as losing one tiny one.
8. Net revenue retention (NRR)
NRR measures how revenue from your existing customers grows or shrinks, before any new customers are counted. Formula: (starting MRR + expansion − contraction − churn) ÷ starting MRR × 100.
Benchmark: above 100% is the goal, 100–110% is good and 120%+ is elite. The mistake teams make: including new-customer revenue in the numerator — that is growth, not retention, and it masks a leaky base.
9. Average deal size / ARPA
Average deal size (or average revenue per account) shows the typical value of what you sell. Formula: total revenue closed ÷ number of deals (or total revenue ÷ number of accounts).
Benchmark: there is no universal figure — track the trend over time; a rising ARPA signals successful upselling. The mistake teams make: reporting a mean that one enormous deal has skewed, instead of also showing the median, which better reflects the everyday deal.
10. Pipeline coverage ratio
Pipeline coverage tells you whether you have enough open opportunities to hit target. Formula: total open pipeline value ÷ sales quota for the period.
Benchmark: 3×–4× quota is the standard healthy coverage, allowing for a normal win rate. The mistake teams make: counting stale, aged or unqualified deals as active pipeline, which makes coverage look safe while the real, workable pipeline is thin.
CRM metrics templates compared
You do not need enterprise software to track these CRM metrics. The eight ready-made NGT dashboards below each calculate a slice of the list from a simple input sheet, in the format your team already uses. Prices are one-time, not per-user per-month.
| Template | Format | Best for | Price |
|---|---|---|---|
| CRM KPI Dashboard in Excel — Best overall | Excel | The full CRM metrics set in one file | $14.99 |
| Customer Account Update Tracker — Best value | Google Sheets | Logging customer changes and account health | $6.99 |
| CRM KPI Dashboard in Google Sheets | Google Sheets | Cloud-based, shareable CRM metrics | $12.99 |
| CRM KPI Dashboard in Power BI | Power BI | Interactive drill-down and big data | $11.99 |
| CRM Dashboard in HTML | HTML | Embedding a live dashboard on the web | $12.99 |
| Customer Lifetime Value KPI Dashboard | Excel | CLV and CLV:CAC modelling | $14.99 |
| Customer Engagement KPI Dashboard | Excel | Churn, retention and NRR | $14.99 |
| Customer Feedback KPI Dashboard | Excel | Satisfaction and feedback scoring | $14.99 |
How we picked these
We searched the full NextGenTemplates catalogue of 300+ paid dashboards and trackers and shortlisted only products that actually calculate one or more of the ten CRM metrics above from a user-editable input sheet. We excluded generic finance dashboards that mention “customers” but compute no CRM metric, and free templates with no formula plumbing.
The eight that remain span Excel, Google Sheets, Power BI and HTML so a reader can pick the format their team already lives in. Ranking favours breadth of metric coverage first, then price, then how little setup each file needs before it shows a number.
The 8 best CRM metrics dashboard templates for 2026
1. CRM KPI Dashboard in Excel — best overall
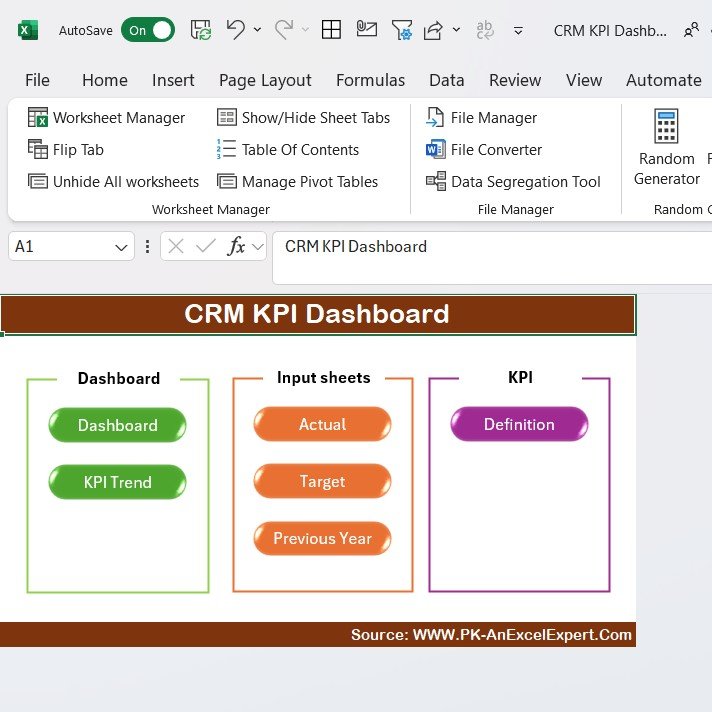
This is the best overall pick because it calculates the widest span of the CRM metrics list — win rate, lead conversion, sales cycle, pipeline coverage and average deal size — from a single input sheet, with no add-ins.
Who it is for: sales managers who want the full CRM scorecard in the tool they already own.
- Actual vs target vs previous-year comparison on every KPI
- Traffic-light conditional formatting for at-a-glance health
- Editable target and previous-year sheets
- Pre-built KPI trend charts
A 12-rep team can drop last month’s numbers in and read win rate and pipeline coverage in minutes instead of rebuilding a pivot. Price: $14.99. Get the CRM KPI Dashboard in Excel.
Best for: the one file that shows the most CRM metrics with the least setup.
2. Customer Account Update Tracker in Google Sheets — best value
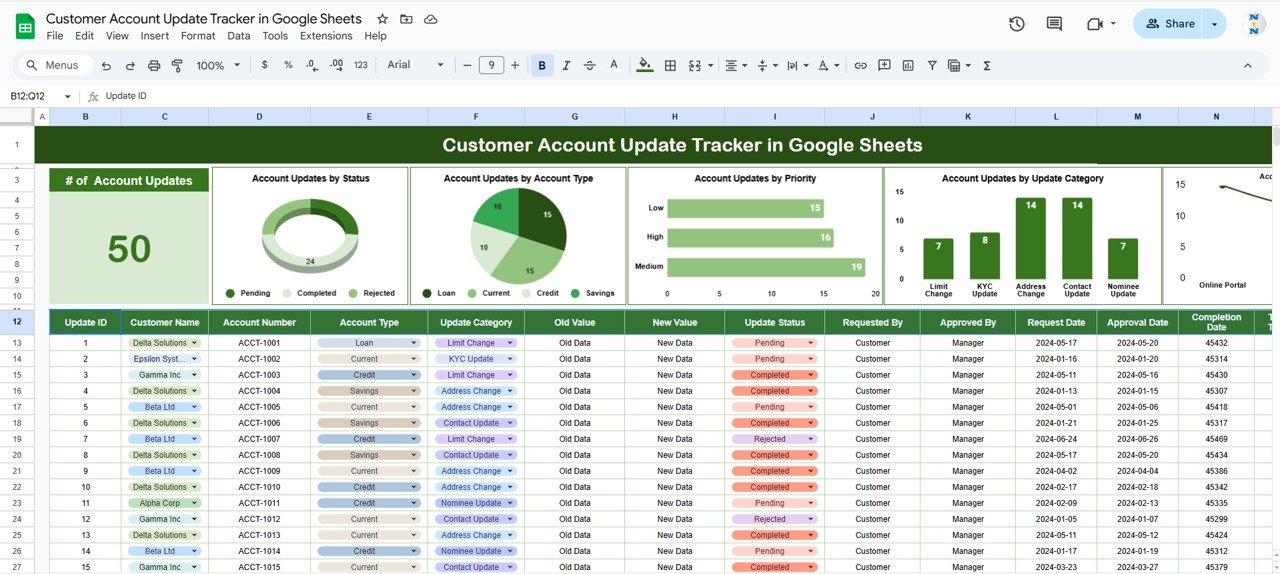
At $6.99 this is the cheapest way into structured CRM tracking. It is not a full KPI dashboard; it is the clean, dropdown-driven data layer that feeds one.
Who it is for: small teams that need to log account changes before they can measure anything.
- Auto-expanding dropdown lists for status and owner
- One row per account update, timestamped
- Shareable in Google Drive with view/edit control
Price: $6.99. Get the Customer Account Update Tracker.
Best for: the lowest-cost starting point for clean CRM data.
3. CRM KPI Dashboard in Google Sheets

The cloud twin of the Excel dashboard, for teams that live in Google Workspace and want to share a live CRM metrics view without emailing files around.
Who it is for: remote and distributed sales teams.
- Same KPI set as the Excel version, formula-driven
- Real-time collaboration and comments
- Works on any device through a browser
Price: $12.99. Get the CRM KPI Dashboard in Google Sheets.
Best for: shared, always-current CRM metrics in the cloud.
4. CRM KPI Dashboard in Power BI

When your CRM data outgrows a spreadsheet, this Power BI version gives you interactive slicers and drill-down across the same CRM metrics.
Who it is for: analysts and RevOps handling thousands of records.
- Interactive filters by rep, region and period
- Drill-through from summary to deal level
- Refreshable from a connected data source
Price: $11.99. Get the CRM KPI Dashboard in Power BI.
Best for: interactive analysis on large CRM datasets.
5. Customer Relationship Management (CRM) Dashboard in HTML

A self-contained HTML dashboard you can host on an internal portal or embed on the web, showing pipeline and sales-cycle CRM metrics without any Office licence.
Who it is for: teams that want a browser-native, embeddable view.
- Runs in any browser, no software to install
- Editable data arrays for your own numbers
- Responsive layout for desktop and mobile
Price: $12.99. Get the CRM Dashboard in HTML.
Best for: embedding CRM metrics on a website or portal.
6. Customer Lifetime Value KPI Dashboard in Excel
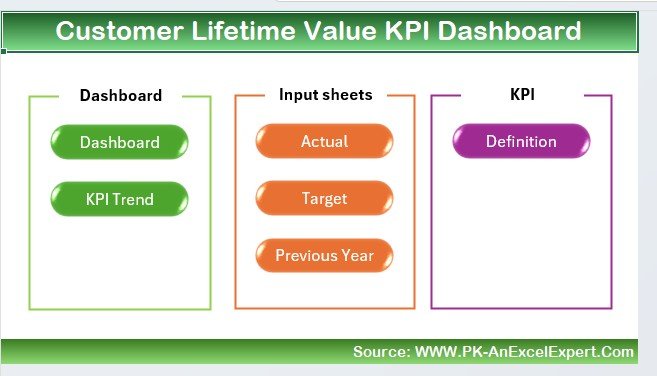
This one is purpose-built for metrics 2 and 3 — CLV and the CLV:CAC ratio — so you can model whether your acquisition spending actually pays back.
Who it is for: founders and marketers watching unit economics.
- CLV by segment and cohort
- CLV:CAC ratio with target lines
- Margin and churn inputs you control
Price: $14.99. Get the Customer Lifetime Value KPI Dashboard.
Best for: proving your unit economics work.
7. Customer Engagement KPI Dashboard in Excel

Retention lives here. This dashboard tracks churn rate and the inputs to net revenue retention so you can see whether your base is growing or leaking.
Who it is for: customer success and account management teams.
- Churn and retention rate over time
- Engagement scoring by account
- Expansion vs contraction inputs for NRR
Price: $14.99. Get the Customer Engagement KPI Dashboard.
Best for: watching churn and retention before they bite.
8. Customer Feedback KPI Dashboard in Excel

Satisfaction is a leading indicator of churn, and this dashboard turns feedback scores into a trackable KPI alongside the harder revenue CRM metrics.
Who it is for: teams that want to connect satisfaction to retention.
- Feedback and satisfaction scoring
- Trend view to catch declines early
- Editable survey inputs
Price: $14.99. Get the Customer Feedback KPI Dashboard.
Best for: adding a satisfaction signal to your CRM metrics.
How to choose between them
Match the template to the metric you most need and the tool you already use:
- Want the whole CRM metrics set in one file? The CRM KPI Dashboard in Excel ($14.99).
- On Google Workspace? The Google Sheets version ($12.99).
- Thousands of records? The Power BI version ($11.99).
- Focused on unit economics? The CLV Dashboard ($14.99).
- Fighting churn? The Customer Engagement Dashboard ($14.99).
- Smallest budget? The Account Update Tracker ($6.99).
For a deeper comparison of dashboard-only options, see our guide to the CRM KPI dashboard templates that track the metrics Salesforce charges extra for.
When a template is NOT the right answer
A spreadsheet is the right tool for measuring and reporting CRM metrics. It is the wrong tool for running the sales motion itself.
If you need automated lead routing, email sequencing, call logging, or real-time syncing across a 30-person sales floor, buy a proper CRM platform — a template will not send the follow-up email or dial the number. Likewise, if compliance requires an audit trail of who changed what and when across thousands of records, a dedicated system with row-level permissions beats a shared file.
Templates win when the job is to calculate and communicate the metrics — for a small team, a founder, a monthly board pack, or as a low-cost proof of concept before committing to per-seat software. If you are outgrowing manual entry entirely, read how to track leads and opportunities in Excel without Salesforce and the Zoho CRM alternatives built in Excel and Sheets to see where the line sits.
Frequently asked questions
What are CRM metrics?
CRM metrics are the quantitative measures of how well you acquire, serve and retain customers. They include acquisition cost, lifetime value, conversion and win rates, sales cycle length, churn, net revenue retention, deal size and pipeline coverage — each a fixed formula you can calculate from your own sales and customer data.
Which CRM metrics matter most in 2026?
If you track only three, track the CLV:CAC ratio, net revenue retention and win rate. Together they tell you whether acquisition is profitable, whether the existing base is growing, and whether your reps close what they work — the three questions every board asks about a sales engine.
What is a good CLV:CAC ratio?
Around 3:1 is the widely accepted target. Below 1:1 you lose money on every customer you acquire. Above 5:1 usually means you are under-investing in marketing and could grow faster by spending more on acquisition, so a very high ratio is not automatically good news.
How do you calculate customer churn rate?
Divide the number of customers lost during a period by the number of customers at the start of that period, then multiply by 100. For B2B SaaS, under 5–7% annual churn is considered healthy. Track revenue churn alongside logo churn so one large loss is not hidden.
Can I track CRM metrics in Excel or Google Sheets?
Yes. Every CRM metric in this guide is a ratio or average that a spreadsheet computes easily. A ready-made file like the CRM KPI Dashboard in Excel ($14.99) or Google Sheets ($12.99) does the formulas for you — you paste your numbers and read the result, with charts and traffic lights built in.
What is net revenue retention and why does it matter?
NRR is the percentage of recurring revenue you keep and grow from existing customers, calculated as starting MRR plus expansion minus contraction and churn, divided by starting MRR. Above 100% means your base grows on its own; investors treat 120%+ as elite because it signals durable, compounding growth.
What is a healthy pipeline coverage ratio?
Most sales teams aim for 3× to 4× quota in open pipeline for the period, allowing for a typical win rate. Below 3× and you likely cannot hit target; well above 4× may mean the pipeline is padded with stale deals that will never close, so review deal age too.
How often should I update CRM metrics?
Review lead conversion, win rate and pipeline coverage weekly, and CAC, CLV, churn and NRR monthly. Anything faster adds noise; anything slower means you spot problems too late to fix them in the quarter. A dashboard that recalculates on data entry makes weekly reviews a five-minute job.
Do I need Salesforce to track these metrics?
No. Salesforce and similar platforms run the sales process, but you can measure every CRM metric here with a spreadsheet template costing a one-time $6.99–$14.99 instead of a recurring per-user fee. Many teams use a template for reporting even when their CRM software has dashboards, because the template is easier to customise.
What is the difference between CLV and average deal size?
Average deal size is the value of a single transaction; CLV is the total gross profit across the entire relationship, spanning many deals and renewals. A business can have a small average deal size but a high CLV if customers stay for years, which is why both belong on your CRM metrics scorecard.
Get more CRM metrics templates
The fastest way to start is the CRM KPI Dashboard in Excel at $14.99 — it calculates the widest span of the ten CRM metrics from one input sheet, with charts and traffic lights already built. On Google Workspace, the Google Sheets version is $12.99, and the Power BI version is $11.99 for larger datasets.
For related KPI explainers, see our 15 HR KPIs to track in 2026 and the 10 employee turnover and attrition metrics guides, both built on the same formula-plus-benchmark method.
Watch the templates in action on the NextGenTemplates YouTube channel, where every dashboard is demonstrated end to end.