Short answer: a CRM KPI dashboard does not have to become another premium Salesforce analytics line item. For many U.S. sales, customer success, and CRM operations teams, the real pain is not that Salesforce cannot report on customer metrics. It is that the useful executive-level reporting often lives in higher tiers, paid add-ons, implementation work, or analyst-maintained dashboards that keep adding cost every year.
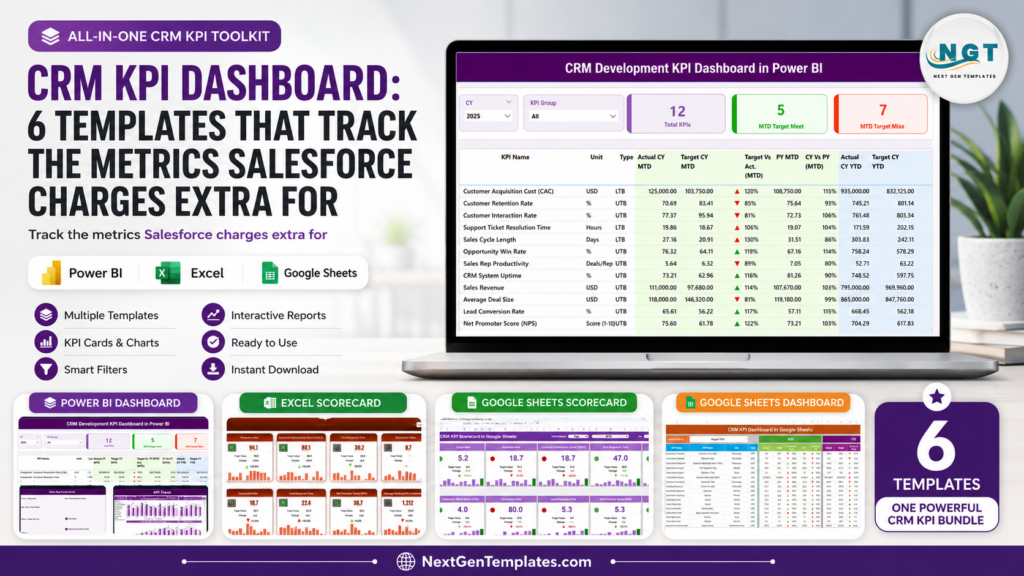
As of June 8, 2026, Salesforce lists Sales Cloud Enterprise at $175 per user per month, Unlimited at $350 per user per month, and Agentforce 1 Sales at $550 per user per month. Salesforce’s own add-on pricing also lists Revenue Intelligence at $220 per user per month. This roundup compares that SaaS pricing model with current NextGenTemplates CRM reporting templates priced from $11.99 to $14.99 each, including Power BI dashboards with regular list pricing of $17.99. The table below covers seven current product editions across Excel, Google Sheets, and Power BI so you can choose the right Salesforce alternative for CRM analytics without rebuilding reports from scratch.
Why CRM KPI Reporting Costs More Than Teams Expect
CRM leaders usually want a simple view: Are leads converting, are opportunities moving, are customers staying, and are teams hitting targets? The cost problem appears when those questions require more licenses, more add-ons, or custom reporting projects. Here are the numbers that matter before you buy another CRM analytics layer.
- Sales Cloud Enterprise is $175/user/month: A five-person sales operations or management team pays $10,500 per year before implementation, admin time, and optional analytics add-ons.
- Sales Cloud Unlimited is $350/user/month: That same five-person team reaches $21,000 per year for the CRM subscription tier alone.
- Revenue Intelligence is listed at $220/user/month: For five users, the add-on math becomes $13,200 per year when billed annually, before the base CRM license.
- Agentforce 1 Sales is $550/user/month: A five-user team would spend $33,000 per year on that tier. That may fit enterprise AI workflows, but it is heavy for basic CRM KPI monitoring.
- The seven templates in this guide total $94.93 at current sale prices: Every product here is under $15 today, and each gives you a practical CRM KPI dashboard, scorecard, or analytics template in a format your team can own.
Compare the CRM KPI Dashboard Templates
| Template | Format | Best For | Price |
|---|---|---|---|
| CRM Development KPI Dashboard in Power BI | Power BI | CRM product owners, CRM development managers, and BI users who need MTD/YTD analytics | $11.99 |
| CRM Development KPI Dashboard in Excel | Excel | CRM development teams that want an editable workbook with targets, trends, and KPI definitions | $14.99 |
| CRM KPI Scorecard in Google Sheets | Google Sheets | Cloud-based teams that need shared scorecard tracking and color-coded performance views | $12.99 |
| CRM KPI Scorecard in Excel | Excel | Sales, marketing, and support teams that want a compact scorecard instead of a full dashboard | $14.99 |
| CRM KPI Dashboard in Google Sheets | Google Sheets | Managers who need collaborative lead, sales, retention, and opportunity monitoring | $12.99 |
| CRM KPI Dashboard in Excel | Excel | Teams that want a classic Excel CRM analytics template for lead conversion and retention | $14.99 |
| CRM KPI Dashboard in Power BI | Power BI | Sales leaders and analysts who want interactive CRM visuals, slicers, and Power BI reporting | $11.99 |
7 CRM KPI Dashboard Templates to Consider
1. CRM Development KPI Dashboard in Power BI
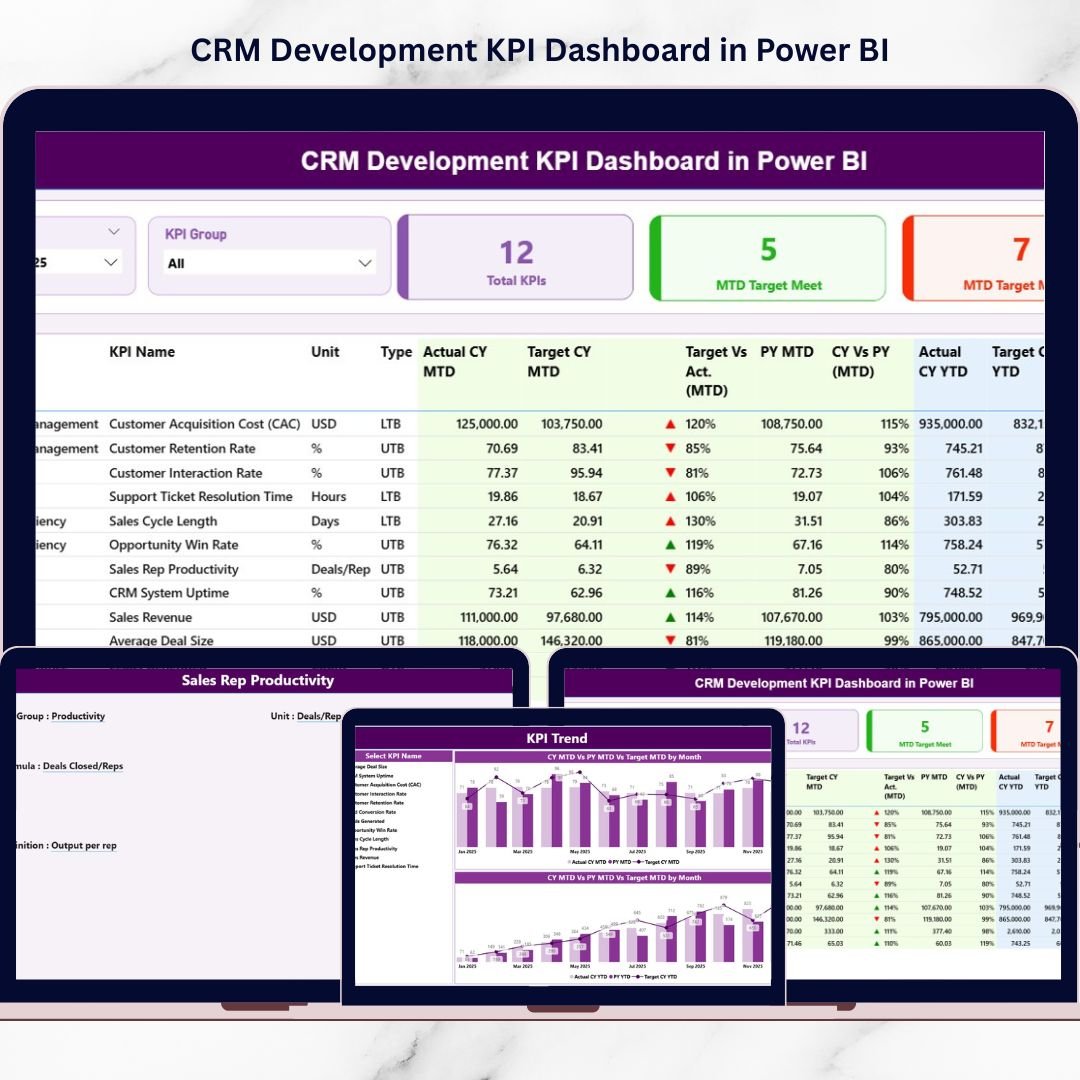
The CRM Development KPI Dashboard in Power BI is best for CRM product owners, technical CRM teams, SaaS teams, and business analysts who need a CRM KPI dashboard with a stronger development-performance angle. Instead of looking only at sales and customer outcomes, this template helps teams monitor CRM development productivity, revenue contribution, customer engagement, targets, previous-year movement, and KPI definitions in one Power BI report.
Screenshot notes: what’s inside
The product screenshots show a structured Power BI dashboard with a summary page, KPI trend page, and KPI definition drill-through page. Expect slicers for month and KPI group, MTD and YTD comparisons, target meet and missed count cards, visual up/down indicators, and trend charts comparing actuals, targets, and previous-year values.
Use cases: track CRM feature delivery KPIs, review monthly performance with executives, compare development output against targets, and standardize KPI definitions for business and technical stakeholders. At $11.99, it is a lean Salesforce alternative when you want interactive CRM analytics in Power BI without buying Revenue Intelligence for every reviewer. View the CRM Development KPI Dashboard in Power BI.
This template is also useful when the CRM team is expected to explain both business outcomes and delivery activity in the same meeting. A sales leader can see target misses, while a CRM product owner can open the KPI definition view and explain exactly how the metric is calculated.
2. CRM Development KPI Dashboard in Excel
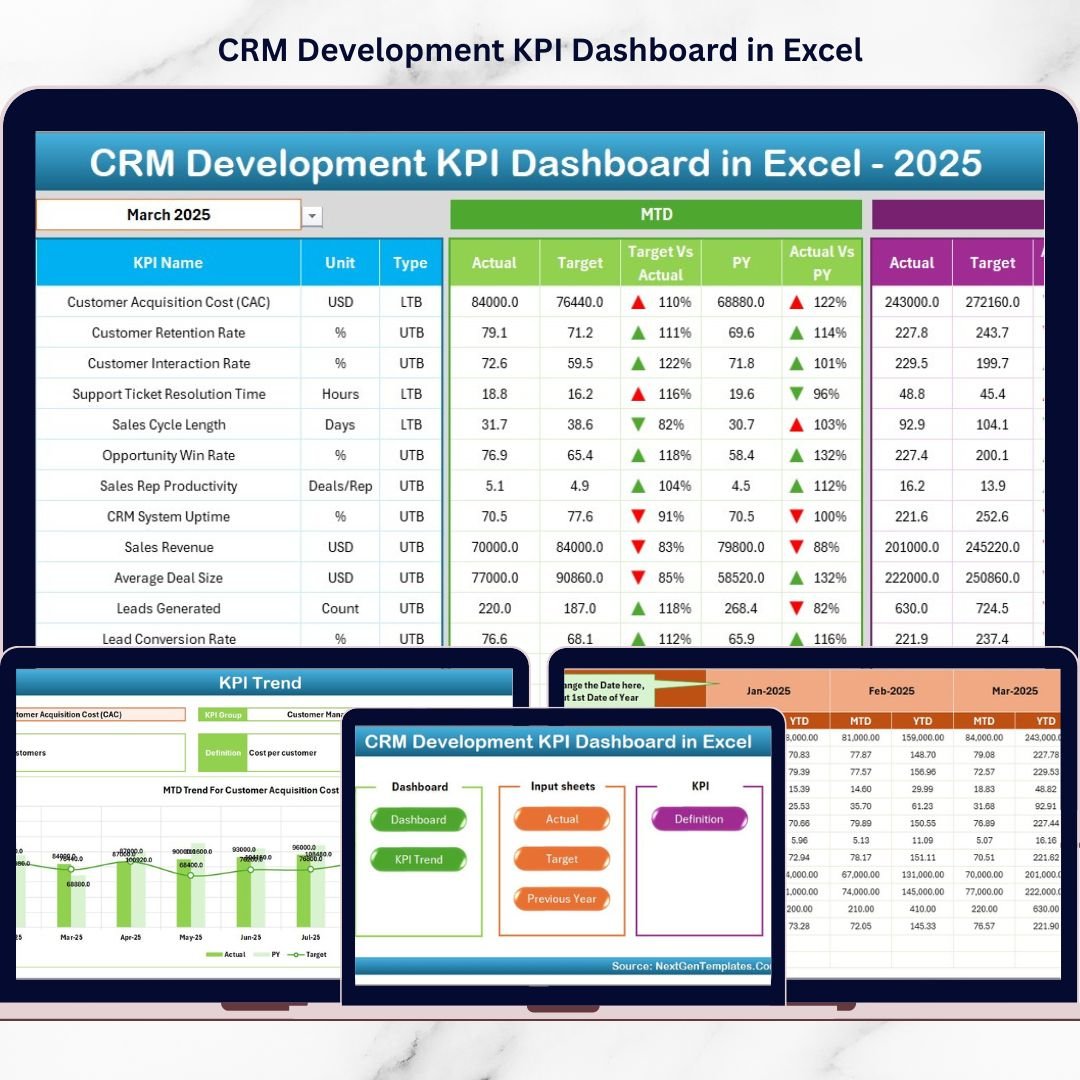
The CRM Development KPI Dashboard in Excel is for teams that want the same management discipline in a spreadsheet environment. If your CRM admin, sales ops manager, or startup founder already lives in Excel, this version gives you a ready-made reporting structure without needing a Power BI model or a Salesforce analytics add-on.
Screenshot notes: what’s inside
The screenshots show a seven-sheet Excel workbook: Home, Dashboard, KPI Trend, Actual Numbers Input, Target, Previous Year, and KPI Definition. The dashboard includes a month selector, MTD/YTD tracking, target vs actual views, conditional formatting arrows, previous-year comparison, and a trend sheet where users can select a KPI and analyze movement over time.
Use cases: run monthly CRM development reviews, prepare management packs from Excel, monitor target misses before leadership meetings, and keep KPI formulas documented in one workbook. At $14.99, it is especially useful for teams that want a CRM analytics template with no new platform rollout. Get the CRM Development KPI Dashboard in Excel.
The Excel format makes this option easy to adapt for small and mid-sized teams that export CRM data on a schedule. You can treat the workbook as a management layer, update actuals and targets each month, and keep the dashboard consistent even if the source CRM changes later.
3. CRM KPI Scorecard in Google Sheets
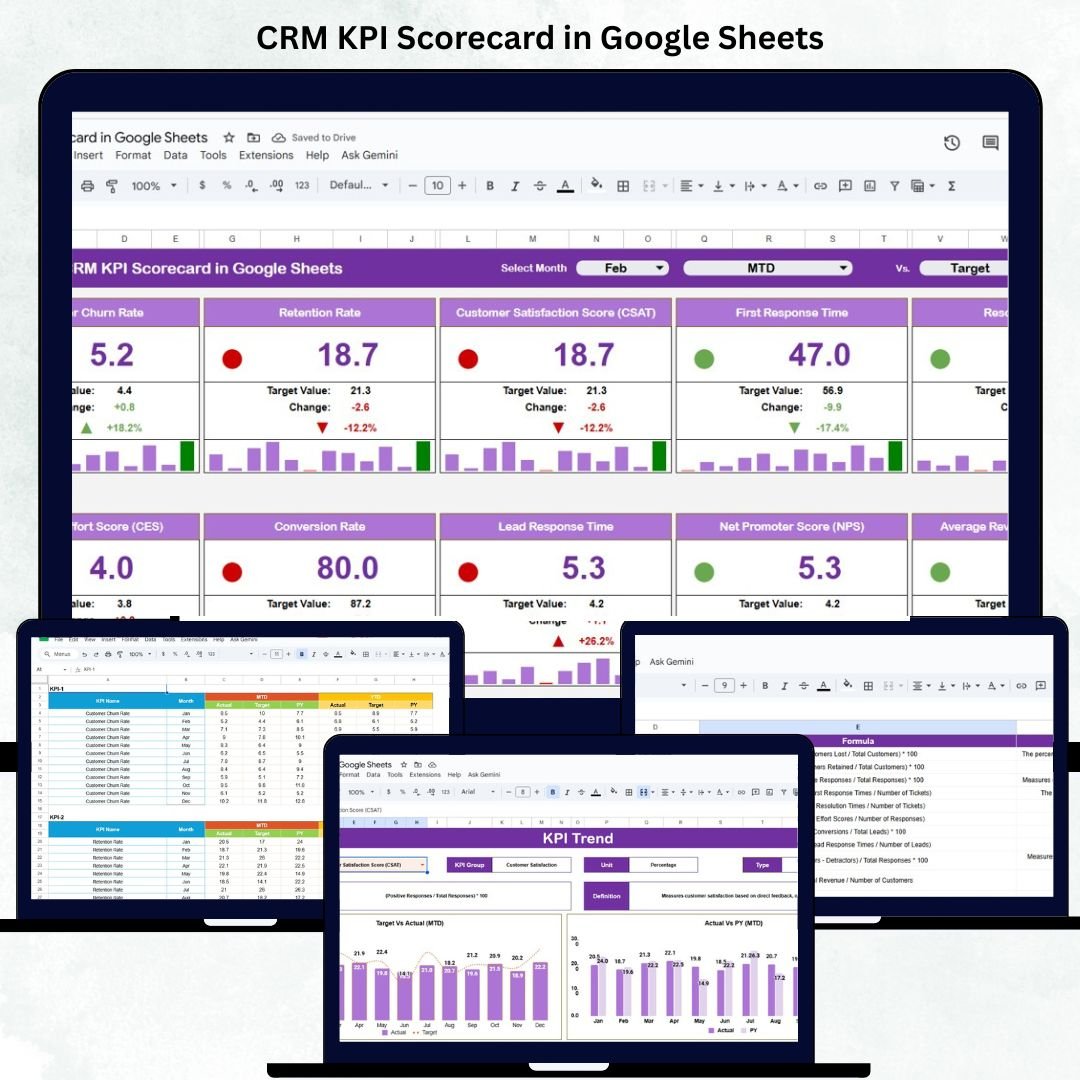
The CRM KPI Scorecard in Google Sheets is a good fit for distributed teams that want lightweight CRM KPI tracking in a shared cloud file. It is less about building a full BI environment and more about getting a clean scorecard that managers can open, update, and discuss without asking for dashboard development support.
Screenshot notes: what’s inside
The product screenshots show five practical Google Sheets tabs: Scorecard, Trend, KPI Definition, Data Input, and Color Settings. The scorecard includes a month selector, MTD and YTD toggles, color-coded performance indicators, and arrows for performance movement. The trend view helps isolate one KPI at a time, while the color settings tab lets teams adjust thresholds and visual cues.
Use cases: monitor sales conversion, review customer satisfaction trends, share CRM performance with department heads, and give startups a simple target-tracking file. At $12.99, this template works well when your team wants a collaborative CRM KPI dashboard but does not need enterprise Salesforce analytics. Open the CRM KPI Scorecard in Google Sheets.
Because it is built in Google Sheets, this scorecard is especially practical for teams that need shared accountability. One person can maintain the input data, managers can review the scorecard, and leadership can see the same target status without asking for a new Salesforce report.
4. CRM KPI Scorecard in Excel
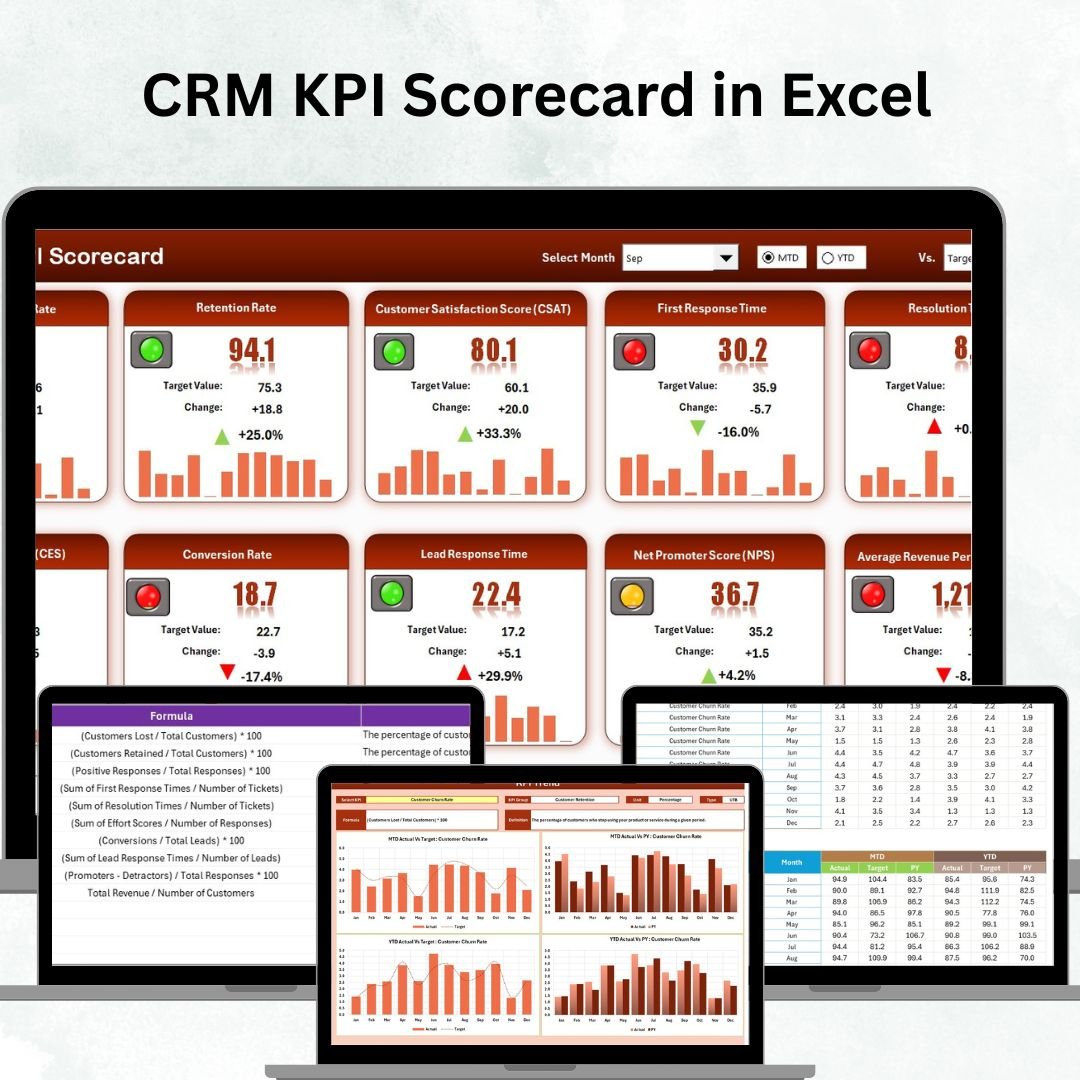
The CRM KPI Scorecard in Excel is the spreadsheet scorecard option for sales, marketing, and customer support teams that want a compact performance view. It is useful when you do not need a multi-page dashboard but still need Actual vs Target comparisons, MTD/YTD status, KPI trend analysis, and KPI definitions in a controlled workbook.
Screenshot notes: what’s inside
The screenshots show four organized worksheets: Scorecard, KPI Trend, Input Data, and KPI Definition. The scorecard presents CRM performance by KPI group, the trend page compares Actual, Target, and Previous Year values, and the input sheet centralizes monthly values so reporting stays consistent.
Use cases: review lead conversion and customer retention, monitor customer service response metrics, prepare scorecard snapshots for weekly meetings, and align sales and marketing teams around the same definitions. At $14.99, it is a practical CRM analytics template for teams that need discipline more than another subscription. Download the CRM KPI Scorecard in Excel.
Use this version when stakeholders want a clean status conversation rather than a dense analytics workbook. The scorecard structure is easy to explain: enter the data, compare against targets, review the trend, and decide which CRM metric needs attention this month.
5. CRM KPI Dashboard in Google Sheets
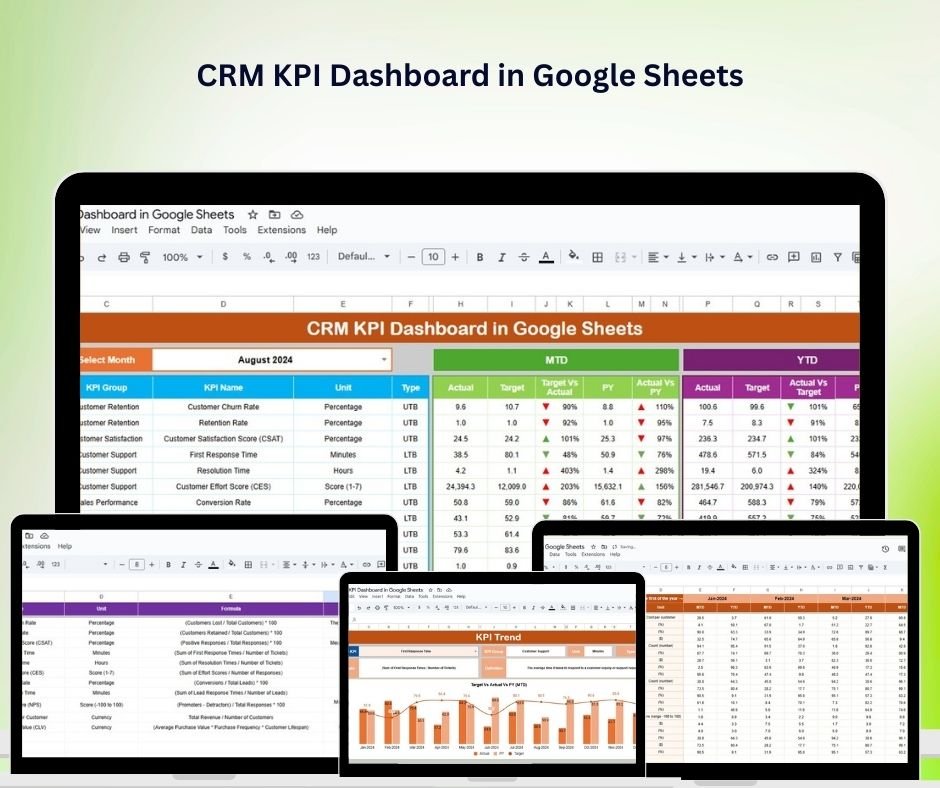
The CRM KPI Dashboard in Google Sheets is the better choice when your team wants a broader Google Sheets dashboard instead of a scorecard-only layout. It is built for sales managers, CRM managers, customer service leads, and business owners who want to monitor lead management, customer acquisition, customer retention, opportunity tracking, and sales performance in a collaborative file.
Screenshot notes: what’s inside
The screenshots highlight a visual dashboard with CRM tracking sections, interactive charts, and Google Sheets-based data entry. It is designed around sales performance monitoring, lead conversion, customer acquisition, retention analysis, opportunity value, and visual dashboard elements that update as data changes.
Use cases: manage lead-to-customer conversion, track opportunity value, monitor retention rate, review sales activity, and share CRM results with remote teams. At $12.99, it is a strong Salesforce alternative for teams that already use Google Workspace and want CRM visibility without waiting for a custom report build. View the CRM KPI Dashboard in Google Sheets.
This is the more dashboard-oriented Google Sheets choice. Pick it when leadership wants charts, sections, and a broader operating view, not just a target score. It is also useful for teams that want quick collaboration but still need visuals that feel presentation-ready.
6. CRM KPI Dashboard in Excel
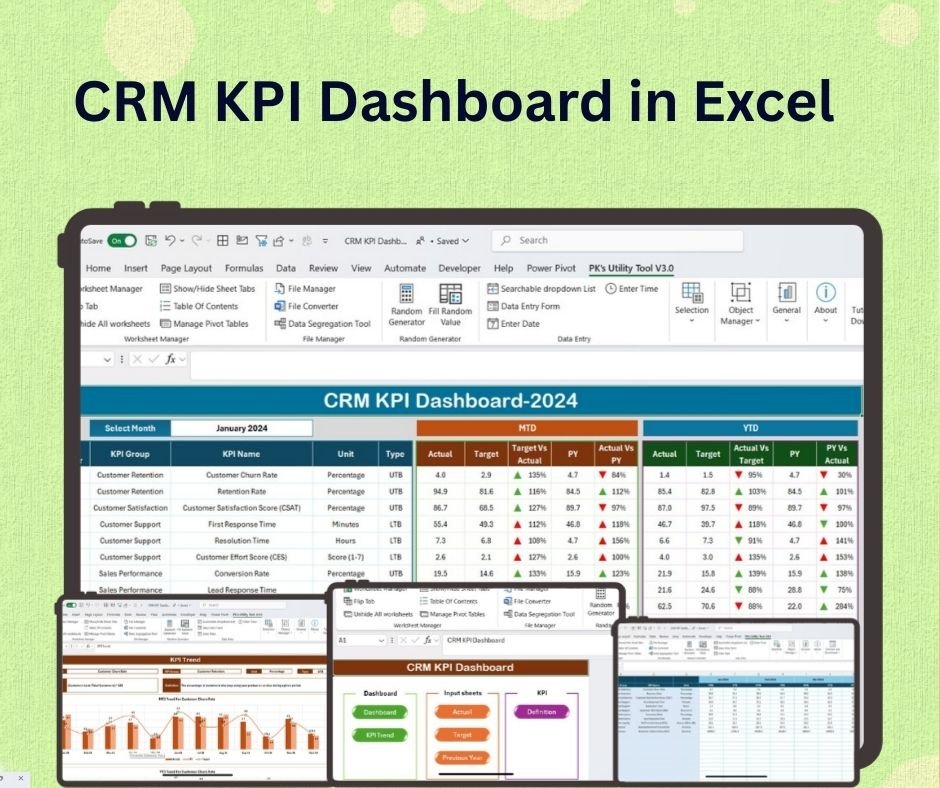
The CRM KPI Dashboard in Excel is the classic spreadsheet dashboard for customer relationship management reporting. If your team exports data from Salesforce, HubSpot, Zoho, Pipedrive, or another CRM into Excel, this template gives you a ready-made place to track sales performance, lead conversion, customer acquisition cost, customer retention, and CRM ROI.
Screenshot notes: what’s inside
The screenshots show dashboard visuals for CRM performance, lead management, customer retention, sales trends, and customizable charts. The design focuses on a centralized view that can support weekly performance reviews, monthly sales meetings, or quick management updates.
Use cases: analyze lead conversion trends, compare sales performance by period, monitor customer retention, review customer acquisition metrics, and prepare simple executive summaries. At $14.99, this CRM KPI dashboard is ideal when your organization trusts Excel and wants faster reporting without Salesforce Revenue Intelligence costs. Buy the CRM KPI Dashboard in Excel.
This is the safest starting point for many operations teams because it fits the export-and-review workflow they already know. It can support a weekly sales huddle, a monthly customer success review, or a simple executive reporting pack without new user licenses.
7. CRM KPI Dashboard in Power BI

The CRM KPI Dashboard in Power BI is the best option for teams that want interactive CRM analytics in Microsoft Power BI. It is useful for sales leaders, customer success managers, data analysts, and business owners who want slicers, visual charts, and BI-style exploration without starting from a blank report canvas.
Screenshot notes: what’s inside
The screenshots show Power BI visuals for customer acquisition, churn, customer lifetime value, sales performance, customer satisfaction, and CRM relationship health. The report is designed for interactive filtering, sales and retention analysis, and KPI review sessions where managers need to drill into performance quickly.
Use cases: build a Power BI CRM reporting layer, track customer acquisition cost and churn, monitor sales performance, review retention metrics, and create executive-friendly dashboard views from CRM exports. At $11.99, this is one of the lowest-cost ways to get a CRM KPI dashboard experience that feels closer to a BI analytics add-on. Get the CRM KPI Dashboard in Power BI.
Choose this template when the business wants interactive reporting but does not need every Salesforce user inside an advanced analytics SKU. A BI analyst can refresh the model, publish the report internally, and give sales leaders a familiar Power BI experience for CRM performance reviews.
How to Choose Between These CRM Templates
Choose the template based on the reporting workflow your team already uses. The right Salesforce alternative is not always the most advanced file; it is the one your managers will actually update before the next review meeting.
- Choose Power BI if you want executive analytics: Pick CRM KPI Dashboard in Power BI for sales and customer metrics, or CRM Development KPI Dashboard in Power BI when development delivery and KPI definitions matter.
- Choose Excel if your data process is spreadsheet-led: Use CRM KPI Dashboard in Excel for a full dashboard, CRM KPI Scorecard in Excel for compact target tracking, or CRM Development KPI Dashboard in Excel for CRM project and development reviews.
- Choose Google Sheets for collaborative reporting: The CRM KPI Dashboard in Google Sheets works well for shared sales and retention reporting, while the CRM KPI Scorecard in Google Sheets is stronger for monthly performance status and quick color-coded reviews.
- Choose a scorecard when leadership wants status: Scorecards are better for red/yellow/green performance conversations, target misses, and action items.
- Choose a dashboard when leadership wants exploration: Dashboards are better for charts, trends, segments, and broader CRM performance analysis.
If your organization already pays for Salesforce, these templates do not need to replace the CRM. They can sit beside it as a lower-cost reporting layer for exports, management reviews, KPI packs, and teams that need visibility without another premium analytics license.
Frequently Asked Questions
What is a CRM KPI dashboard?
A CRM KPI dashboard is a reporting view that tracks customer relationship metrics such as lead conversion, sales pipeline value, customer acquisition, customer retention, churn, customer satisfaction, and target performance. It helps managers see whether CRM activity is producing measurable business results.
Is a CRM KPI dashboard a Salesforce alternative?
A CRM KPI dashboard template can be a Salesforce alternative for reporting, not necessarily for contact management or deal management. Many teams still use Salesforce as the system of record but use Excel, Google Sheets, or Power BI templates for cheaper KPI reporting and leadership dashboards.
Why compare these templates with Salesforce analytics add-ons?
The comparison matters because Salesforce analytics and revenue intelligence features can involve per-user monthly pricing, higher editions, or paid add-ons. A one-time template purchase is not a full CRM platform, but it can cover many practical KPI reporting needs at a much lower cost.
Which template is best for Power BI users?
Power BI users should start with the CRM KPI Dashboard in Power BI for general sales, retention, satisfaction, and customer analytics. Choose the CRM Development KPI Dashboard in Power BI when you also need CRM development performance, target tracking, KPI definitions, and MTD/YTD reporting.
Which CRM analytics template is best for Excel?
Choose the CRM KPI Dashboard in Excel for broad CRM reporting, the CRM KPI Scorecard in Excel for compact target status tracking, and the CRM Development KPI Dashboard in Excel when your reporting also covers CRM development teams, productivity, and project-style KPI reviews.
Which option works best for remote teams?
Remote teams usually benefit from Google Sheets because files are cloud-based and easy to share. The CRM KPI Dashboard in Google Sheets is best for broader collaborative reporting, while the CRM KPI Scorecard in Google Sheets is better for quick monthly KPI status reviews.
Can these templates replace Salesforce reports?
They can replace many manual KPI reports, spreadsheet trackers, and management dashboards, especially when teams export CRM data on a regular cadence. They should not be positioned as a full replacement for Salesforce data capture, workflow automation, security, permissions, or CRM database functions.
Do I need coding skills to use these CRM KPI templates?
No. These templates are designed for business users who can update input tables, targets, previous-year values, and KPI definitions. Power BI users should be comfortable refreshing a report, while Excel and Google Sheets users can work mostly inside familiar spreadsheet tabs.
How much do the featured CRM templates cost?
The featured templates currently range from $11.99 to $14.99. The two Power BI products are $11.99 each, the two Google Sheets products are $12.99 each, and the Excel products are $14.99 each. The total current sale price for all seven listed products is $94.93.
What metrics should a CRM KPI dashboard include?
A practical CRM KPI dashboard should include lead conversion rate, opportunity value, customer acquisition cost, customer retention, churn, customer satisfaction, sales performance, target vs actual performance, previous-year comparison, and trend analysis. Development-focused CRM dashboards may also include delivery, productivity, and system-performance KPIs.
Final Recommendation
If Salesforce is your CRM system of record, keep it where it works best: contacts, accounts, opportunities, workflows, and customer history. But when the question is leadership-ready CRM reporting, a lower-cost CRM KPI dashboard can handle a surprising amount of the work. Start with the format your team already trusts, then expand only if the reporting workflow proves valuable.
Closing CTA: Pick your CRM dashboard format
For Excel reporting, start with the CRM KPI Dashboard in Excel. For shared cloud reporting, use the CRM KPI Dashboard in Google Sheets. For interactive BI analytics, choose the CRM KPI Dashboard in Power BI. If you need CRM development metrics, use the Excel or Power BI development dashboard versions.
About the author: Built by PK – Microsoft Certified Professional with 15+ years of Excel, Google Sheets, and Power BI experience. Founder of NextGenTemplates, reaching 300K+ subscribers across YouTube channels. Every template is hand-built and tested before release.
For walkthroughs, dashboard ideas, and template tutorials, visit the NextGenTemplates YouTube channel.