

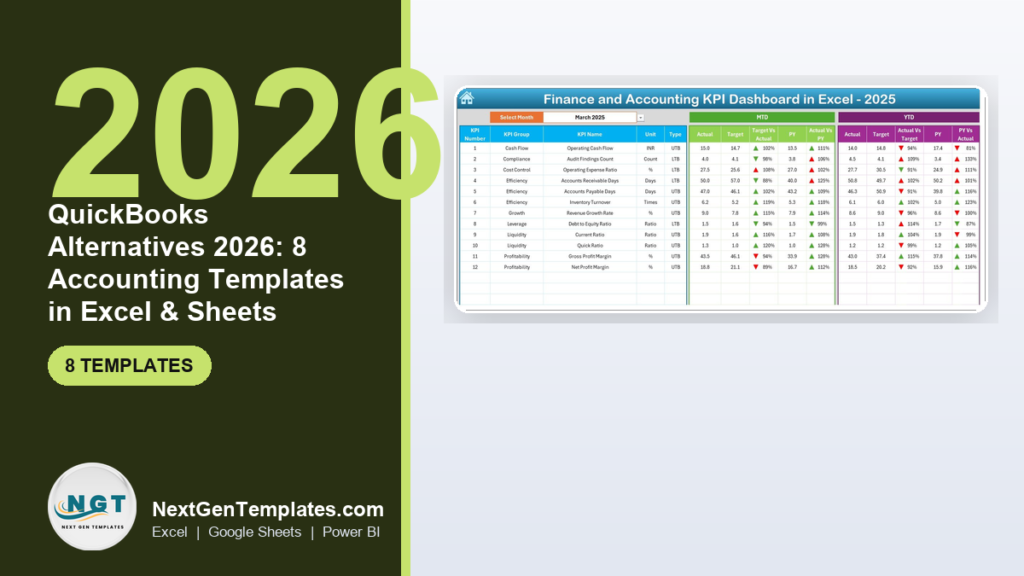
The best QuickBooks alternative in Excel or Google Sheets is a one-time accounting dashboard that handles the reporting layer – KPIs, cash flow, receivables and P&L – without a monthly subscription. Our top pick is the Finance and Accounting KPI Dashboard in Excel ($14.99, paid once). It is not a general ledger, and we say exactly where that line falls.
Last updated: August 2026
Related guide: Replacing payroll rather than bookkeeping? See Gusto alternatives: 6 payroll templates in Excel & Sheets.
Related guide: Keeping the books in spreadsheets after you cancel? See the bookkeeper templates stack: 8 tools for ledgers, AP/AR, expenses and cash flow.
Key takeaways
- QuickBooks Online raised prices on 1 August 2026: Essentials went from $60 to $85, Plus from $99 to $140, and Advanced from $200 to $340 per month. Plus alone is now $1,680 a year.
- All 8 templates in this guide are one-time purchases between $8.99 and $19.99. Buying every one of them costs $111.92 once – about 24 days of a QuickBooks Plus subscription.
- Best overall is the Finance and Accounting KPI Dashboard in Excel ($14.99); best value is the Accounts Receivable KPI Dashboard in Google Sheets ($8.99).
- A spreadsheet template is not a general ledger. None of these do double-entry bookkeeping, bank feeds, payroll tax filing or e-invoicing compliance – they are dashboards and trackers that sit on top of your numbers.
- The realistic switch for most small teams is downgrade-plus-template, not cancel: drop to a cheaper QuickBooks tier for the ledger and move reporting into a file you own.
 Launch offer
SUMIFS, XLOOKUP, FILTER, LAMBDA and checking AI-written formulas, with real business projects. 11h 47m of video by PK, with practice files, quizzes and a capstone.
Why small teams look for a QuickBooks alternative in 2026
QuickBooks is the default small-business accounting system in the US for good reasons: bank feeds work, accountants know it, and the compliance side is handled. Teams still go looking for alternatives, and in 2026 the reasons cluster into three.
1. The subscription just repriced, hard. Effective 1 August 2026, Intuit raised the monthly list price of QuickBooks Online Essentials from $60 to $85, Plus from $99 to $140, and Advanced from $200 to $340. That is a 41% jump on Plus and a 70% jump on Advanced in one step. Simple Start ($38/month, one user), Ledger, Lite and the free tier were not part of that increase. Confirm the current figures on the official QuickBooks pricing page before you budget – tiers and promotional rates move, and new subscribers often hold an introductory rate for the first six invoices. At list price, a five-user business on Plus now pays $1,680 a year, every year, and payroll is a separate add-on on top.
2. You are paying for modules you never open. The gap between Essentials at $85 and Plus at $140 is mostly inventory tracking, project profitability and budgeting. Plenty of service businesses upgrade for one of those three, use it in the first month, and then never look at it again while the extra $55 a month keeps leaving the account. The same is true one tier up: Advanced buys batch invoicing, custom permissions and workflow automation that a six-person firm will rarely touch.
3. Reporting is the part people actually fight with. This is the real driver, and it is worth being precise about it. Most teams are not unhappy with QuickBooks’ bookkeeping. They are unhappy that getting a board-ready view – DSO trend, gross margin against target, cash runway, utilisation by client – means exporting to a spreadsheet anyway, then rebuilding the same charts every month. If that is your complaint, you do not need a different ledger. You need a better reporting layer, and that is exactly what a template is.
A one-time template flips the cost and the control. You pay once, you own the file, every formula is visible, and there is no seat to renew. What it does not flip is compliance. Read the honest-limits section before you cancel anything.
QuickBooks vs the NGT template that covers it
Here is the head-to-head, and we have kept it honest. The middle column is the one that matters: some QuickBooks jobs a spreadsheet genuinely covers, and some it does not cover at all.
| What you use QuickBooks for | Can a template cover it? | NGT template | One-time price |
|---|---|---|---|
| Financial KPI reporting (MTD/YTD vs target) | Yes – fully | Finance and Accounting KPI Dashboard in Excel | $14.99 |
| Cash flow monitoring and runway | Yes – fully | Cash Flow KPI Dashboard in Google Sheets | $9.99 |
| Receivables ageing, DSO, collections tracking | Yes – fully | Accounts Receivable KPI Dashboard in Google Sheets | $8.99 |
| Client/job profitability and utilisation | Yes – fully | Accounting Firms KPI Dashboard in Excel | $14.99 |
| Expense claims and reimbursement workflow | Yes – fully | Expense Reimbursement Management System in Excel VBA | $19.99 |
| P&L presentation and cost breakdown | Partly – you supply the figures | Restaurant Profit and Loss Dashboard in HTML | $12.99 |
| Audit trail and control monitoring | Partly – it tracks, it does not enforce | Finance and Accounting Regulatory Adherence KPI Dashboard | $14.99 |
| Outsourced/multi-client delivery tracking | Yes – fully | Outsourced Accounting KPI Dashboard in Excel | $14.99 |
| Double-entry general ledger | No – keep QuickBooks | – | – |
| Bank feeds and transaction matching | No – keep QuickBooks | – | – |
| Payroll runs and payroll tax filing | No – keep QuickBooks or a payroll tool | – | – |
| Sales tax filing and e-invoicing compliance | No – keep QuickBooks | – | – |
Four rows say “keep QuickBooks”. That is not modesty, it is the whole point of this guide: the templates below replace the reporting and monitoring half of what you are paying for, which is usually the half that pushed you up a tier.
One job sits deliberately outside that table: raising the invoice itself. If sending branded invoices is the QuickBooks feature you would miss most, our invoice and billing templates in Excel cover that separately, and they pair well with the receivables dashboard at #2 below. If you only need a basic invoice for now, our list of free invoice templates covers the best no-cost options.
QuickBooks alternative templates compared
Every template in this guide, side by side. Two rows are flagged: one best overall and one best value.
| Template | Format | Best for | Price |
|---|---|---|---|
| Finance and Accounting KPI Dashboard (Best overall) | Excel | Whole-company financial KPI reporting | $14.99 |
| Accounts Receivable KPI Dashboard (Best value) | Google Sheets | DSO, ageing and collections in the cloud | $8.99 |
| Cash Flow KPI Dashboard | Google Sheets | Inflow/outflow tracking and runway | $9.99 |
| Accounting Firms KPI Dashboard | Excel | CPA firms: billing, realisation, retention | $14.99 |
| Outsourced Accounting KPI Dashboard | Excel | Multi-client bookkeeping delivery | $14.99 |
| Expense Reimbursement Management System | Excel VBA | Employee claims and approval workflow | $19.99 |
| Finance and Accounting Regulatory Adherence KPI Dashboard | Excel | Compliance and audit-finding tracking | $14.99 |
| Restaurant Profit and Loss Dashboard | HTML | Multi-branch P&L in a browser | $12.99 |
Total for all eight: $111.92, one time. QuickBooks Plus at $140 a month passes that figure on day 24.
How we picked these
We searched the NextGenTemplates catalogue of roughly 6,900 published products for finance, accounting, cash flow, receivables and expense templates across Excel, Google Sheets, Excel VBA and HTML, then filtered to the ones that reproduce a job people currently pay a QuickBooks tier to do. We excluded anything that would need a full chart of accounts to be useful, anything without editable formulas, and every free file – a reporting layer you cannot adapt to your own KPI definitions is not a reporting layer. We deliberately did not include products that imply general-ledger capability, because none of them have it. Two nonprofit dashboards originally shortlisted for this guide were dropped for exactly that reason: they were fundraising dashboards, not accounting tools.
The 8 best QuickBooks alternative templates for 2026
1. Finance and Accounting KPI Dashboard in Excel – best overall
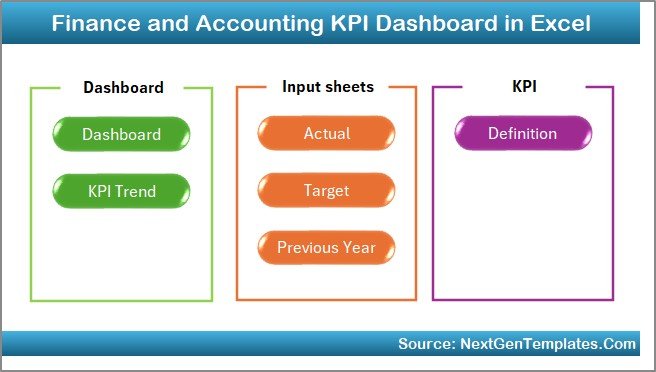
This is the single file that covers the widest slice of what a small finance team opens QuickBooks for. It brings twelve financial KPIs – operating cash flow, current ratio, quick ratio, debt-to-equity, gross and net margin, DSO, DPO, inventory turnover, revenue growth, operating expense ratio and audit findings – into one month-picker scorecard with MTD and YTD columns against target and prior year.
Who it is for: an owner or controller who wants the board view without exporting from QuickBooks and rebuilding charts every month.
What is inside:
- Dashboard, KPI Trend and Definition tabs, plus separate Actual, Target and Previous Year input sheets
- Twelve pre-built KPI formulas with an “upper is better / lower is better” flag per metric
- Traffic-light conditional formatting on every variance column – no chart rebuilding
- A month dropdown that repoints the whole scorecard in one click
The practical workflow is a five-minute monthly paste: export your trial balance figures from QuickBooks, drop them into the Actual sheet, and the scorecard is done. A team that downgrades from Plus ($140) to Simple Start ($38) and runs reporting here saves $1,224 in year one against a $14.99 file. It is the same MTD/YTD scorecard architecture we use across our Power BI dashboard templates ranked by industry, so the logic will feel familiar if you already run one.
Best for: the broadest single-file replacement for QuickBooks’ reporting tab. $14.99 – view the template.
2. Accounts Receivable KPI Dashboard in Google Sheets – best value
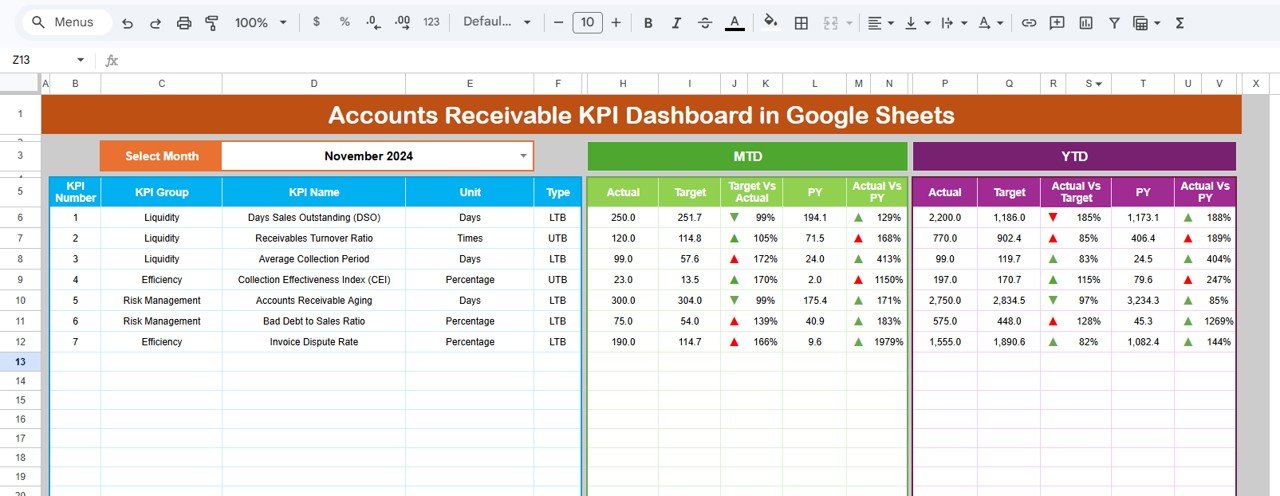
Getting paid is the cash problem, and QuickBooks’ ageing report tells you the balance without telling you whether collections are improving. This Google Sheets dashboard tracks 15+ AR metrics – DSO, Collection Effectiveness Index, ageing bucket percentages, bad debt ratio – across six worksheets with MTD and YTD trends.
Who it is for: a controller, AR clerk or founder chasing invoices who needs a trend, not a snapshot, and wants it on a link the whole team can open.
What is inside:
- DSO, CEI, average days delinquent and bad debt ratio with month-over-month movement
- Ageing buckets (current, 1-30, 31-60, 61-90, 90+) as both value and percentage of book
- Dropdown month selector with conditional-formatting arrows on every KPI
- Cloud-native sharing – collections gets edit access, the owner gets view-only
At $8.99 it is the cheapest template here and the one with the fastest payback. Pulling DSO down by five days on a $400,000 annual revenue business frees roughly $5,500 of working capital – a return of about 600x the file price in the first quarter. It runs on a free Google account, so there is no Microsoft 365 cost hiding behind it either.
Best for: the tightest budget and the fastest cash-flow win. $8.99 – view the template.
3. Cash Flow KPI Dashboard in Google Sheets
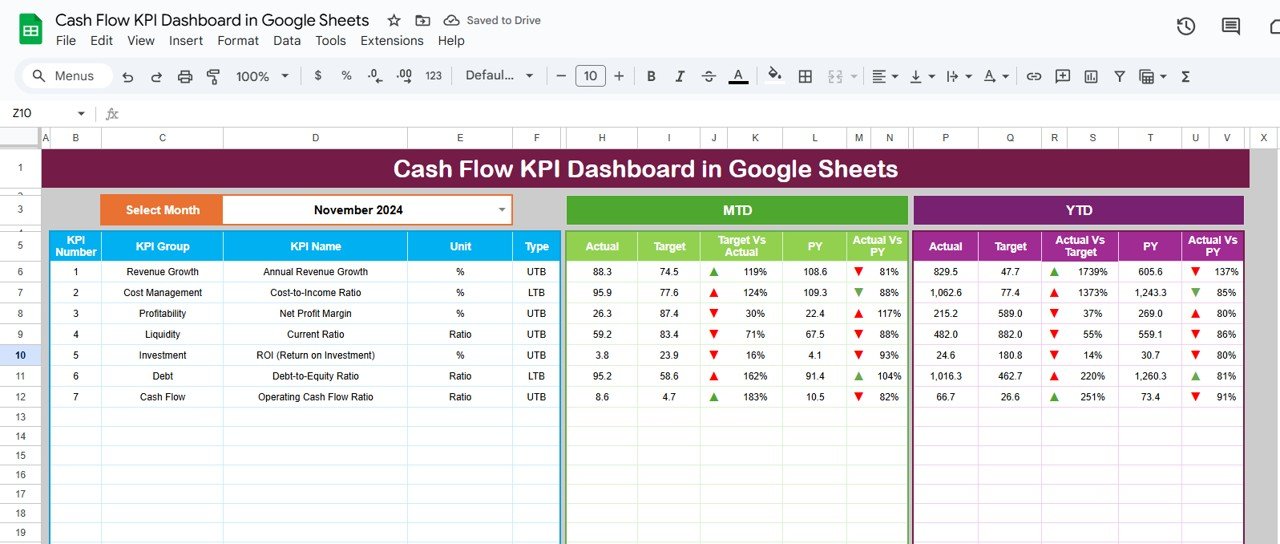
Profitable businesses fail on cash timing, not on margin. This dashboard converts inflows and outflows into a monthly picture of operating, investing and financing movement, with the trend view QuickBooks’ cash flow statement does not give you side by side.
Who it is for: startups, SMEs and consultants who need to answer “how many months of runway” without a spreadsheet rebuild each time.
What is inside:
- Operating, investing and financing cash flow split with net movement per month
- Opening and closing balance reconciliation with variance to plan
- Trend charts and KPI cards that recalculate as you paste new months
- Live cloud sharing for a weekly cash call
Run it as the twelve-month rolling view and the AR dashboard above as the weekly detail – together they cost $18.98 once and cover the two questions that actually kill small businesses. If you would rather stay in Excel, the Cash Flow KPI Dashboard in Excel ($12.99) is the same logic in a desktop workbook.
Best for: runway and liquidity monitoring in the cloud. $9.99 – view the template.
4. Accounting Firms KPI Dashboard in Excel
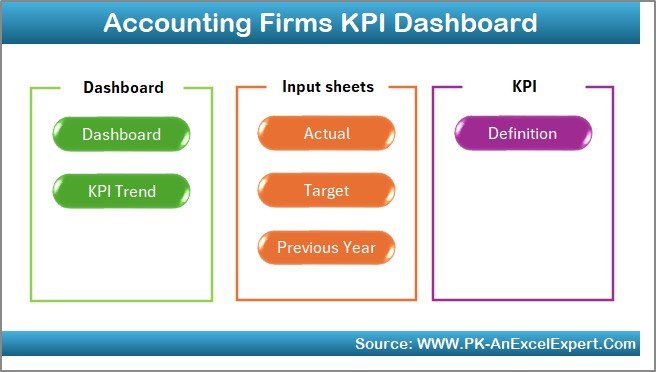
If you are the accountant rather than the client, your problem is not bookkeeping – it is practice performance. This dashboard tracks the firm-level metrics QuickBooks was never designed to report: realisation rate, billing efficiency, staff utilisation, client retention and revenue growth.
Who it is for: CPA firms and bookkeeping practices between roughly 3 and 40 staff who run client work in QuickBooks Online Accountant but have no view of their own numbers.
What is inside:
- Revenue growth, realisation and write-off tracking by period
- Utilisation and chargeable-hours ratios per team or service line
- Client retention and satisfaction metrics with target comparison
- Conditional formatting that flags any KPI drifting below target
The benchmark most firms manage against is roughly 55-65% utilisation on chargeable staff and 90%+ realisation; this gives you both on one page instead of a partner reconstructing them in a side spreadsheet each quarter. Firms that also manage staff records tend to pair it with the templates in our BambooHR alternatives roundup.
Best for: CPA and bookkeeping practice management. $14.99 – view the template.
Ready to cut the subscription line? Start with the Finance and Accounting KPI Dashboard in Excel at $14.99, one time. It is roughly 3 days of QuickBooks Plus at the new $140/month rate, and it does not renew.
5. Outsourced Accounting KPI Dashboard in Excel
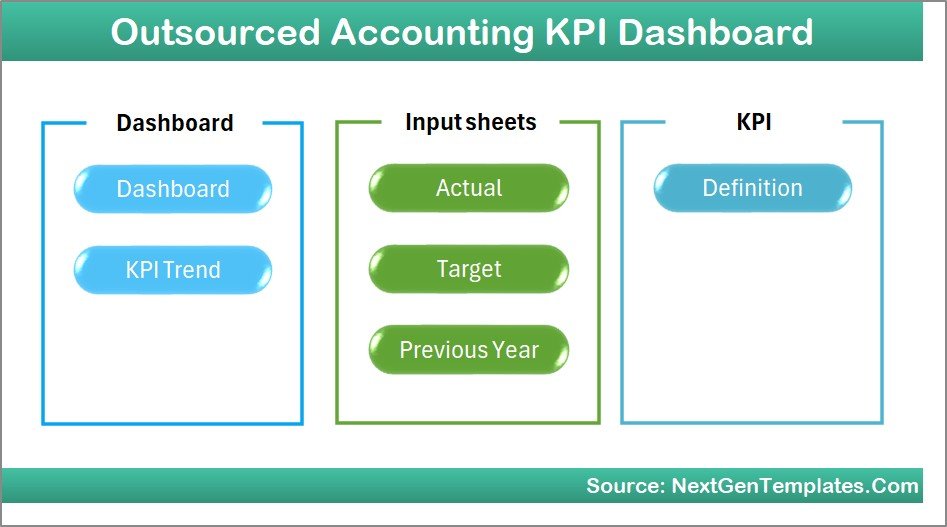
Built for the firm that runs accounts payable, receivable, payroll processing, bookkeeping and month-end close for other people. It tracks delivery performance across clients – turnaround time, error rate, deadline adherence and volume per process – which is the layer no accounting system reports on because it sits above them.
Who it is for: outsourced accounting providers, offshore finance teams and shared-service centres managing several client books at once.
What is inside:
- Process-level KPIs for AP, AR, payroll, reporting and tax preparation
- Turnaround time and accuracy tracking with target thresholds
- Deadline adherence and backlog monitoring per client
- MTD/YTD comparison with prior-year benchmarking
A provider running fifteen client books in QuickBooks Online Accountant still has no single view of whether close is slipping. This is that view, for $14.99 once, and it is client-agnostic – it does not care which ledger the underlying work lives in. Teams that also manage the client relationship side often run it alongside the tools in our Zoho CRM alternatives guide.
Best for: multi-client bookkeeping delivery management. $14.99 – view the template.
6. Expense Reimbursement Management System V1.0 in Excel VBA
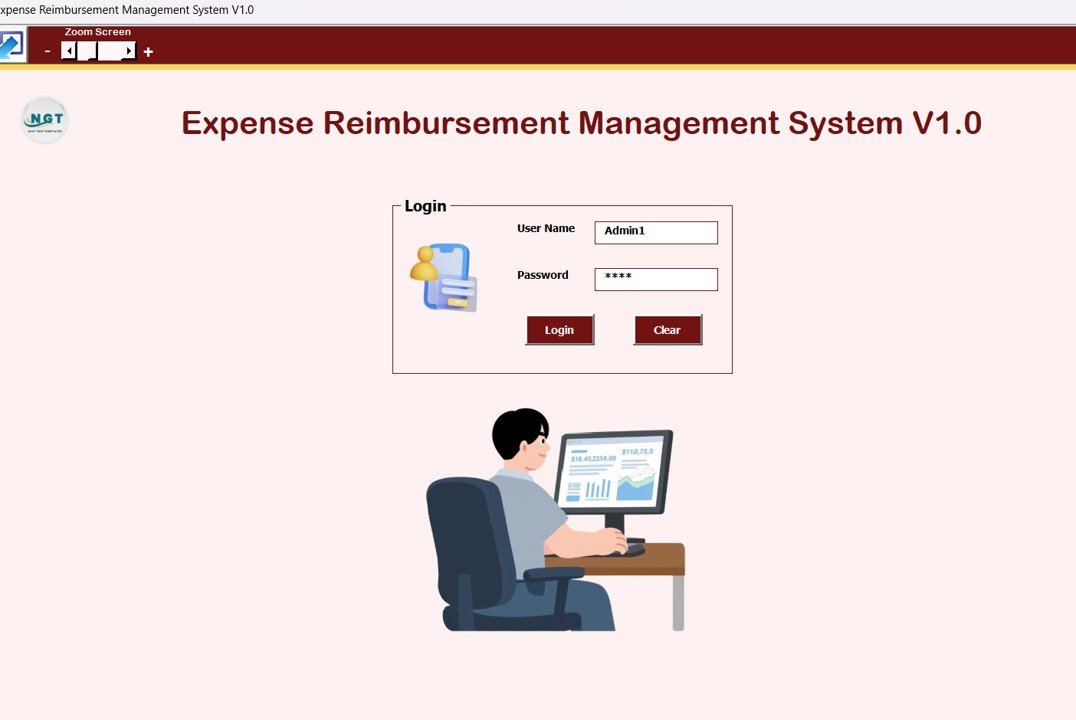
The one item on this list that is a system rather than a dashboard. QuickBooks handles expense categories; it is thinner on the claim-to-approval-to-payment workflow that employees actually touch. This VBA application covers submission, approval, status tracking and reporting in one macro-enabled workbook.
Who it is for: businesses of 10-100 staff currently processing expense claims through email threads and an unlocked spreadsheet.
What is inside:
- Form-driven claim entry with category, date, amount and receipt reference
- Approval status workflow and audit-friendly claim history
- Employee-wise and category-wise reimbursement reporting
- One-click summary reports for the finance team’s month-end
At $19.99 it is the most expensive template here and the only one that replaces a process rather than a report. If a five-person finance team spends 20 minutes a claim on chasing and re-keying, and processes 60 claims a month, cutting that in half returns ten hours a month – which is the actual case for buying it. Note that it runs macros, so it needs desktop Excel on Windows, not the browser version. If you only need recording rather than an approval workflow, the simpler files in our expense tracker Excel templates guide start lower, and the approval-routing logic here also complements the workflow tools in our ClickUp alternatives roundup.
Best for: employee expense claims and approval workflow. $19.99 – view the template.
7. Finance and Accounting Regulatory Adherence KPI Dashboard in Excel

Compliance is where “just use a spreadsheet” usually falls down, so read this one carefully. It does not file anything and it does not enforce a control. What it does is track how well you are meeting the obligations you already have: audit findings open and closed, filing deadlines met, control test results, exception counts and remediation ageing.
Who it is for: finance managers and compliance leads in regulated or audited businesses who need a monitoring layer above whatever ledger they run.
What is inside:
- Audit findings count and closure rate with target thresholds
- Filing and reporting deadline adherence percentage
- Control exception tracking with ageing on open items
- MTD/YTD trend view suitable for an audit committee pack
If your business faces an annual audit, the question “how many findings are still open and how old are they?” gets asked every year and is usually answered from memory. Having it on a $14.99 page, updated monthly, is a materially better answer. This is a supplement to your accounting system, not a substitute for it – the filings themselves still happen in QuickBooks or through your accountant.
Best for: compliance and audit-finding monitoring. $14.99 – view the template.
8. Restaurant Profit and Loss Dashboard in HTML
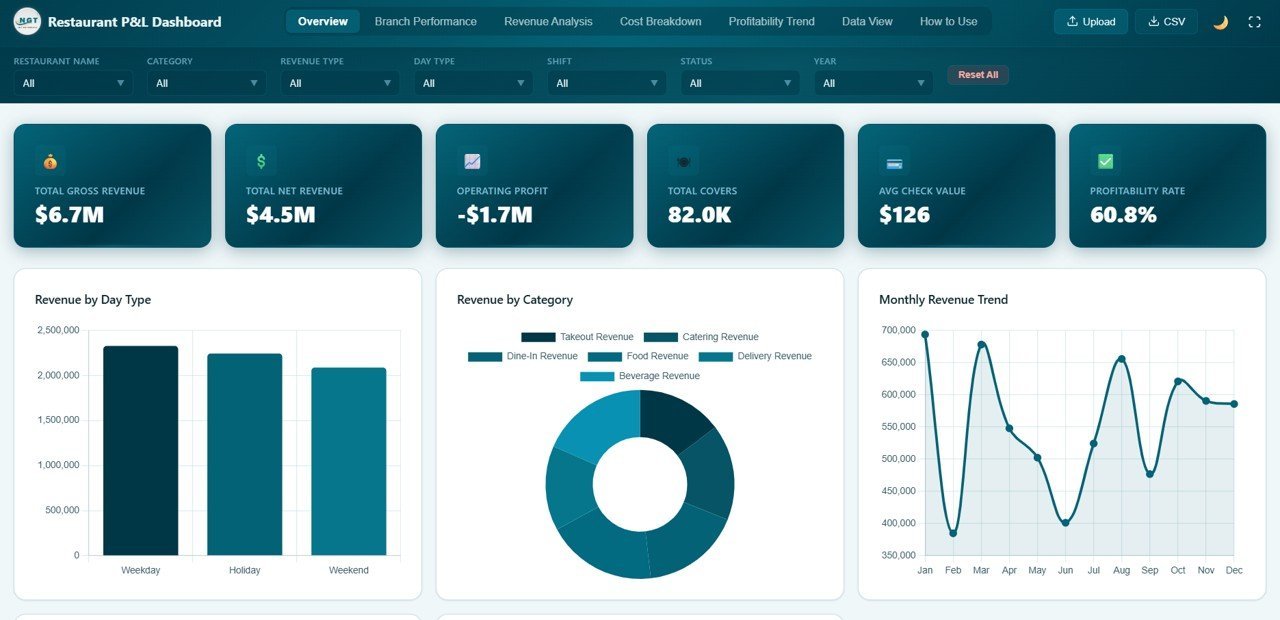
The outlier, and the one worth knowing about if you run more than one location. It is a browser-based P&L dashboard – no Excel, no Google account, no install – covering gross and net revenue, operating profit, COGS, labour cost and waste across multiple branches.
Who it is for: restaurant, cafe and multi-site hospitality operators whose managers will open a link but will not open a workbook.
What is inside:
- Five interactive pages: Overview, Branch Performance, Revenue Analysis, Cost Breakdown, Data View
- Branch-by-branch comparison of prime cost, labour percentage and waste
- Runs in any browser from a local file – nothing to install or license
- Editable data layer so you paste your own periods
Hospitality lives and dies on prime cost – COGS plus labour as a share of revenue, where roughly 60-65% is the usual healthy ceiling for a full-service restaurant. QuickBooks will give you the numbers; it will not put branch-versus-branch prime cost on one screen a manager can read in ten seconds. At $12.99, this does. It is our only HTML pick because it is the only format where “the manager will actually open it” was the deciding factor.
Best for: multi-branch P&L visibility without a spreadsheet. $12.99 – view the template.
How to choose between them
Pick by the job you are trying to take back from QuickBooks, not by format:
| If your problem is… | Buy this | Price |
|---|---|---|
| “I have no single view of our financial health” | Finance and Accounting KPI Dashboard (Excel) | $14.99 |
| “Customers pay us late and I cannot see the trend” | Accounts Receivable KPI Dashboard (Google Sheets) | $8.99 |
| “I do not know our runway” | Cash Flow KPI Dashboard (Google Sheets) | $9.99 |
| “My firm’s own numbers are invisible” | Accounting Firms KPI Dashboard (Excel) | $14.99 |
| “Client close deadlines keep slipping” | Outsourced Accounting KPI Dashboard (Excel) | $14.99 |
| “Expense claims live in my inbox” | Expense Reimbursement Management System (Excel VBA) | $19.99 |
| “Audit findings go untracked all year” | Regulatory Adherence KPI Dashboard (Excel) | $14.99 |
| “My branch managers will not open a spreadsheet” | Restaurant P&L Dashboard (HTML) | $12.99 |
Not sure? Start with the $8.99 receivables dashboard. It is the cheapest way to test whether a one-time file changes anything for you, and receivables is the job where a spreadsheet beats an accounting system most clearly, because the value is in the trend rather than the balance. If your bills are the bigger headache, the Accounts Payable KPI Dashboard in Excel ($12.99) is the mirror image.
When a template is NOT the right answer
We would rather keep a customer than sell the wrong thing, so here is the part most roundups leave out. None of these templates is an accounting system. They do not do double-entry bookkeeping, they have no chart of accounts, and they will not produce a set of statutory accounts. Concretely:
- No double-entry ledger. There are no debits and credits, no journals and no trial balance that self-balances. You paste in figures; nothing stops you pasting in figures that do not reconcile. That is a real risk and you should treat these files as reporting on top of a ledger, never as the ledger.
- No bank feeds or transaction matching. QuickBooks pulls your bank and card transactions automatically and matches them to invoices and bills. A spreadsheet does none of that. If reconciliation is the hours you want back, a template will not give them to you.
- No payroll or payroll tax filing. Running payroll, calculating withholding and filing payroll taxes are legal obligations with penalties attached. Keep QuickBooks Payroll or a dedicated provider – and see our payroll template alternatives for what a spreadsheet can and cannot do there.
- No sales tax filing or e-invoicing compliance. Jurisdictions increasingly mandate structured e-invoicing and digital filing. A spreadsheet cannot satisfy those requirements, and no template on this page claims to.
- Your accountant may simply refuse. If your bookkeeper works in QuickBooks and bills you for the time, moving the ledger out of it will cost more than the subscription saves. Ask them first.
- Multi-user concurrency and audit trail. Several people editing the same file all day, with role-based permissions and a change history, is what real software is for. A single sheet gets fragile past a handful of heavy editors.
The honest recommendation for most readers is not “cancel QuickBooks”. It is downgrade and supplement: keep the cheapest QuickBooks tier that covers your ledger, bank feeds and filing obligations – Simple Start at $38 for a single user, or Essentials at $85 for three – and move the reporting you were paying Plus or Advanced for into a file you own once. On the Plus-to-Simple-Start path that is $102 a month back, or $1,224 a year, against a one-time spend of $14.99 to $111.92. If you genuinely need inventory tracking, project profitability or 25 users, stay on the higher tier – it is doing something a spreadsheet cannot. For the budgeting half of what Plus adds, our budget templates in Excel and Google Sheets cover it for a one-time price.
Once the books are in order, the controller still has to close and report them. See our financial controller template stack for close calendars, audit trackers and KPI dashboards.
Frequently asked questions
What is the best QuickBooks alternative in Excel?
The Finance and Accounting KPI Dashboard in Excel ($14.99) is the best QuickBooks alternative in Excel for reporting. It covers twelve financial KPIs with MTD and YTD views against target and prior year in one file you buy once. It is not a general ledger, so pair it with a basic accounting subscription.
How much does QuickBooks Online cost in 2026?
As of the 1 August 2026 price change, QuickBooks Online lists at $38 a month for Simple Start, $85 for Essentials, $140 for Plus and $340 for Advanced. Essentials, Plus and Advanced rose from $60, $99 and $200. Always confirm current figures on Intuit’s official pricing page before budgeting.
Can a spreadsheet template really replace QuickBooks?
Not entirely, and we would not claim it can. A template replaces the reporting layer – KPIs, cash flow, receivables, profitability. It cannot do double-entry bookkeeping, bank feeds, payroll tax filing or e-invoicing compliance. Most teams downgrade to a cheaper QuickBooks tier and move reporting to a template rather than cancelling outright.
Is there a free QuickBooks alternative?
Google Sheets itself is free, so the Google Sheets dashboards here cost only the one-time file – $8.99 for receivables, $9.99 for cash flow. QuickBooks also offers a free Solopreneur tier and a $20 Lite plan for sole traders. For a real ledger with no subscription, look at open-source accounting software rather than a spreadsheet.
Why did QuickBooks raise its prices in August 2026?
Intuit repriced QuickBooks Online Essentials, Plus and Advanced with effect from 1 August 2026, citing added product capability. Plus rose 41% from $99 to $140 and Advanced 70% from $200 to $340. Simple Start, Ledger, Lite and Free were not included. Prepaid annual subscribers generally hold their rate until renewal.
Which QuickBooks alternative works in Google Sheets?
Two picks in this guide are native Google Sheets files: the Accounts Receivable KPI Dashboard ($8.99) and the Cash Flow KPI Dashboard ($9.99). Both run on a free Google account, share by link with per-person edit or view permissions, and need no Microsoft 365 licence or desktop install.
How do I move my QuickBooks data into a template?
Export the report you need from QuickBooks to CSV or XLSX – trial balance, AR ageing, or the P&L – then paste the figures into the template’s input sheet. The dashboards recalculate automatically. Budget about an hour for the first import and roughly five minutes a month afterwards.
Do these templates handle double-entry bookkeeping?
No. None of the eight templates has a chart of accounts, journals or a self-balancing trial balance. They are dashboards and trackers that report on figures you supply. If you need genuine double-entry accounting, keep QuickBooks or another ledger and use these for the reporting layer above it.
Are one-time templates cheaper than QuickBooks over a year?
For the reporting job, yes. QuickBooks Plus at $140 a month is $1,680 a year, every year. All eight templates in this guide together cost $111.92 once. Even keeping Simple Start at $38 for the ledger plus every template still lands well under a single year of Plus.
Which template should an accounting firm buy first?
The Accounting Firms KPI Dashboard in Excel ($14.99) if you want visibility of your own practice – realisation, utilisation, retention. The Outsourced Accounting KPI Dashboard ($14.99) if your problem is delivery across many client books. Firms managing both usually buy the pair for $29.98.
Get more accounting and finance templates
Leaving QuickBooks’ higher tiers does not mean losing the numbers – it means owning the reporting on a file that never renews. Start with the Finance and Accounting KPI Dashboard in Excel ($14.99) for the whole-company view, or the Accounts Receivable KPI Dashboard in Google Sheets ($8.99) for the fastest cash win. If you want the set, the Finance & Accounting Command Center bundle packages 8 premium finance templates across Excel, Power BI and Google Sheets for $64.99 – $37.93 less than buying them separately, and still under half of one month of QuickBooks Advanced.
Prefer to see a template in action before you buy? Watch build walk-throughs and dashboard tutorials on our YouTube channel: youtube.com/@NextGenTemplates.
Related: Cutting other subscriptions too? See our Salesforce alternatives – 8 CRM templates in Excel & Sheets and HubSpot alternatives – 8 CRM & marketing templates.
Related: Toast POS alternatives 2026: 6 restaurant analytics templates in Excel & Sheets.
For a wider view of buy-once versus recurring pricing across business tools, read our one-time purchase vs subscription software comparison.