

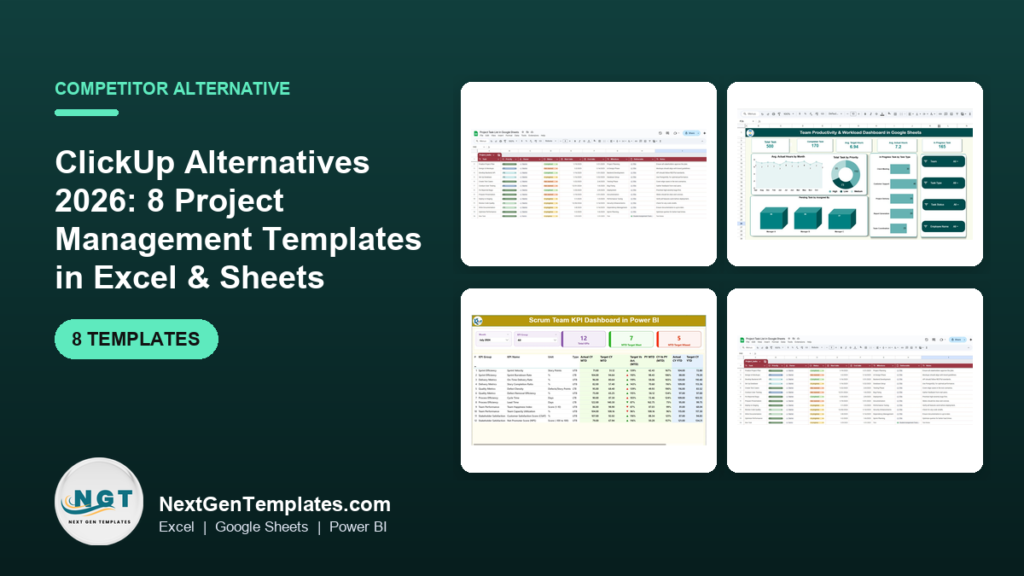
The best ClickUp alternatives for most small teams in 2026 are spreadsheet-based project management templates. A one-time $6.99–$14.99 Excel or Google Sheets template replaces ClickUp’s core task lists, workload views, sprints and timelines with no per-seat fee, no unused modules, and no admin overhead — you own the file forever.
Last updated: August 2026
Key takeaways
- ClickUp’s paid plans start at $7 per user per month (Unlimited, billed annually) and rise to $12 for Business — a 6-person team on Business pays roughly $864 a year, every year.
- The 8 templates below are one-time purchases from $6.99 to $14.99, with no recurring seat cost and no vendor lock-in.
- Project Task List in Google Sheets ($6.99) is the best overall one-to-one swap for ClickUp’s List and Board views.
- Small teams churn off ClickUp for three reasons: per-seat pricing, unused modules, and admin overhead — spreadsheets remove all three.
- ClickUp still wins when you need real-time multi-user editing at scale, native automations, or a mobile app — we say exactly when below.
 Launch offer
SUMIFS, XLOOKUP, FILTER, LAMBDA and checking AI-written formulas, with real business projects. 11h 47m of video by PK, with practice files, quizzes and a capstone.
ClickUp alternative templates compared
| Template | Format | Replaces in ClickUp | Best for | Price |
|---|---|---|---|---|
| Project Task List (Best overall) | Google Sheets | List / Board / Tasks | Day-to-day task tracking | $6.99 |
| Team Productivity & Workload Dashboard (Best value) | Google Sheets | Workload & Dashboards | Balancing team capacity | $6.99 |
| Scrum Team KPI Dashboard | Power BI | Sprints / Agile | Agile & scrum teams | $11.99 |
| Employee Productivity Tracking KPI Dashboard | Excel | Time tracking & reports | Output reporting | $14.99 |
| Project Management Employee Satisfaction KPI Dashboard | Excel | Goals / team pulse | Team health metrics | $14.99 |
| Construction & Real Estate Project Timeline KPI Dashboard | Excel | Gantt / Timeline | Construction projects | $14.99 |
| Education & Learning Project Timeline KPI Dashboard | Excel | Gantt / Timeline | Education programs | $14.99 |
| Time-to-Productivity KPI Dashboard | Power BI | Reporting / onboarding | Onboarding analytics | $11.99 |
Why small teams leave ClickUp
ClickUp’s published pricing looks friendly at a glance: a Free Forever plan, then Unlimited at $7 per user per month (billed annually, or $10 month-to-month), Business at $12 per user per month (or $19 monthly), and Enterprise on a custom quote. The sticker price is per seat, per month, forever — and that is where small teams start doing the math.
Three reasons show up again and again when teams churn:
- Seat cost compounds. A 6-person team on Business is about $72 a month, or $864 a year. Add three contractors and it climbs past $1,200. You never stop paying, and the price rises as you grow.
- Unused modules. ClickUp bundles Docs, Whiteboards, Goals, Chat, Mind Maps, time tracking and automations. Most small teams use two or three of these. You pay for the whole suite regardless.
- Admin overhead. Custom statuses, ClickApps, permission tiers and automation rules need an owner. For a five-person team, the person configuring ClickUp is often the same person trying to ship the work.
A spreadsheet template flips all three: one payment, only the views you need, and a layout any team member can read on day one. If you are comparing several tools, our Asana alternatives in Excel and Sheets and Monday.com alternatives guides run the same head-to-head for those tools.
Head-to-head: ClickUp feature vs the NGT template that covers it
| ClickUp feature | NGT template that covers it | Price |
|---|---|---|
| List & Board task views | Project Task List in Google Sheets | $6.99 |
| Workload view & Dashboards | Team Productivity & Workload Dashboard | $6.99 |
| Sprints & Agile reporting | Scrum Team KPI Dashboard in Power BI | $11.99 |
| Time tracking & productivity reports | Employee Productivity Tracking KPI Dashboard | $14.99 |
| Goals & team pulse | Project Management Employee Satisfaction KPI Dashboard | $14.99 |
| Gantt & Timeline view | Construction / Education Project Timeline KPI Dashboards | $14.99 |
| Onboarding & ramp reporting | Time-to-Productivity KPI Dashboard in Power BI | $11.99 |
How we picked these
We searched the full NextGenTemplates catalog of 900+ Excel, Google Sheets and Power BI templates and mapped each one against the features small teams actually use in ClickUp: task lists, workload balancing, sprints, timelines, and reporting. We kept only paid, self-contained templates that a non-technical user can open and run the same day, and we excluded anything that needs a subscription, an add-on, or code. Every price below is the real one-time store price in USD, verified at publication.
The 8 best ClickUp alternative templates for 2026
1. Project Task List in Google Sheets — best overall

What it is: a ready-to-use task tracker that mirrors ClickUp’s List and Board views inside Google Sheets — tasks, owners, priorities, statuses and due dates in one clean grid. Why it is #1: it is the closest one-to-one replacement for the part of ClickUp that small teams live in every day, at the lowest price on this list.
Who it is for: any team of 2–15 that mainly uses ClickUp for a shared to-do list and does not need the rest of the suite.
- Priority, status and progress columns with color-coded flags
- Filter and sort by assignee, due date or project phase
- Built-in summary counts so you see open vs done at a glance
- Shareable with the whole team via a single Google Sheets link
Use it to run a weekly sprint of 40–60 tasks, hand a freelancer a filtered view of only their 8 items, or track a product launch across three phases without paying for a seat each. Best for: teams that want ClickUp’s core task list without the monthly bill. $6.99 — get the Project Task List in Google Sheets.
2. Team Productivity & Workload Dashboard in Google Sheets — best value
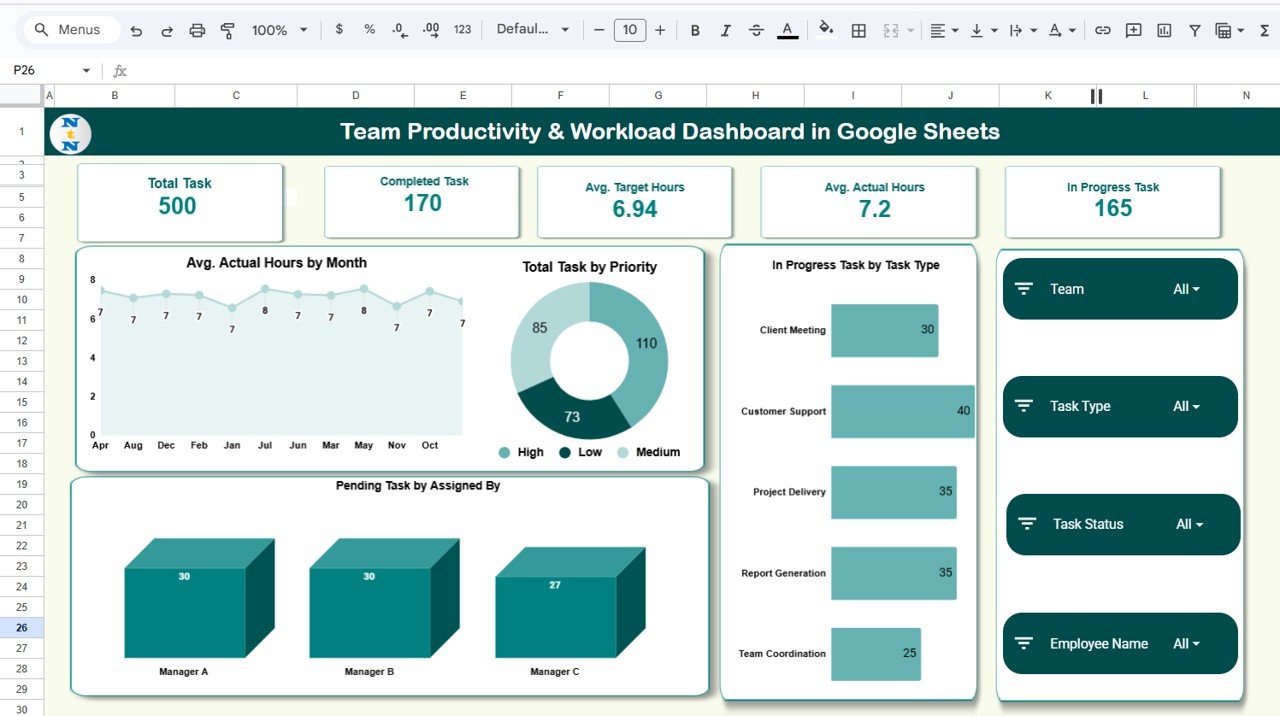
What it is: a workload and productivity dashboard that replaces ClickUp’s Workload view and paid Dashboards — it shows who is over capacity, task counts by person, and completion trends. Who it is for: team leads who need to balance work across people without upgrading to ClickUp’s Business tier just to unlock dashboards.
- Tasks-per-person and workload-by-status visuals
- Average actual hours by month and completion rate KPIs
- Pending-tasks-by-assignee breakdown to spot bottlenecks
- Fully editable in Google Sheets — no scripting required
Use it to rebalance a five-person team when one person is carrying 22 open tasks and another has 6, to report weekly throughput to a client, or to prove capacity before agreeing to a new project. At $6.99 it delivers the reporting layer ClickUp gates behind a $12/user plan. Best for: the best cost-to-value ratio on this list. $6.99 — get the Team Productivity & Workload Dashboard.
3. Scrum Team KPI Dashboard in Power BI
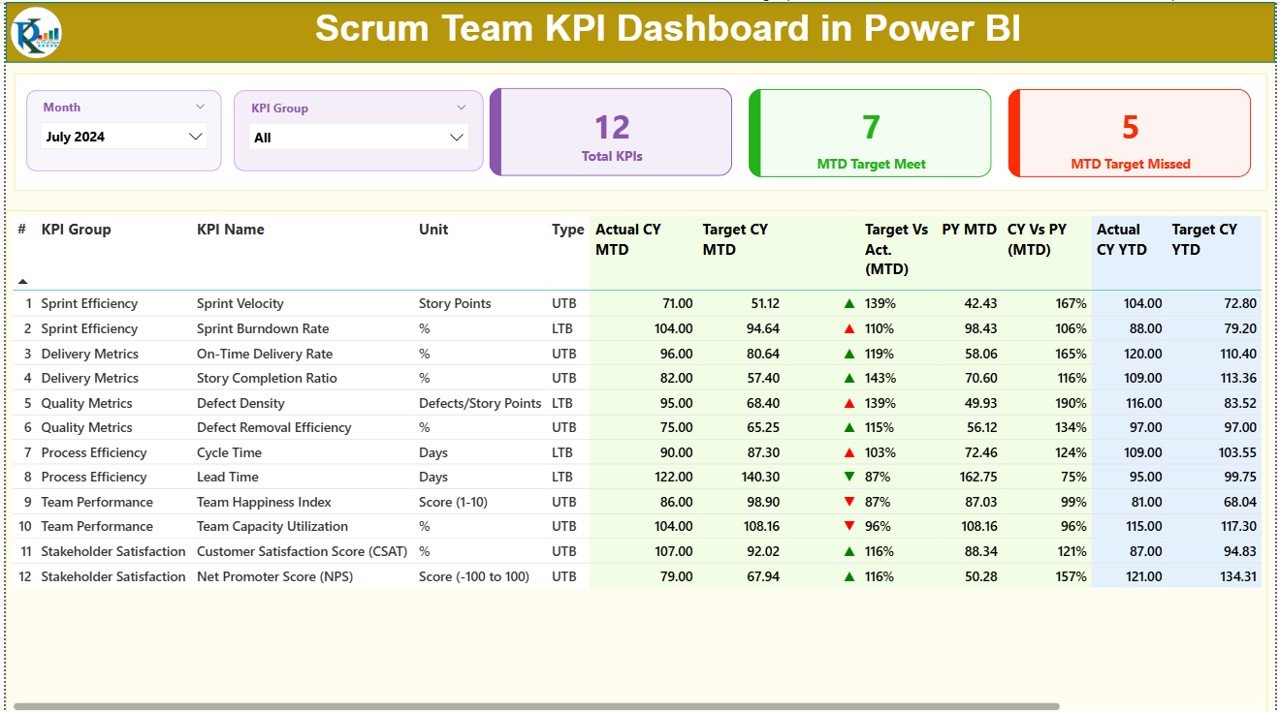
What it is: an agile reporting dashboard that covers what ClickUp’s Sprints and burndown widgets do — velocity, sprint burndown, cycle time and defect metrics — in Power BI. Who it is for: scrum and agile teams who want sprint analytics without the ClickUp Sprints ClickApp and its Business-plan gating.
- Sprint velocity, burndown and burnup tracking
- Cycle time, lead time and throughput KPIs
- Quality metrics: defect density and escaped defects
- WTD, MTD and YTD views with target-vs-actual deltas
Use it to run a two-week sprint retro backed by real velocity numbers, show a stakeholder why cycle time doubled, or track a squad against a target of 40 story points. Best for: agile teams that report on sprints. $11.99 — get the Scrum Team KPI Dashboard in Power BI.
4. Employee Productivity Tracking KPI Dashboard in Excel

What it is: an Excel dashboard that replaces ClickUp’s time tracking and productivity reporting with hours, output and efficiency KPIs by employee. Who it is for: managers who use ClickUp mainly to see who did what and how long it took.
- Productivity, utilization and efficiency KPIs per person
- Hours logged vs output delivered comparisons
- Trend charts across months to catch drops early
- Works fully offline in Excel — no cloud account needed
Use it for a monthly one-on-one backed by data, to justify a new hire when utilization sits above 90%, or to spot the difference between busy and productive across a 10-person team. Best for: output and efficiency reporting. $14.99 — get the Employee Productivity Tracking KPI Dashboard.
5. Project Management Employee Satisfaction KPI Dashboard in Excel
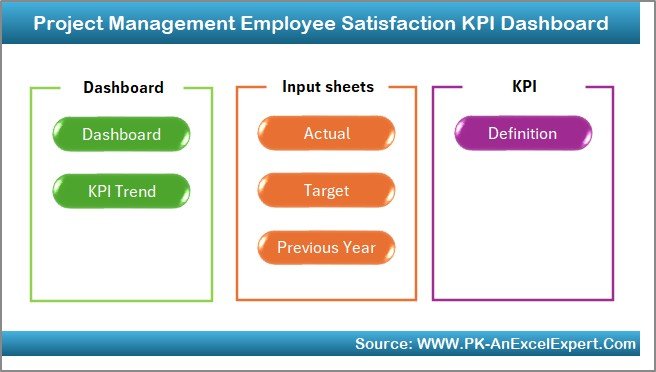
What it is: a team-health and satisfaction dashboard that covers the intent behind ClickUp’s Goals and team-pulse features — satisfaction scores, engagement and project health in Excel. Who it is for: project leads who want to track morale and goal progress alongside delivery, not just task counts.
- Employee satisfaction and engagement KPIs by project
- Goal-progress and project-health indicators
- Segment scores by team, role or project phase
- Ready-to-present charts for leadership reviews
Use it to run a quarterly pulse across three project teams, catch a satisfaction dip before it becomes attrition, or tie goal completion to how the team actually feels about the work. Best for: teams that measure health, not just output. $14.99 — get the Employee Satisfaction KPI Dashboard.
6. Construction & Real Estate Project Timeline KPI Dashboard in Excel
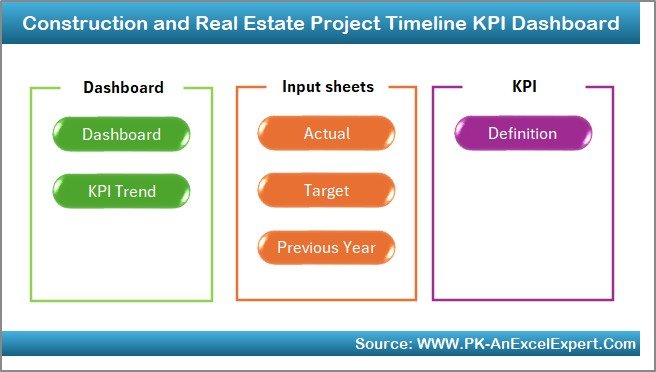
What it is: a project timeline and milestone dashboard that replaces ClickUp’s Gantt and Timeline views for construction and property projects. Who it is for: builders, contractors and real-estate PMs who need phase-by-phase schedules and budget tracking without a full PM subscription.
- Phase and milestone timeline with planned vs actual dates
- Budget, cost and schedule-variance KPIs
- Percent-complete tracking by work package
- Purpose-built columns for construction workflows
Use it to schedule a 9-month build across foundation, framing and finishing, flag a phase that has slipped two weeks, or show an owner the budget burn against the plan. Best for: construction and property timelines. $14.99 — get the Construction Project Timeline Dashboard.
7. Education & Learning Project Timeline KPI Dashboard in Excel
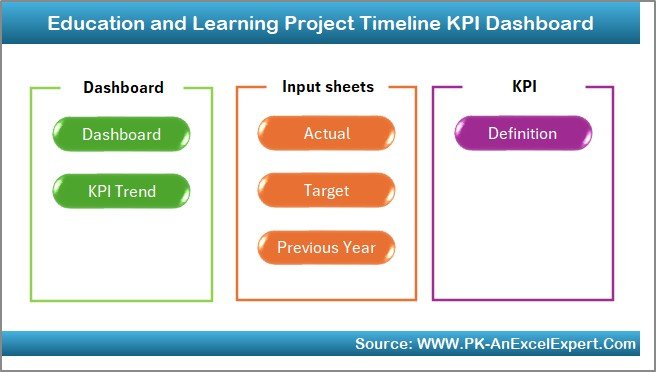
What it is: a timeline dashboard tuned for education and training programs — the same Gantt-style scheduling ClickUp offers, built for course rollouts and curriculum projects in Excel. Who it is for: schools, training teams and course creators managing multi-week programs.
- Program and module timeline with milestone tracking
- Completion and progress KPIs by cohort or course
- Planned vs actual scheduling for each phase
- Clean layout for stakeholder and board reporting
Use it to plan a 12-week curriculum launch, track three cohorts moving through the same program, or report completion rates to a training sponsor. Best for: education and training program timelines. $14.99 — get the Education Project Timeline Dashboard.
8. Time-to-Productivity KPI Dashboard in Power BI
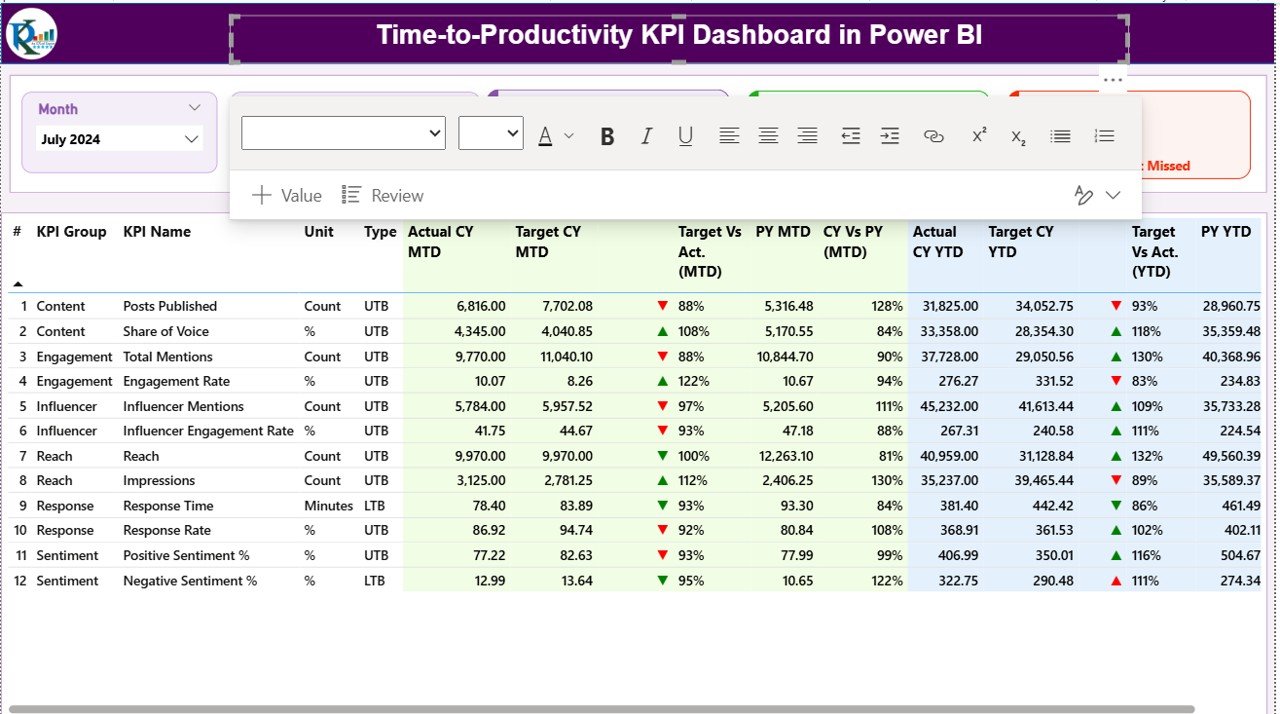
What it is: an onboarding and ramp-analytics dashboard that covers reporting ClickUp reserves for higher tiers — how fast new hires reach full productivity, in Power BI. Who it is for: people-ops and team leads who want to measure onboarding speed rather than manage it in a task tool.
- Time-to-productivity and ramp-curve KPIs by hire
- Cohort comparisons across departments or start dates
- Milestone-to-productivity tracking
- Interactive Power BI slicers for role and team
Use it to prove a new onboarding process cut ramp time from 90 to 60 days, compare two hiring cohorts, or show leadership the cost of slow onboarding. Best for: onboarding and ramp analytics. $11.99 — get the Time-to-Productivity KPI Dashboard.
How to choose between them
Match the template to the ClickUp view your team actually opens:
- You mostly track tasks → Project Task List in Google Sheets ($6.99).
- You need to balance who does what → Team Productivity & Workload Dashboard ($6.99).
- You run sprints → Scrum Team KPI Dashboard in Power BI ($11.99).
- You schedule by phases and milestones → a Project Timeline KPI Dashboard ($14.99).
- You report on output, satisfaction or onboarding → the matching KPI dashboard above.
Most small teams start with the Project Task List and add one dashboard when reporting becomes the pain point — total spend still under $22 for both, versus ClickUp’s recurring per-seat bill. For adjacent tools, compare our task and to-do management templates and Pipedrive alternatives in Excel and Sheets.
When ClickUp is still the right call
Spreadsheets are not a universal replacement, and pretending otherwise leads to buyer’s remorse. Stay on ClickUp — or another SaaS PM tool — when any of these is true:
- You need real-time multi-user editing at scale. Google Sheets handles a handful of concurrent editors well; 30 people hammering the same file at once is where a purpose-built database wins.
- You rely on native automations. ClickUp’s rule-based automations, recurring tasks and integrations with Slack, GitHub and email are not something a static template reproduces.
- Your team lives on mobile. ClickUp’s mobile app is built for on-the-go updates; a spreadsheet on a phone is workable but not delightful.
- You need granular permissions and audit trails. Enterprise governance — guest roles, per-field permissions, activity logs — is a genuine reason to pay for software.
If two or more of these describe your team, keep the subscription. If none do, a $6.99–$14.99 template almost always wins on cost and simplicity. For a broader view of SaaS-to-spreadsheet switching, see our Salesforce alternatives and HubSpot alternatives guides.
Get more project management templates
Replace ClickUp’s core with the Project Task List in Google Sheets for $6.99, or pair it with the Team Productivity & Workload Dashboard for a complete task-plus-reporting setup under $14 total — one-time, no seats, yours to keep. Browse the full range on NextGenTemplates and see them in action on our YouTube channel.
Frequently asked questions
What is the best ClickUp alternative for a small team?
For most small teams the best ClickUp alternative is the Project Task List in Google Sheets at $6.99. It mirrors ClickUp’s List and Board views for day-to-day task tracking with no per-seat fee, no unused modules, and a layout any team member can read on day one.
How much does ClickUp cost in 2026?
ClickUp’s published pricing is Free Forever at $0, Unlimited at $7 per user per month billed annually ($10 monthly), Business at $12 per user per month billed annually ($19 monthly), and Enterprise on a custom quote. A 6-person team on Business pays roughly $864 a year.
Can a spreadsheet really replace ClickUp?
For task lists, workload balancing, timelines and reporting, yes. A spreadsheet template covers the ClickUp views most small teams actually use. It cannot replace native automations, large-scale real-time editing, or a polished mobile app, so match the tool to how your team really works.
Is a one-time template cheaper than ClickUp?
Almost always. These templates cost $6.99 to $14.99 once, versus ClickUp’s recurring per-seat charge. A 6-person team on ClickUp Business spends about $864 every year, while a task list plus a dashboard is under $22 total and never renews.
Do these templates work in Excel and Google Sheets?
Yes. The lineup spans Google Sheets (Project Task List, Workload Dashboard), Excel (productivity, satisfaction and timeline dashboards) and Power BI (Scrum and Time-to-Productivity). Pick the format your team already uses so there is zero learning curve and no new software to install.
Which ClickUp alternative is best for agile and scrum teams?
The Scrum Team KPI Dashboard in Power BI at $11.99 is the closest match for ClickUp Sprints. It tracks velocity, sprint burndown, cycle time and defect metrics with target-vs-actual deltas, giving agile teams sprint analytics without ClickUp’s Sprints ClickApp or Business-plan gating.
What replaces ClickUp’s Gantt and Timeline view?
The Construction & Real Estate and Education & Learning Project Timeline KPI Dashboards in Excel, both $14.99, replace ClickUp’s Gantt and Timeline views. They give you phase-by-phase schedules, planned-vs-actual dates and milestone tracking tuned to a specific industry workflow.
Will I lose my data if I stop paying for ClickUp?
With ClickUp, access ends when your subscription lapses, so you must export first. A one-time template lives as a file you own permanently — there is no renewal, no lock-in, and no risk of losing access because a payment failed. That ownership is a key reason teams switch.
Do I need technical skills to use these templates?
No. Every template opens and runs the same day in Excel, Google Sheets or Power BI with no code, no add-ons and no setup wizard. You enter your tasks or data into ready-made columns, and the KPIs, charts and summaries update automatically.
Can I share these templates with my whole team?
Yes. The Google Sheets templates share via a single link with view or edit access, and the Excel and Power BI files can sit in a shared drive or SharePoint. There is no per-user charge, so adding a teammate never increases your cost the way a ClickUp seat does.
Last updated: August 2026 by the NextGenTemplates team.
Once you have chosen a tool, track the right metrics: our breakdown of the 12 project management KPIs (CPI, SPI, EVM) covers each formula and a realistic benchmark range for 2026.