
ESG Investment Firms Dashboard in Excel helps ESG fund managers, investment analysts, portfolio operations teams, and sustainability reporting leads review AUM, capital deployed, management fees, net fee income, ESG score, compliance rate, engagements, portfolio companies, regions, themes, asset classes, fund types, and analyst performance in one editable Excel workbook. For $17.99 one-time, you get multiple dashboard pages, KPI cards, slicers, a structured Data Sheet, and a Support Sheet with pivot tables that refresh the entire workbook. Update the data, click Data > Refresh All, and the charts refresh without a recurring reporting platform.
Key Features of ESG Investment Firms Dashboard in Excel
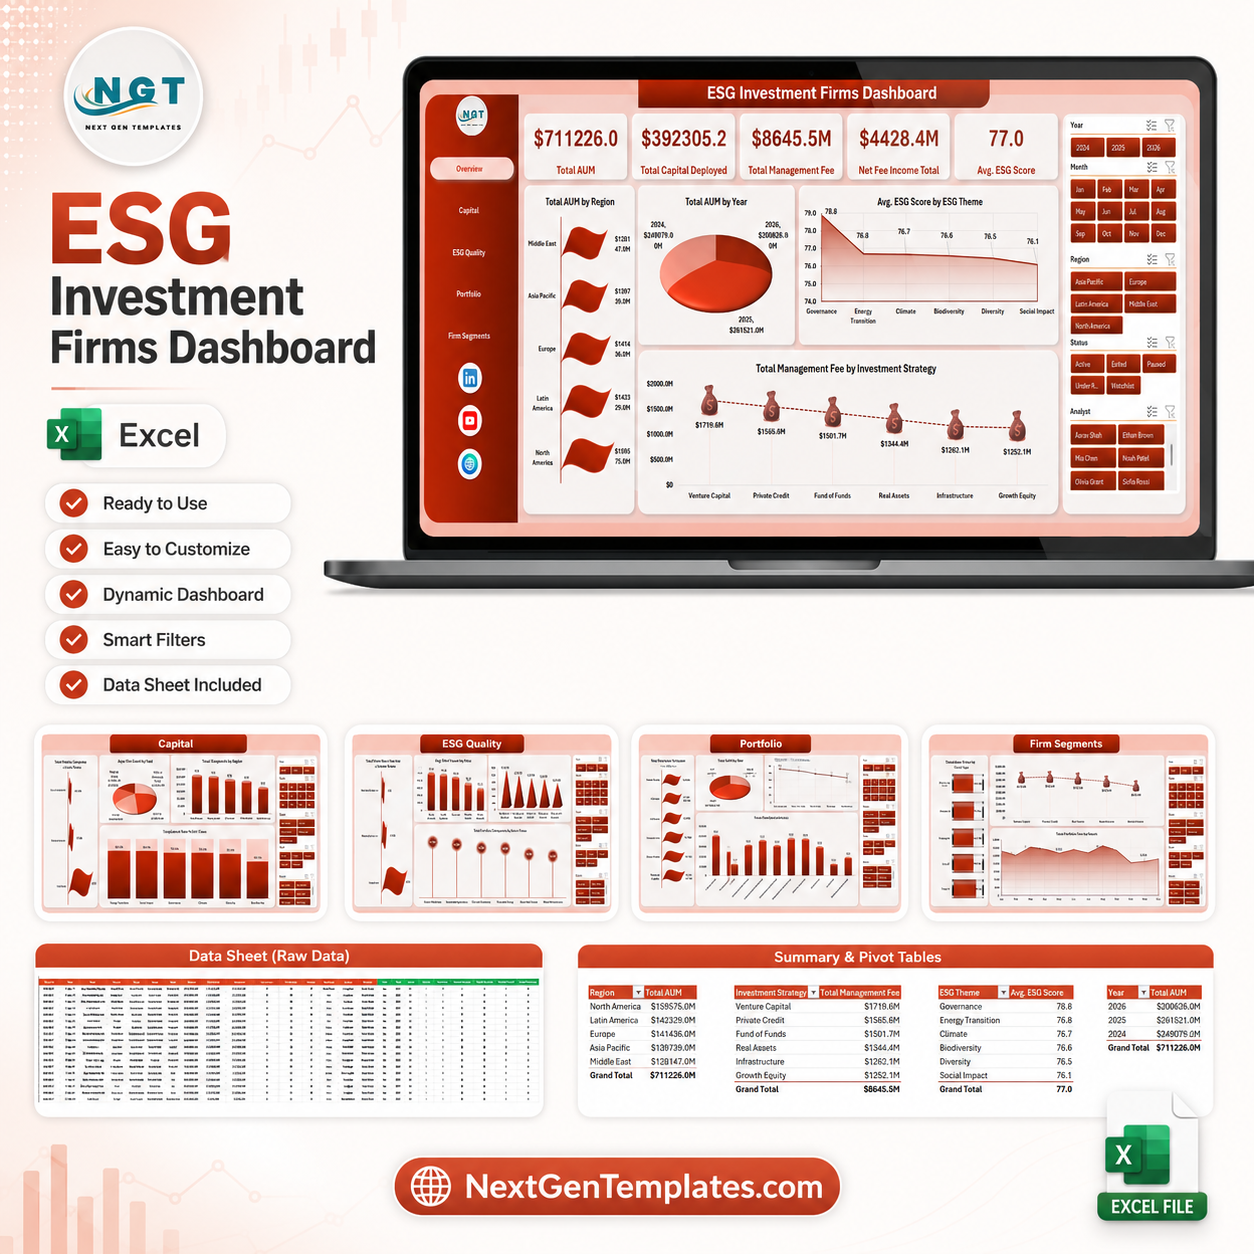
- 5 dashboard pages covering Overview, Capital, ESG Quality, Portfolio, and Firm Segments.
- 5 executive KPI cards for Total AUM, Total Capital Deployed, Total Management Fee, Net Fee Income Total, and Avg. ESG Score.
- ESG and investment analysis by region, year, ESG theme, investment strategy, asset class, fund type, analyst, quarter, and month.
- Compliance visibility with compliance rate and compliance status views for faster review cycles.
- Interactive slicers let users filter the workbook quickly and review focused segments.
- Pivot-powered refresh through a Support Sheet that can be hidden after setup.
What’s Inside the ESG Investment Firms Dashboard in Excel
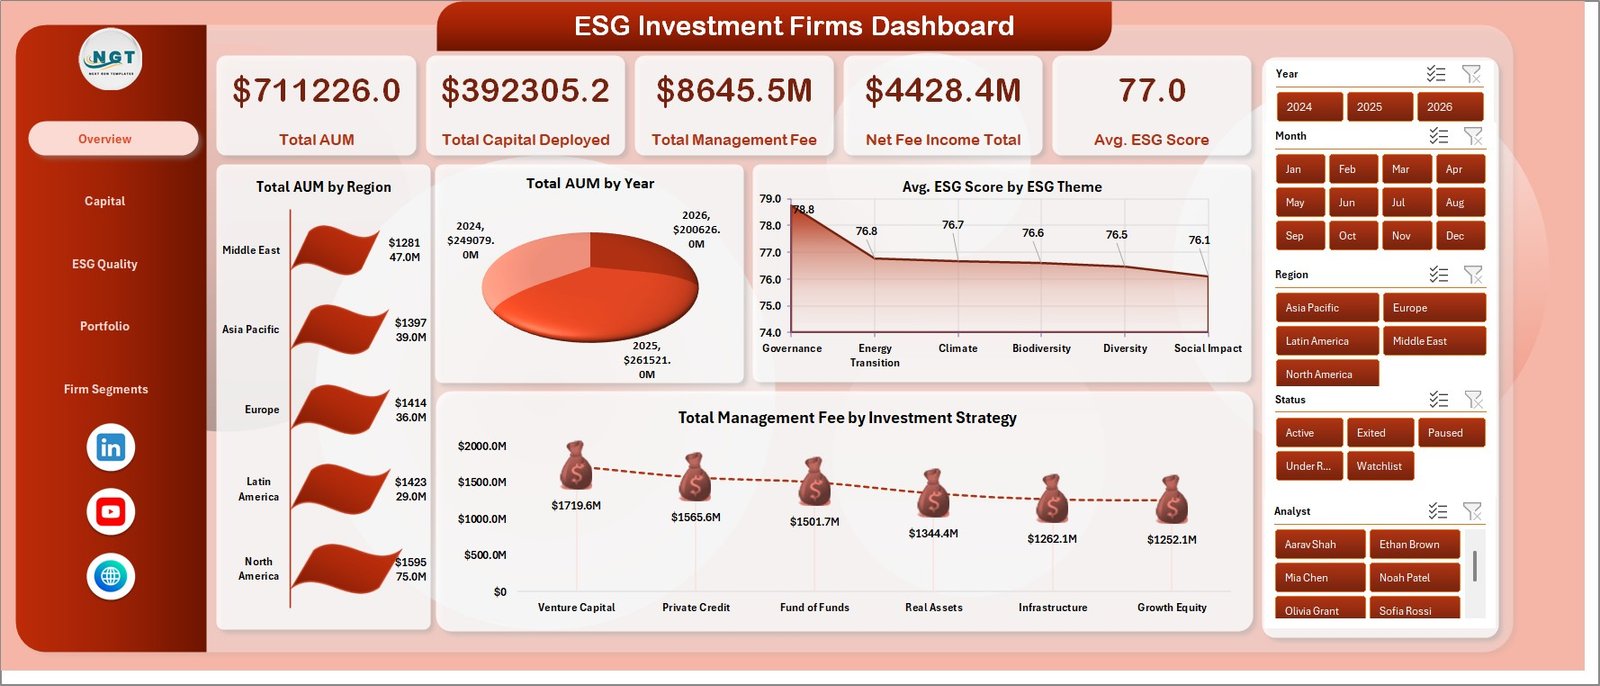
1. Overview Page
The Overview Page gives a high-level summary of investment firm performance. KPI cards show Total AUM, Total Capital Deployed, Total Management Fee, Net Fee Income Total, and Avg. ESG Score, so decision-makers can understand financial scale and ESG quality before reviewing deeper pages.
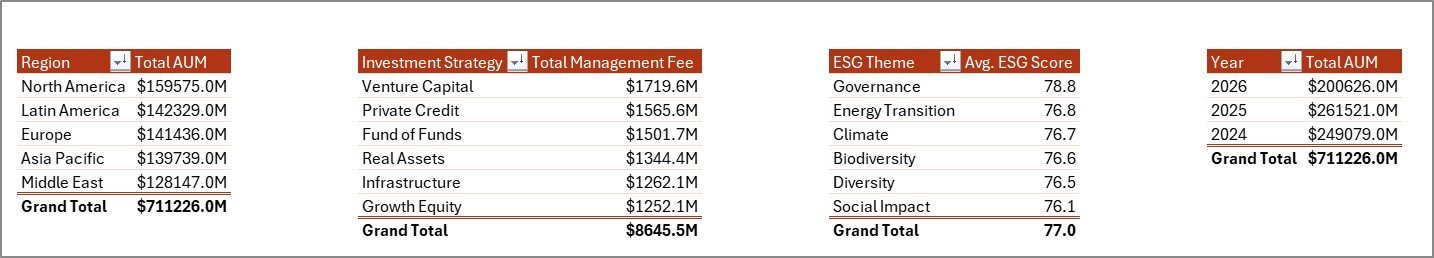
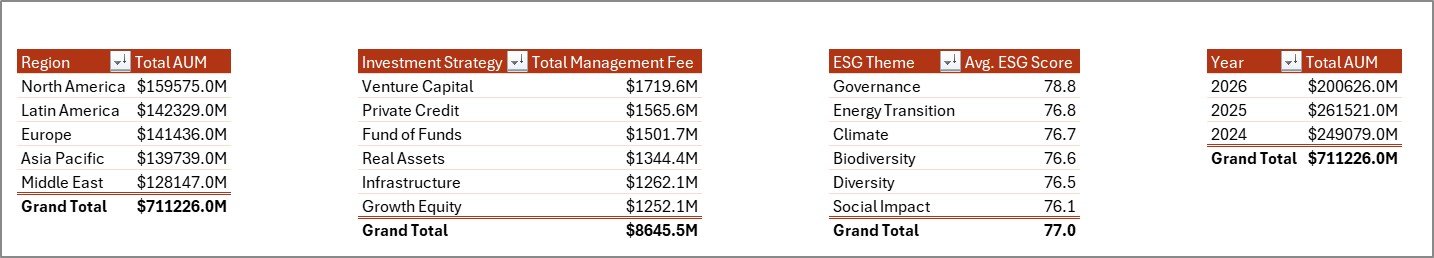
Total AUM by Region: Compares assets under management across regions and shows where portfolio exposure is concentrated.
Total AUM by Year: Shows year-wise AUM movement for growth review, investor updates, and long-term planning.
Avg. ESG Score by ESG Theme: Compares ESG score across themes so teams can see strengths and review areas.
Total Management Fee by Investment Strategy: Shows which strategies generate stronger management fee income.
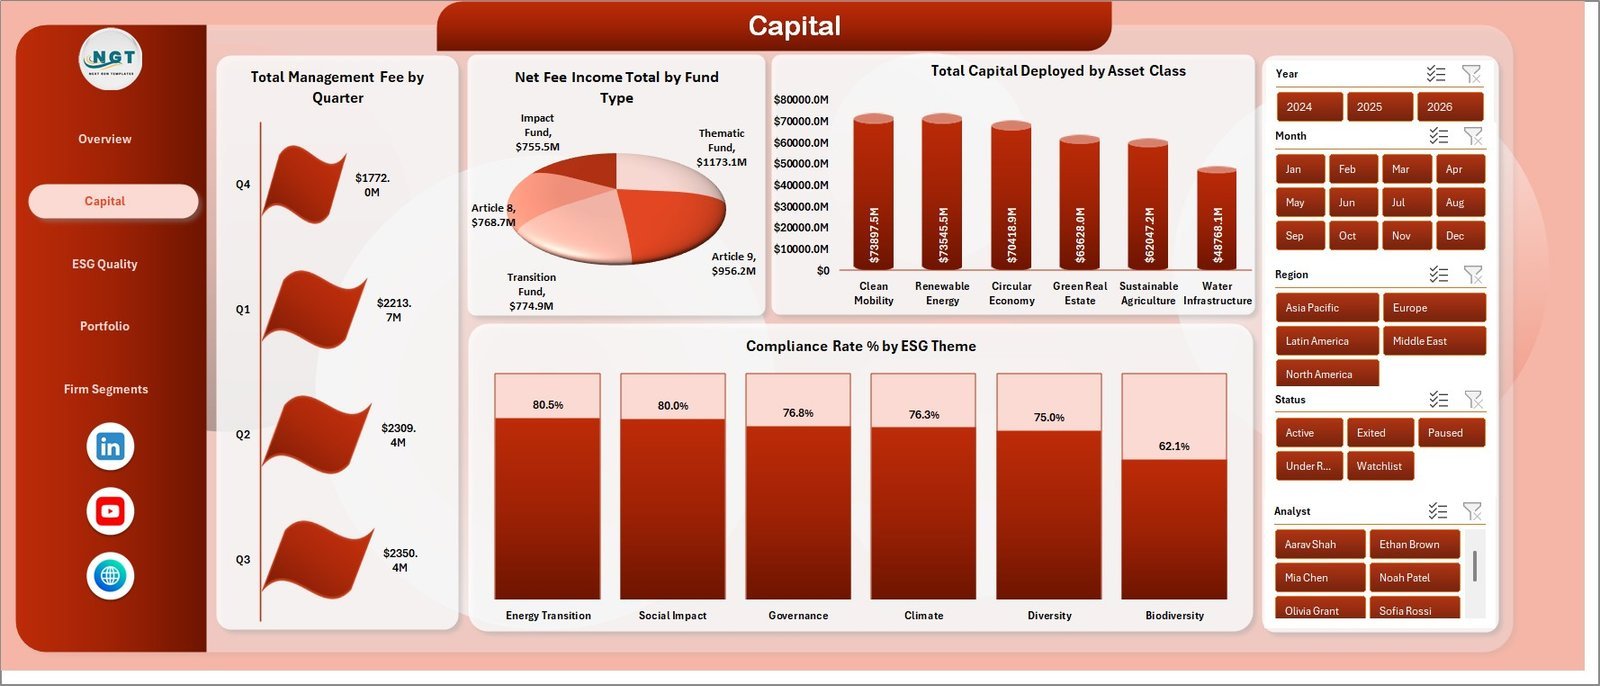
2. Capital
The Capital sheet focuses on fee, fund type, asset class, and ESG compliance analysis. It includes Total Management Fee by Quarter, Net Fee Income Total by Fund Type, Total Capital Deployed by Asset Class, and Compliance Rate % by ESG Theme.
Use this page to review capital allocation, income quality, quarterly fee movement, and compliance performance across ESG themes.

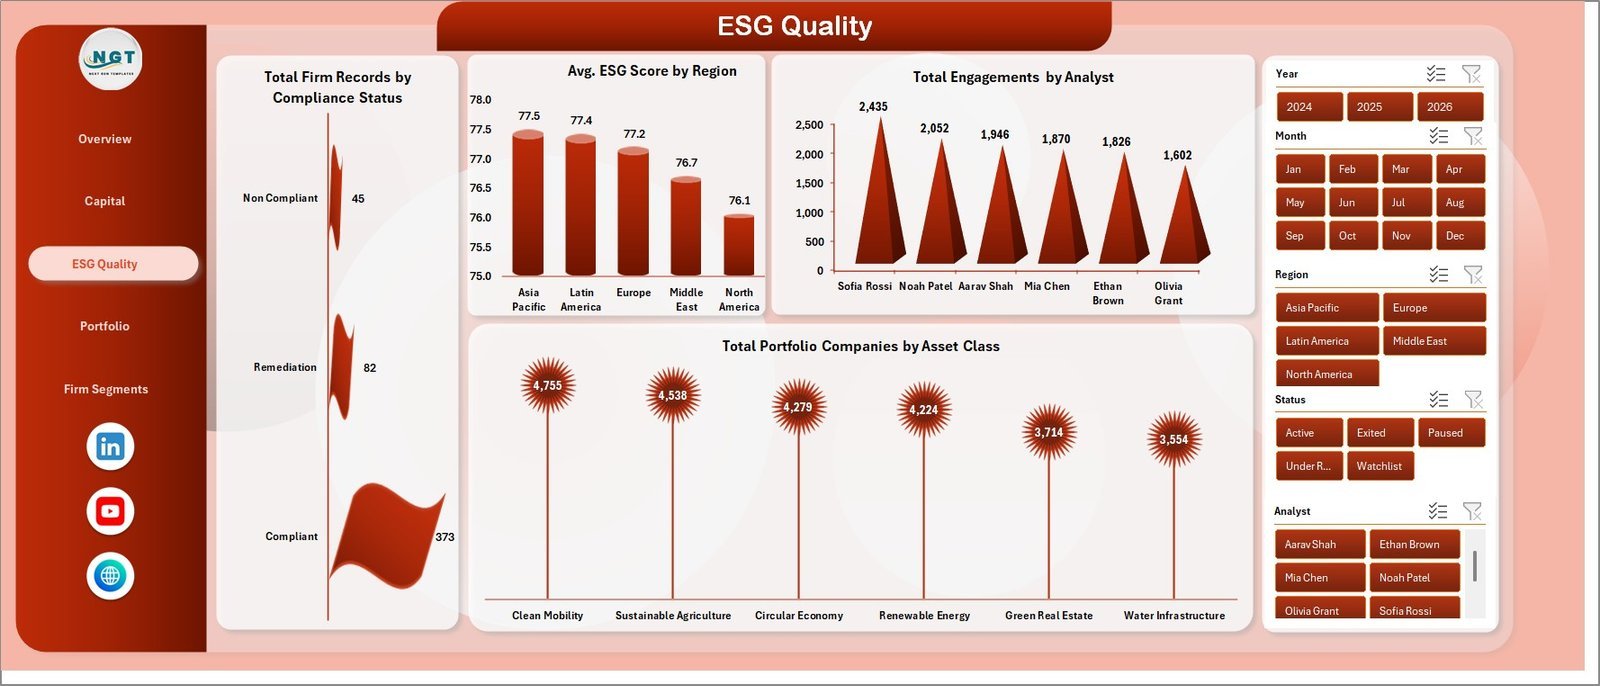
3. ESG Quality
The ESG Quality sheet reviews compliance status, regional ESG score, analyst engagements, and portfolio company distribution. It includes Total Firm Records by Compliance Status, Avg. ESG Score by Region, Total Engagements by Analyst, and Total Portfolio Companies by Asset Class.
This page is useful for quality review meetings, analyst workload discussions, and ESG governance reporting.

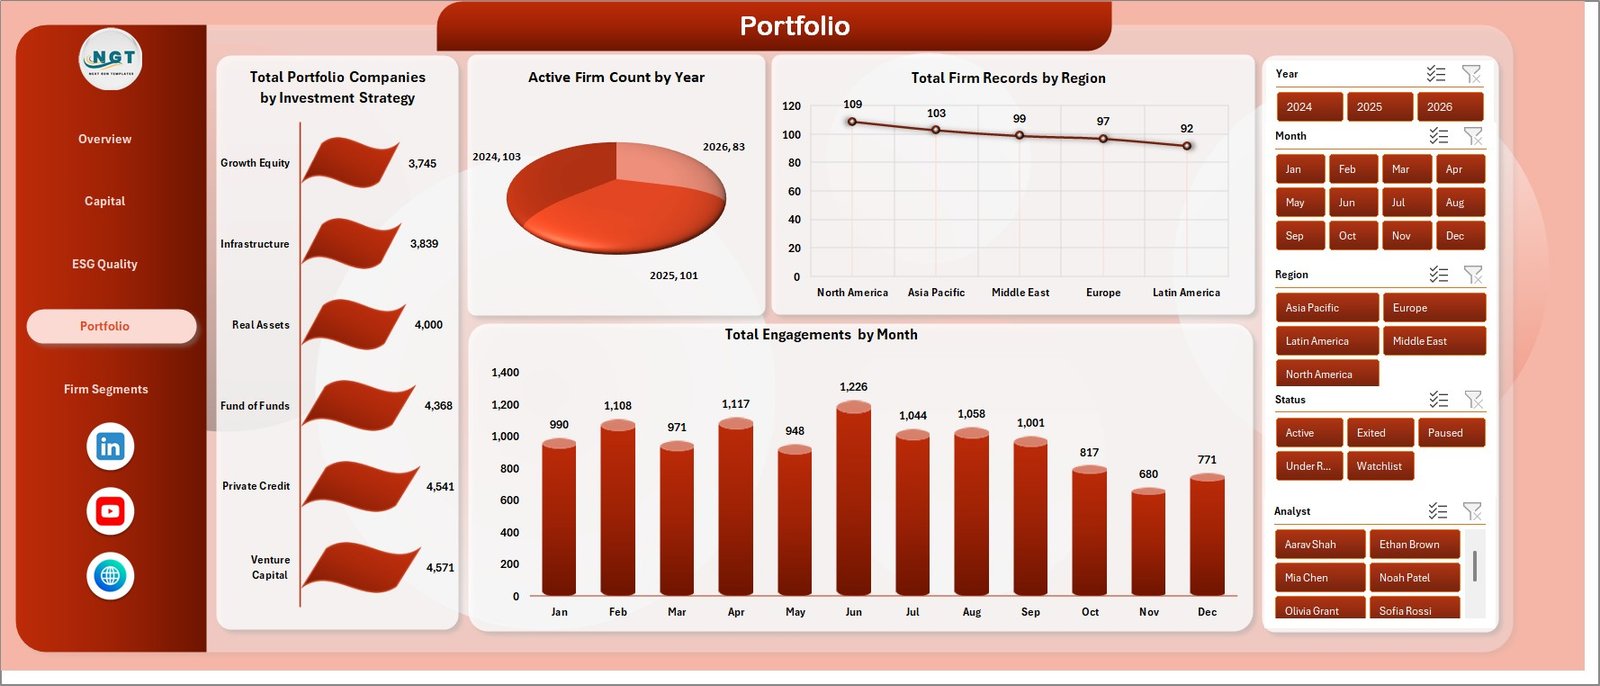
4. Portfolio
The Portfolio sheet covers company count, active firm count, regional records, and monthly engagement movement. It includes Total Portfolio Companies by Investment Strategy, Active Firm Count by Year, Total Firm Records by Region, and Total Engagements by Month.
Use this sheet to understand portfolio spread, yearly activity, geographic exposure, and engagement trends.
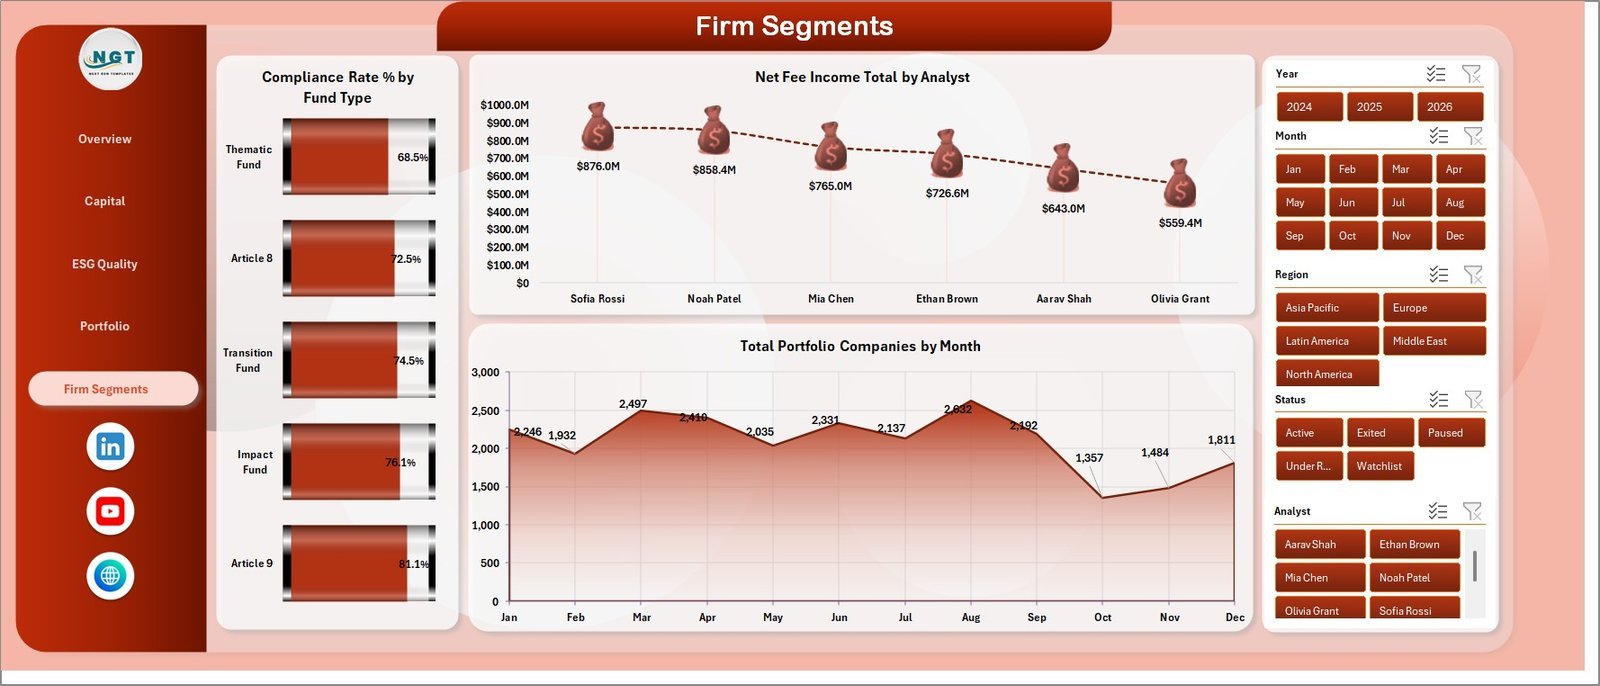
5. Firm Segments
The Firm Segments sheet highlights performance by fund type, analyst, and month. It includes Compliance Rate % by Fund Type, Net Fee Income Total by Analyst, and Total Portfolio Companies by Month.
This page helps teams compare fund segment compliance, analyst-level fee income, and portfolio company growth over time.

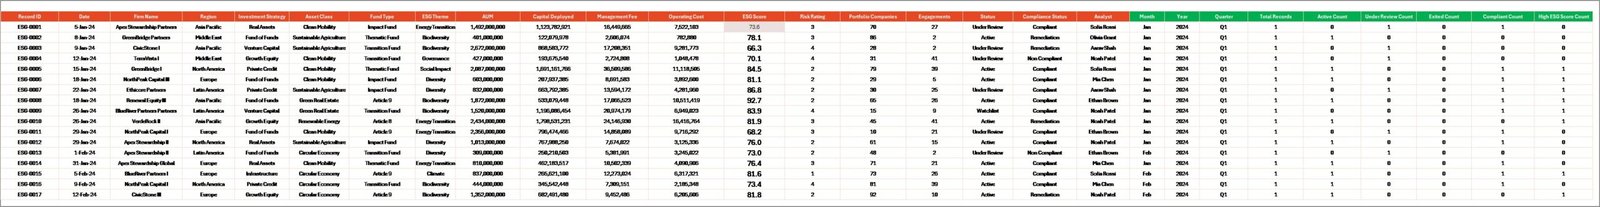
6. Data Sheet Tab
The Data Sheet is where you add or replace ESG investment firm records in the same format as the sample data. Keep the column structure consistent so pivots, slicers, KPI cards, and charts continue to refresh correctly.
7. Support Sheet
The Support Sheet contains the pivot tables used to create the dashboard dynamically. After updating the Data Sheet, go to the Data tab in the Excel Ribbon and click Refresh All. You can keep this sheet hidden during normal use.
ESG Investment Firms Dashboard in Excel vs. Google Sheets vs. Paid CRM/SaaS – Where This Fits
| Feature | This Excel Dashboard | Google Sheets Alternative | Paid ESG/Portfolio SaaS |
|---|---|---|---|
| Cost | $17.99 one-time | Template cost or manual build | Monthly or annual subscription |
| Platform | Microsoft Excel | Browser spreadsheet | Vendor cloud platform |
| Setup time | Replace data and Refresh All | Build formulas and charts | Implementation and onboarding |
| Customizable fields | Editable workbook, pivots, charts, and slicers | Editable, but formula maintenance required | Limited by vendor settings |
| Investment metrics | AUM, capital deployed, fees, ESG score, compliance, engagements | Must be built manually | Depends on plan and configuration |
| Year-1 cost at 5 users | $17.99 plus existing Excel access | Low tool cost plus build time | Often hundreds or thousands |
Who This Template Is For – and Who It’s Not For
This template is for ESG investment firms, fund managers, portfolio analysts, sustainability analysts, asset management teams, impact investment consultants, and finance teams that need a practical Excel view of AUM, capital deployed, fees, ESG score, compliance, fund type, asset class, strategy, analyst, region, and portfolio companies. It is not a live fund accounting system, investor portal, automated regulatory filing tool, ESG rating engine, CRM, or data warehouse.
How to Use the ESG Investment Firms Dashboard in Excel
- Download and unzip the Excel file.
- Open the workbook in Microsoft Excel.
- Go to the Data Sheet and replace the sample records with your own ESG investment firm data.
- Keep the same headers and field structure.
- Click Data > Refresh All in the Excel Ribbon.
- Use slicers to filter the dashboard by the available dimensions.
Real-World Use Cases
Priya, ESG portfolio analyst: Priya uses the Overview and ESG Quality pages before committee meetings to compare AUM, ESG score, compliance status, analyst engagements, and regional quality.
Marcus, investment operations manager: Marcus reviews Capital and Portfolio pages to explain capital deployed, management fee, asset class exposure, and monthly engagement trends.
Elena, impact investment consultant: Elena uses Firm Segments to compare fund types, analyst performance, and portfolio company movement across client workbooks.
Frequently Asked Questions
What does this dashboard track?
It tracks AUM, capital deployed, management fee, net fee income, ESG score, compliance rate, compliance status, engagements, portfolio companies, region, year, ESG theme, strategy, fund type, analyst, asset class, quarter, and month.
Do I need macros?
No. The workbook is built with Excel tables, pivot tables, slicers, and charts.
How do I refresh the dashboard?
Update the Data Sheet, then click Data > Refresh All. The Support Sheet pivot tables and dashboard charts refresh together.
Can I customize it?
Yes. You can edit fields, charts, colors, slicers, sheet names, and pivot layouts in Excel. Keep a backup before changing source fields.
Is this a replacement for ESG software?
No. It is an Excel analytics template for prepared data, not an automated ESG scoring, audit, filing, or investor reporting platform.
Can I use it for impact investing?
Yes. It is useful for ESG, sustainable finance, responsible investment, and impact investing teams that track structured portfolio data.
About the Author
Built by PK – Microsoft Certified Professional with 15+ years of Excel, Google Sheets, and Power BI experience. Founder of NextGenTemplates, reaching 300K+ subscribers across YouTube channels. Every template is hand-built and tested before release.
Explore Related Templates
You may also like ERP SaaS Startups Dashboard in Excel, ERP SaaS Startups Dashboard in Power BI, and Sovereign Wealth Funds KPI Dashboard in Excel. Browse more Excel Dashboard templates and financial Excel templates.
Read the detailed blog post for ESG Investment Firms Dashboard in Excel.
Download the ESG Investment Firms Dashboard in Excel today and turn ESG investment, compliance, fee, AUM, and portfolio company data into clear Excel reporting.
Last updated: June 9, 2026.


Reviews
There are no reviews yet.