
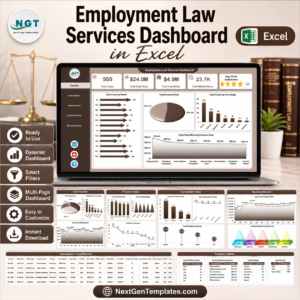
Employment Law Services Dashboard in Excel helps law firms, employment attorneys, HR legal advisors, and compliance consultants track cases, fees, billable hours, practice areas, outcomes, realization rate, and client satisfaction in one ready-to-edit workbook. Legal service teams often manage hundreds of active matters across stages, regions, priorities, and client types; this dashboard brings those records into 7 Excel sheet tabs, including 5 visual dashboard pages plus Data and Support sheets. Instant download. One-time payment. Editable Excel file. No monthly legal analytics software subscription.
Key Features of Employment Law Services Dashboard in Excel
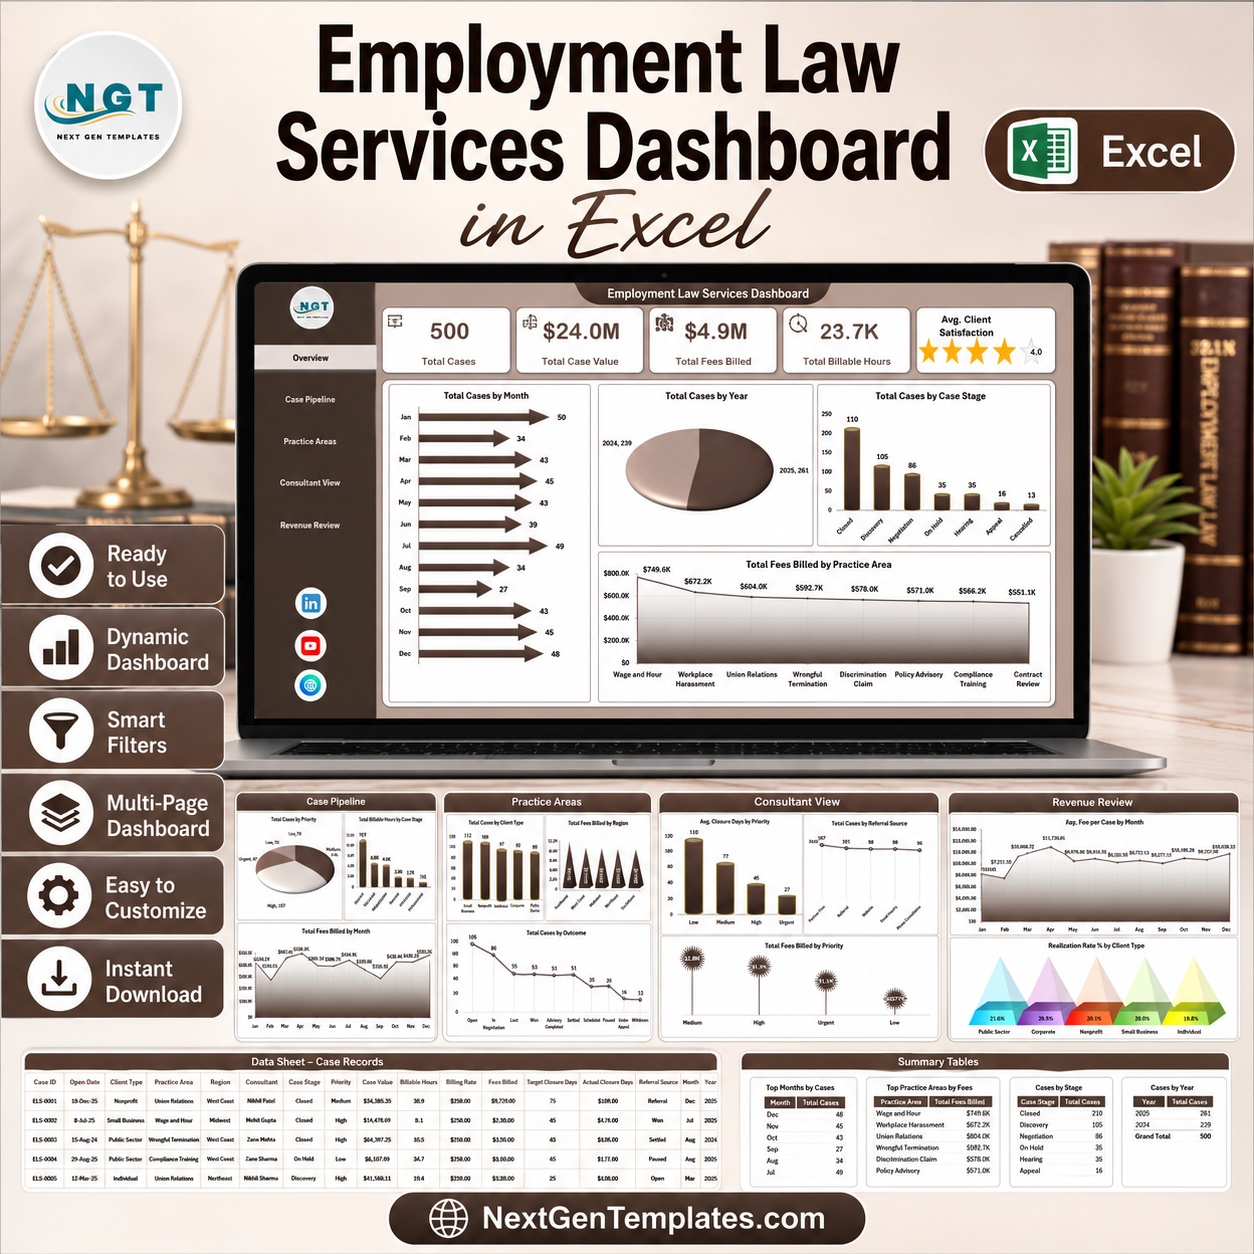
- 5 interactive dashboard pages for Overview, Case Pipeline, Practice Areas, Consultant View, and Revenue Review.
- 5 headline KPI cards showing Total Cases, Total Case Value, Total Fees Billed, Total Billable Hours, and Avg. Client Satisfaction.
- Case pipeline analysis by month, year, case stage, priority, practice area, and outcome.
- Revenue and billing visibility across fees billed, case value, average fee per case, billable hours, and realization rate.
- Multiple slicers so users can filter the dashboard quickly without rebuilding formulas or charts.
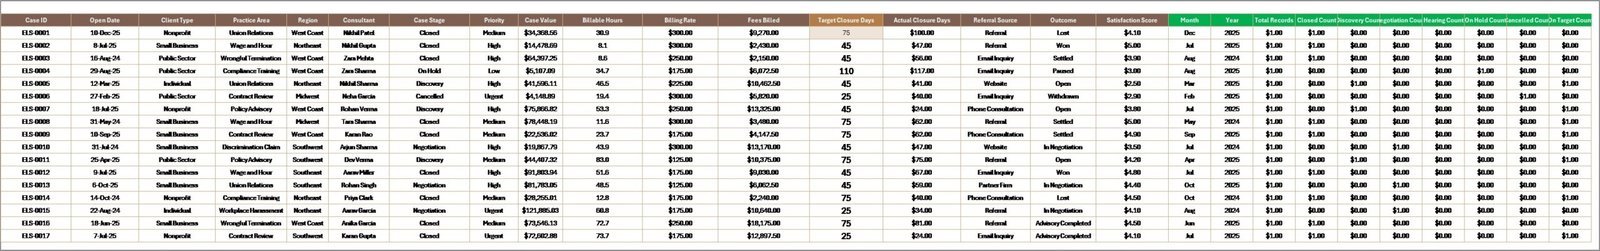
- Data Sheet tab included for replacing the sample records with your own employment law case data.
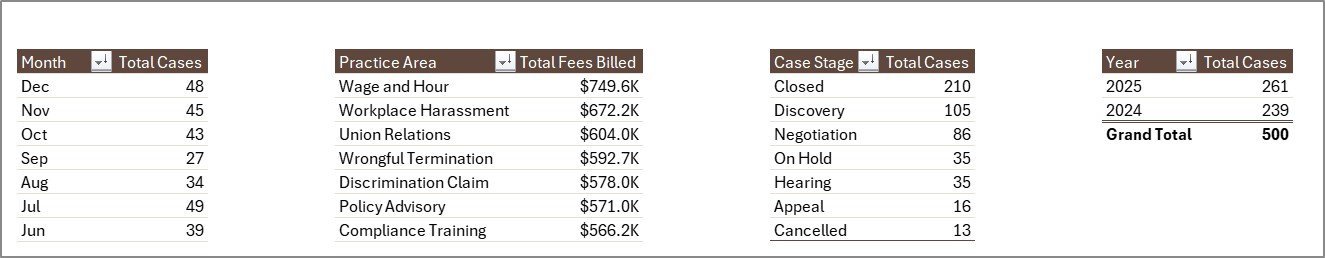
- Support Sheet tab included with pivot tables that drive the entire dashboard dynamically.
What’s Inside the Employment Law Services Dashboard in Excel
1. Overview Page
The Overview Page gives leaders a quick view of total matters, value, billing, workload, and satisfaction. KPI cards summarize Total Cases, Total Case Value, Total Fees Billed, Total Billable Hours, and Avg. Client Satisfaction.
Total Cases by Month: This chart shows how employment law case volume changes across the year. It helps identify seasonal spikes, intake surges, and slower months for staffing and planning.
Total Cases by Year: This chart compares case count across years. It makes long-term growth or decline visible for partners and practice managers.
Total Cases by Case Stage: This visual breaks cases by stage such as intake, review, negotiation, litigation, or closed. It helps spot backlog areas and where matters are slowing down.
Total Fees Billed by Practice Area: This chart shows which employment law services generate the most billed fees. It helps compare revenue across advisory, disputes, compliance, workplace investigations, and related practice areas.
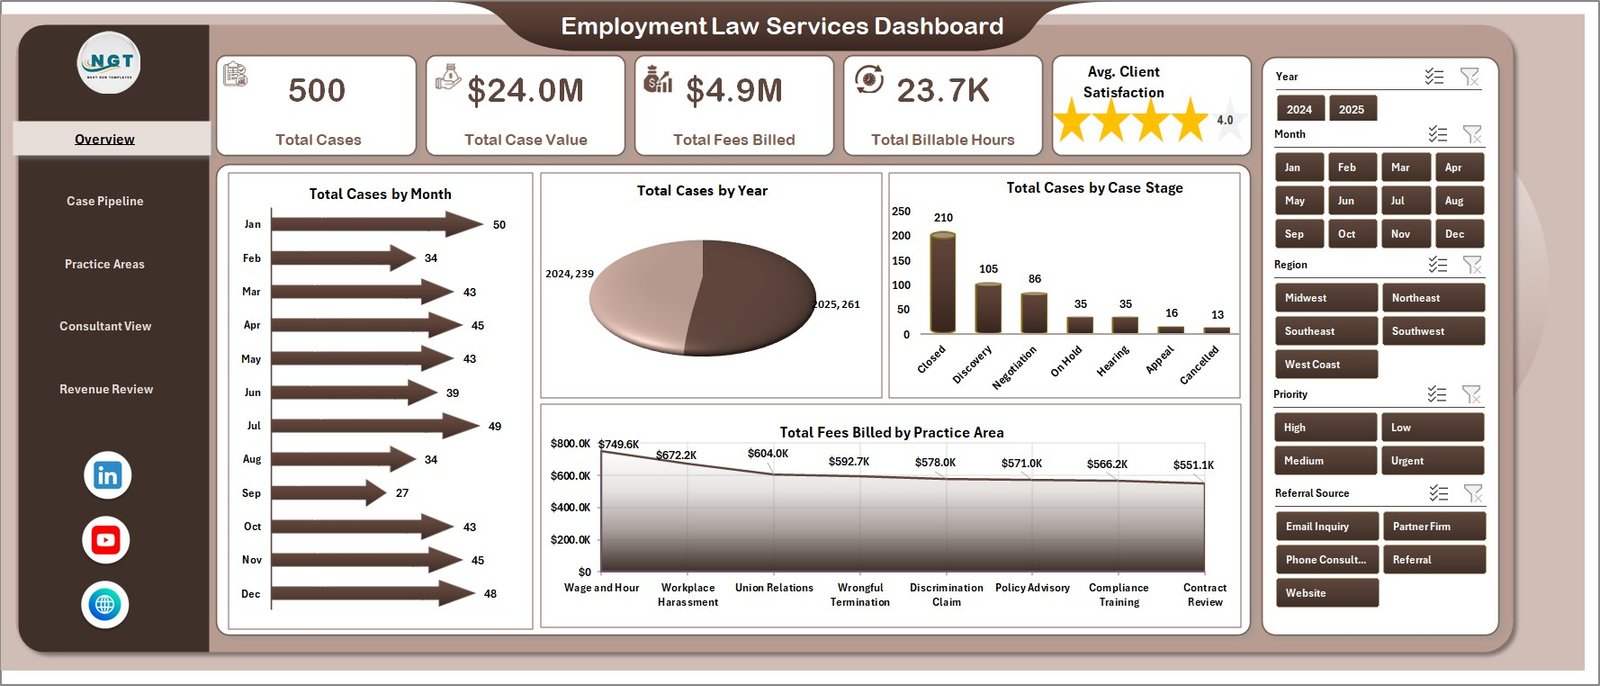
Employment Law Services Dashboard in Excel
2. Case Pipeline
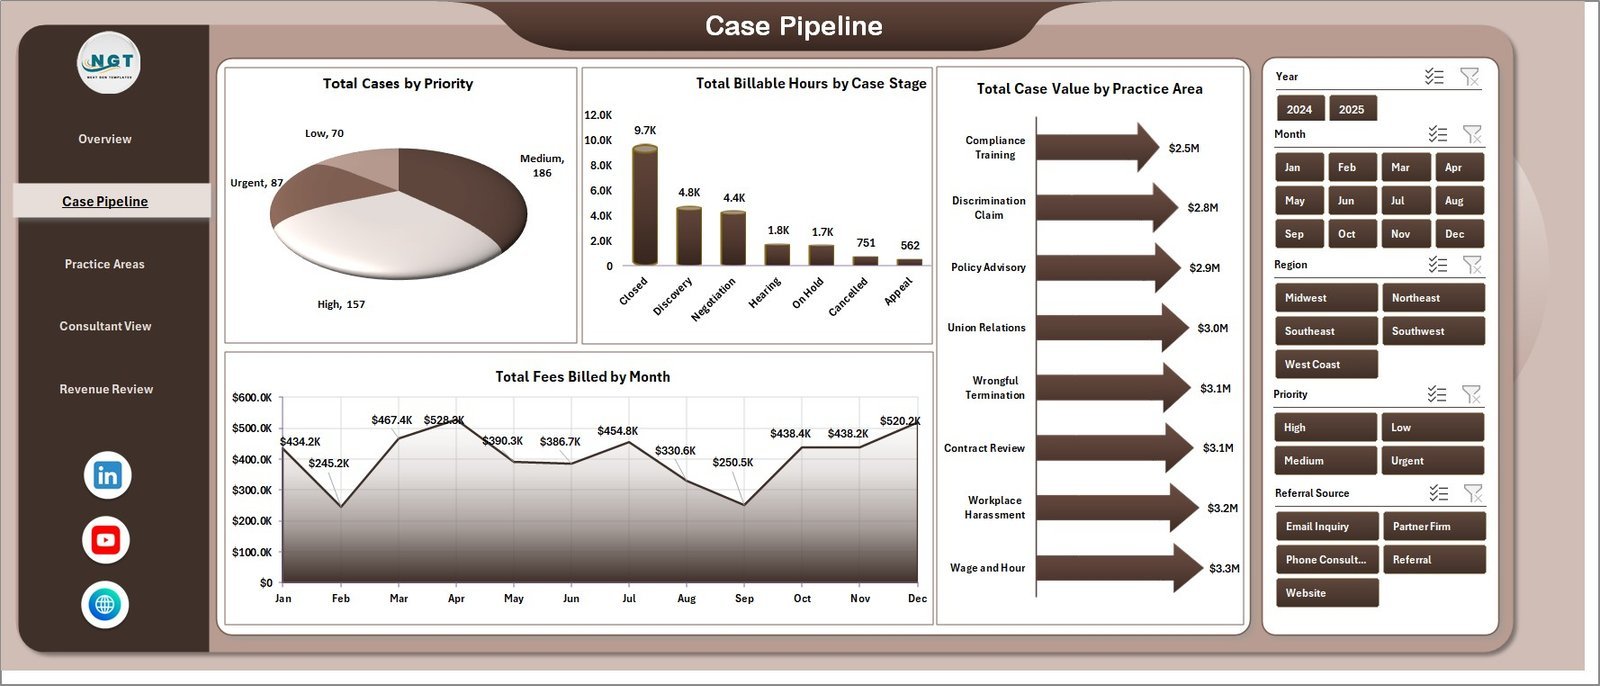
The Case Pipeline sheet focuses on how work is distributed and where legal teams spend time. Total Cases by Priority highlights urgent matters, Total Billable Hours by Case Stage shows effort by workflow phase, Total Case Value by Practice Area compares financial exposure, and Total Fees Billed by Month tracks billing momentum.

Case Pipeline
3. Practice Areas
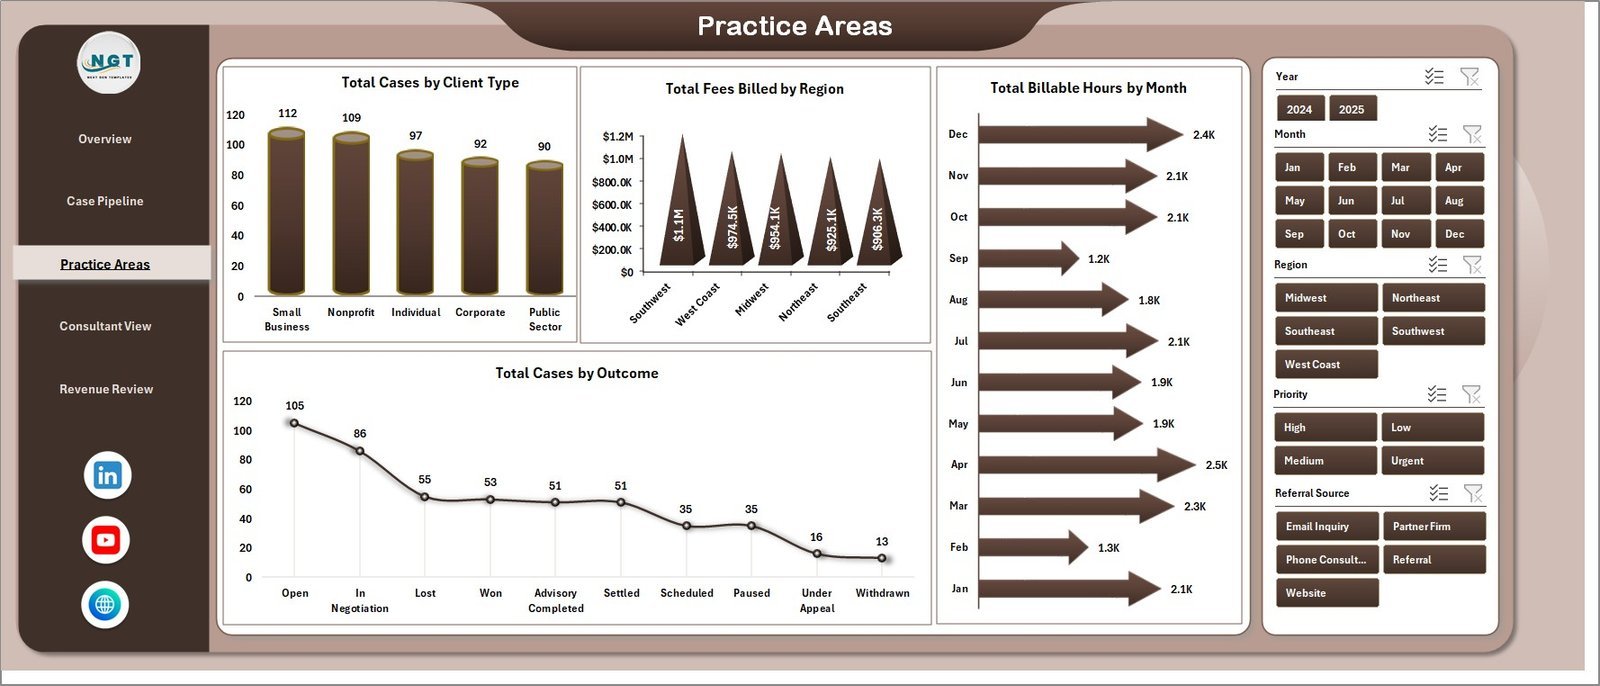
The Practice Areas sheet reviews client mix, regional billing, monthly workload, and outcomes. Total Cases by Client Type shows who uses the service most, Total Fees Billed by Region compares geography, Total Billable Hours by Month reveals workload trends, and Total Cases by Outcome shows resolution patterns.

Practice Areas
4. Consultant View
The Consultant View helps managers review operational performance and referral quality. Avg. Closure Days by Priority reveals turnaround differences, Total Cases by Referral Source shows where work comes from, Total Case Value by Region compares market value, and Total Fees Billed by Priority connects urgency with revenue.
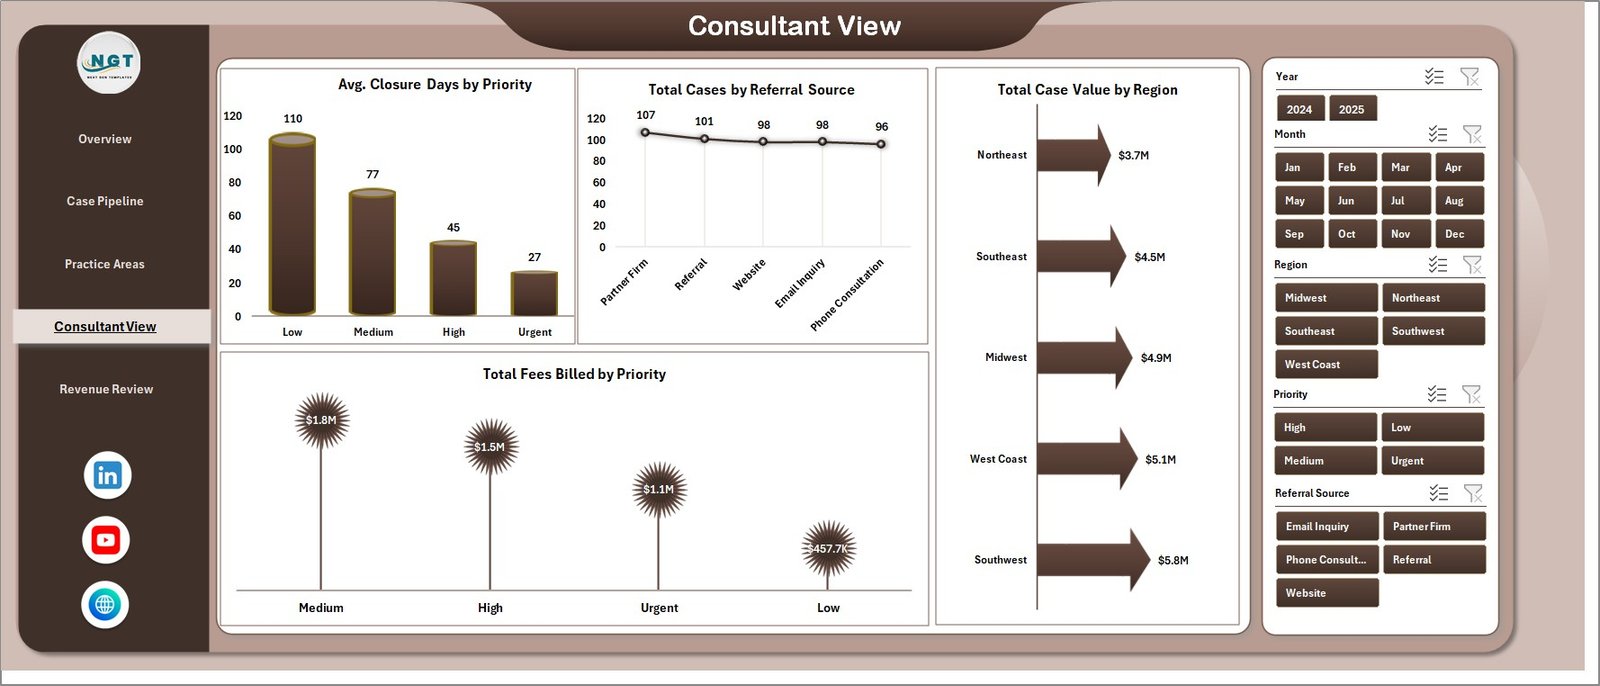
Consultant View
5. Revenue Review
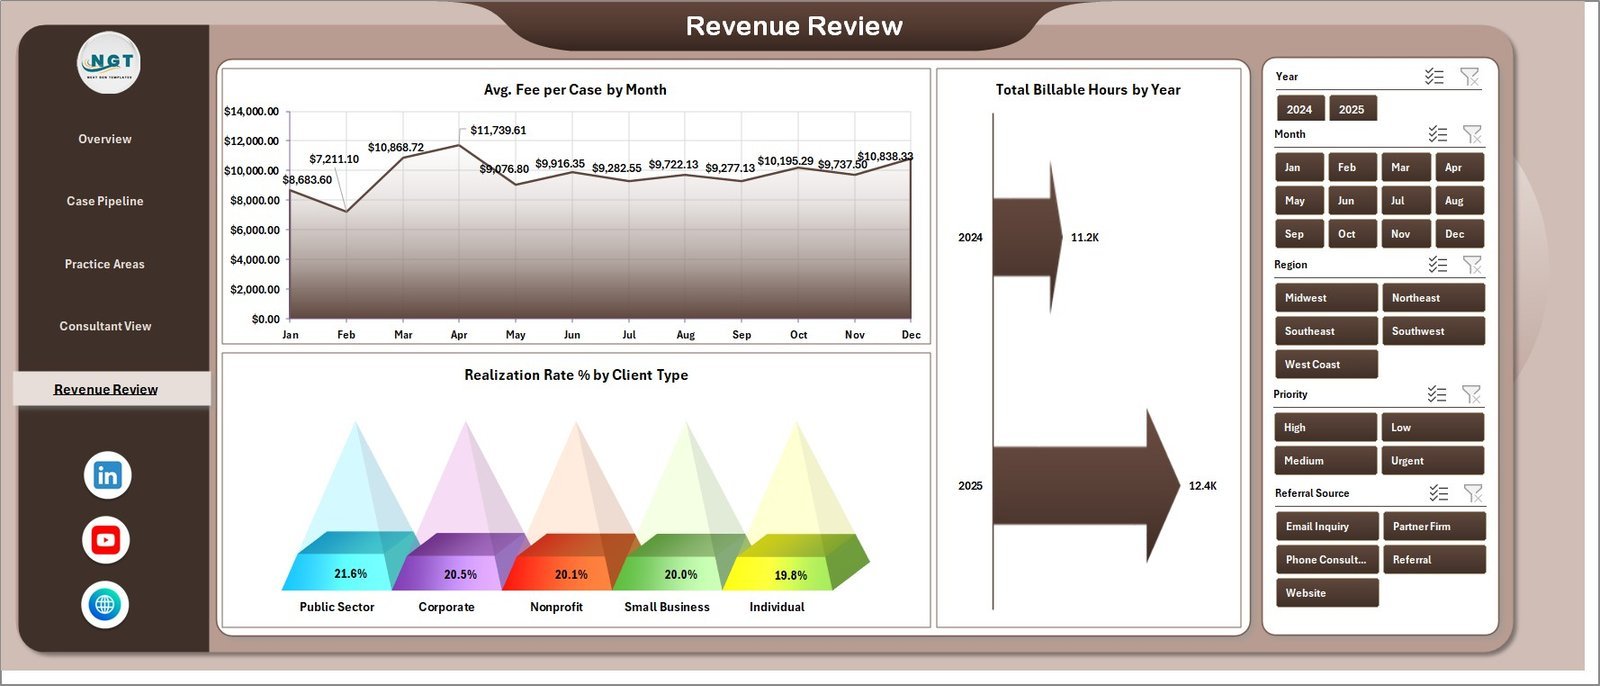
The Revenue Review sheet gives partners and finance teams a focused billing lens. Avg. Fee per Case by Month tracks fee trends, Total Billable Hours by Year shows workload direction, and Realization Rate % by Client Type helps compare billing efficiency across client segments.

Revenue Review
6. Data Sheet Tab
The Data Sheet is where you add your own case records in the same column format. Once updated, the workbook can refresh cards, pivots, slicers, and charts from your data.
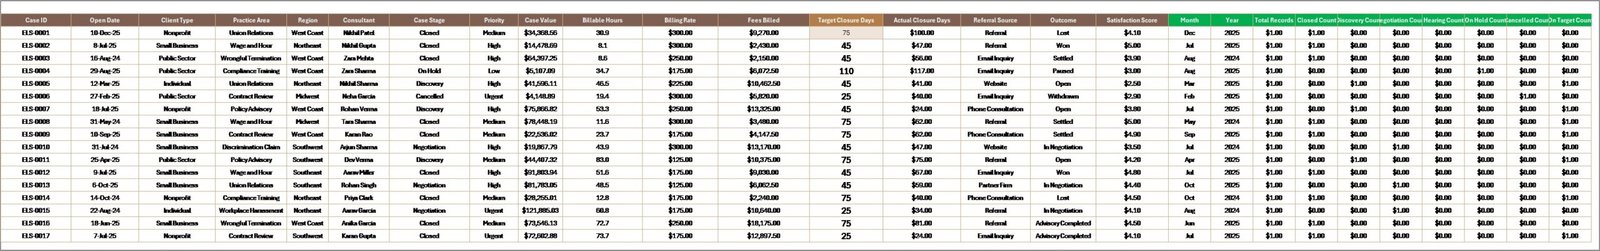
Data Sheet tab
7. Support Sheet
The Support Sheet contains the pivot tables used to create the dashboard dynamically. After updating the Data sheet, go to the Data tab in the Excel Ribbon and click Refresh All; you can keep this support sheet hidden during normal use.
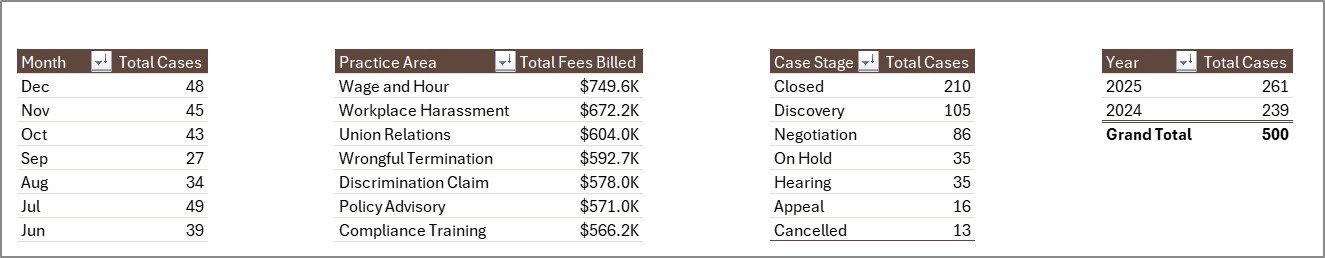
Support sheet tab
Employment Law Services Dashboard in Excel vs. Google Sheets vs. Paid Legal CRM/SaaS – Where This Fits
| Feature | This Excel Dashboard | Google Sheets Alternative | Paid Legal CRM/SaaS |
|---|---|---|---|
| Cost | $17.99 one-time | Usually a custom build | Monthly or annual subscription |
| Platform | Microsoft Excel | Browser-based Sheets | Vendor cloud platform |
| Setup time | Open workbook, paste data, refresh | Requires sheet and chart setup | Onboarding and configuration needed |
| Customizable fields | Fully editable workbook | Editable but must be rebuilt carefully | Limited by vendor settings |
| Legal analytics focus | Cases, fees, hours, stages, outcomes, realization | Manual build required | Often included in higher plans |
| Year-1 cost at 5 users | $17.99 plus Excel you already use | Low software cost, higher build time | Often hundreds or thousands |
Who This Template Is For – and Who It’s Not For
Best for: employment law firms, legal consultants, HR compliance advisors, labor relations teams, case managers, and practice managers who need clear Excel reporting for matters, fees, hours, and outcomes.
Not for: teams that need e-signatures, court filing automation, conflict checks, document automation, trust accounting, secure client portals, or a full legal practice management system.
How to Use the Employment Law Services Dashboard in Excel
- Download and unzip the file.
- Open the workbook in Microsoft Excel.
- Go to the Data Sheet and replace the sample rows with your own case records.
- Keep the same column structure so pivots and charts stay connected.
- Go to the Excel Data tab and click Refresh All.
- Use slicers to filter by stage, priority, practice area, region, client type, and other fields.
- Hide the Support Sheet if you want a cleaner end-user workbook.
Real-World Use Cases
Anita, employment law partner: Anita reviews total case value, billed fees, and realization rate before monthly partner meetings so revenue discussions stay tied to actual matter data.
Marcus, HR legal consultant: Marcus filters by client type and practice area to explain which advisory services are growing and which case stages consume the most hours.
Priya, practice coordinator: Priya checks cases by priority and closure days to follow up on urgent employment disputes before deadlines become operational risk.
Frequently Asked Questions
What does this Excel dashboard track?
It tracks total cases, case value, fees billed, billable hours, satisfaction, case stages, priorities, practice areas, client types, regions, referral sources, outcomes, closure days, and realization rate.
Do I need advanced Excel skills?
No. Add data in the provided format, refresh the workbook, and use the existing slicers, cards, pivots, and charts.
Can I use this for my own law firm data?
Yes. Replace the sample records in the Data Sheet with your own structured employment law case records.
Can I hide the Support Sheet?
Yes. The Support Sheet contains pivot tables for the dashboard and can be hidden after setup.
Is this a legal case management system?
No. It is an Excel analytics dashboard, not a CRM, billing platform, client portal, or legal document system.
Is this a subscription?
No. This is a one-time downloadable Excel template purchase.
About the Author
Built by PK – Microsoft Certified Professional with 15+ years of Excel, Google Sheets, and Power BI experience. Founder of NextGenTemplates, reaching 300K+ subscribers across YouTube channels. Every template is hand-built and tested before release.
Explore Related Templates
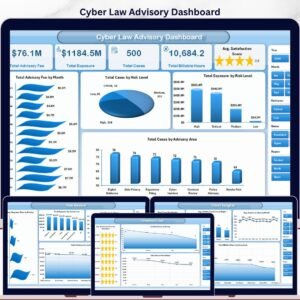
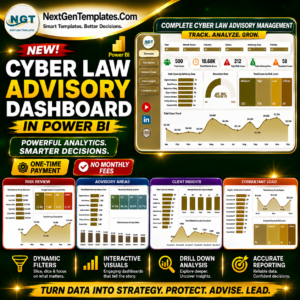
Pair this template with Cyber Law Advisory Dashboard in Excel and Cyber Law Advisory Dashboard in Power BI. Browse more Excel Dashboard templates and MS Excel templates. For a detailed written walkthrough, read the Employment Law Services Dashboard in Excel blog post.
Download the Employment Law Services Dashboard in Excel today and start reviewing cases, value, fees, billable hours, satisfaction, outcomes, and realization rate from one editable workbook.
Last updated: June 2026


Reviews
There are no reviews yet.