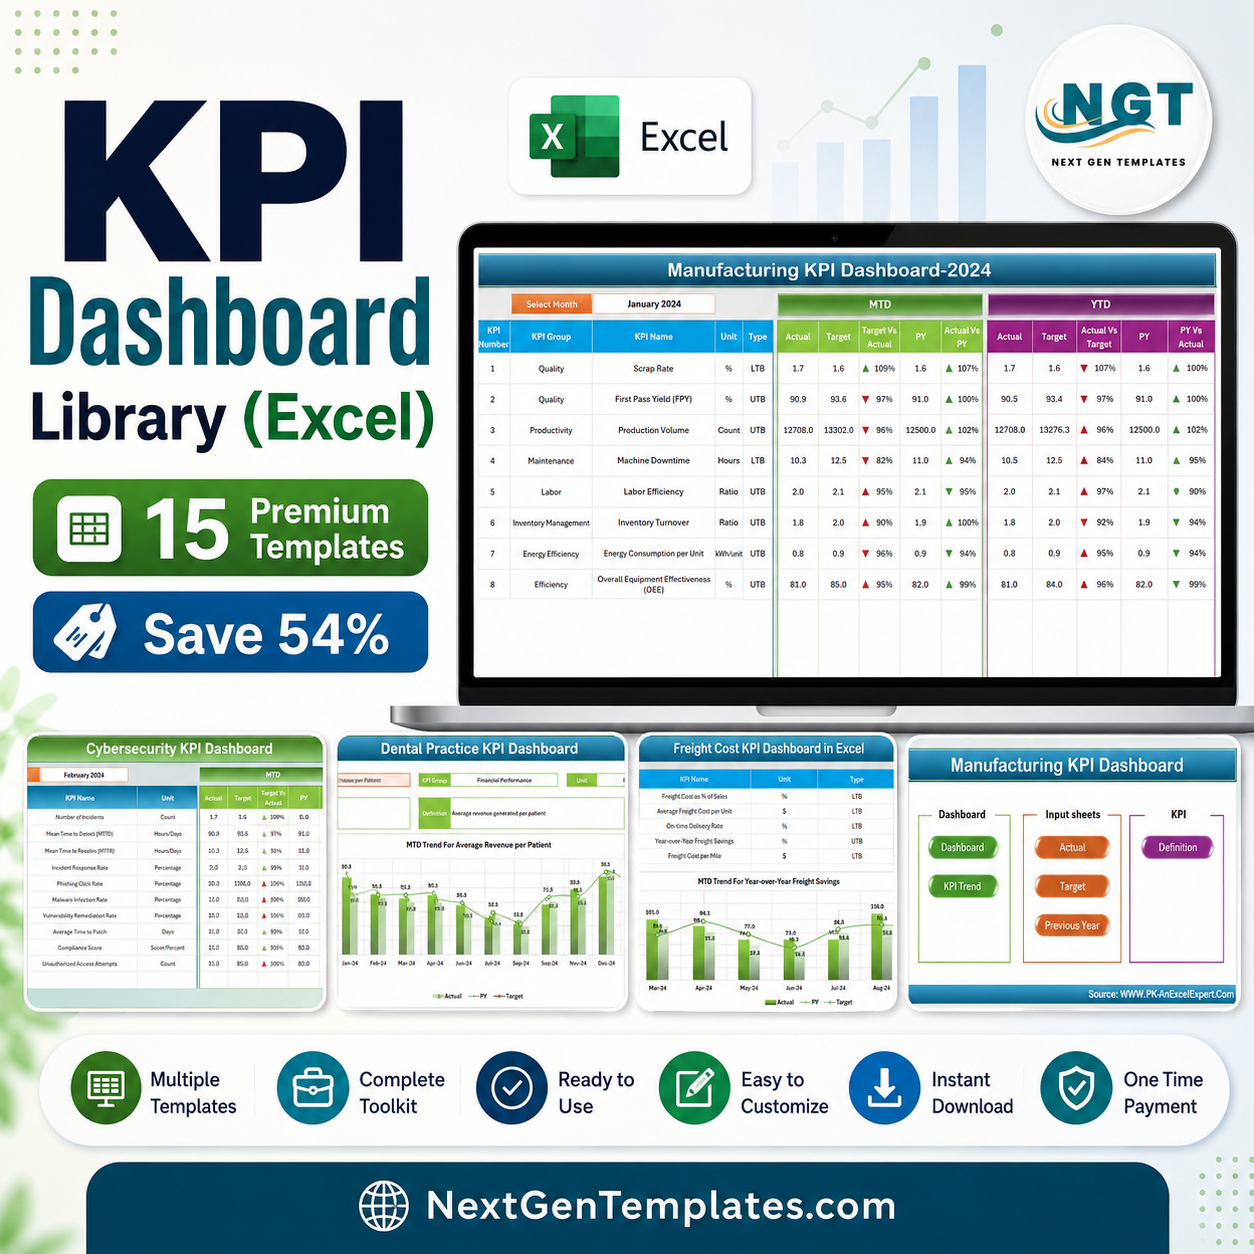
The KPI Dashboard Library (Excel) is the ultimate all-in-one collection for anyone who lives in spreadsheets. Instead of paying for dashboards one at a time, you get 15 premium Excel KPI dashboards spanning manufacturing, IT, logistics, real estate, healthcare, insurance and safety – all for a single bundle price of $89.99 instead of the $194.85 you would pay buying them individually. That is a 54% saving ($104.86 off) on a ready-to-use analytics toolkit you can deploy today.
Every dashboard in this Excel KPI dashboard bundle is built on the same proven framework: clean input sheets, pre-built formulas, MTD / YTD / PY tracking, target-vs-actual comparisons, KPI definition sheets and interactive charts with conditional formatting. Learn one, and you instantly know how to use all fifteen.
🔑 Key Features of the KPI Dashboard Library (Excel)
🔹 15 industry-spanning dashboards – a complete KPI dashboard template pack covering operations, finance, logistics and facilities in one download.
🔹 100% Microsoft Excel – no plugins, no macros to enable, no internet required; works on Excel 2016, 2019, 2021 and Microsoft 365.
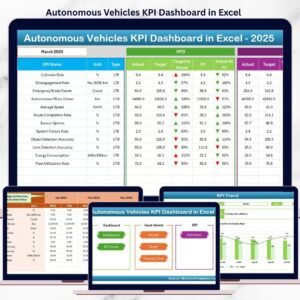
🔹 MTD, YTD & Previous-Year tracking – see current performance against history at a glance on every sheet.
🔹 Pre-built formulas & KPI definitions – each metric is documented with its formula, unit and target so the whole team reads the numbers the same way.
🔹 Interactive charts & conditional formatting – red/amber/green cues and dynamic visuals highlight problems before they grow.
🔹 Target vs Actual analysis – set goals per KPI and instantly measure the gap.
🔹 Plug-and-play setup – type your data into the input sheet and the dashboard updates automatically.
🔹 Fully customizable – recolor, rename KPIs, add rows or adapt layouts to match your business with zero coding.
🔹 Lifetime access & free updates – download once and keep every file forever.
📦 What’s Inside the KPI Dashboard Library (Excel)
This bundle includes the following 15 dashboards – click any title to view the individual product:
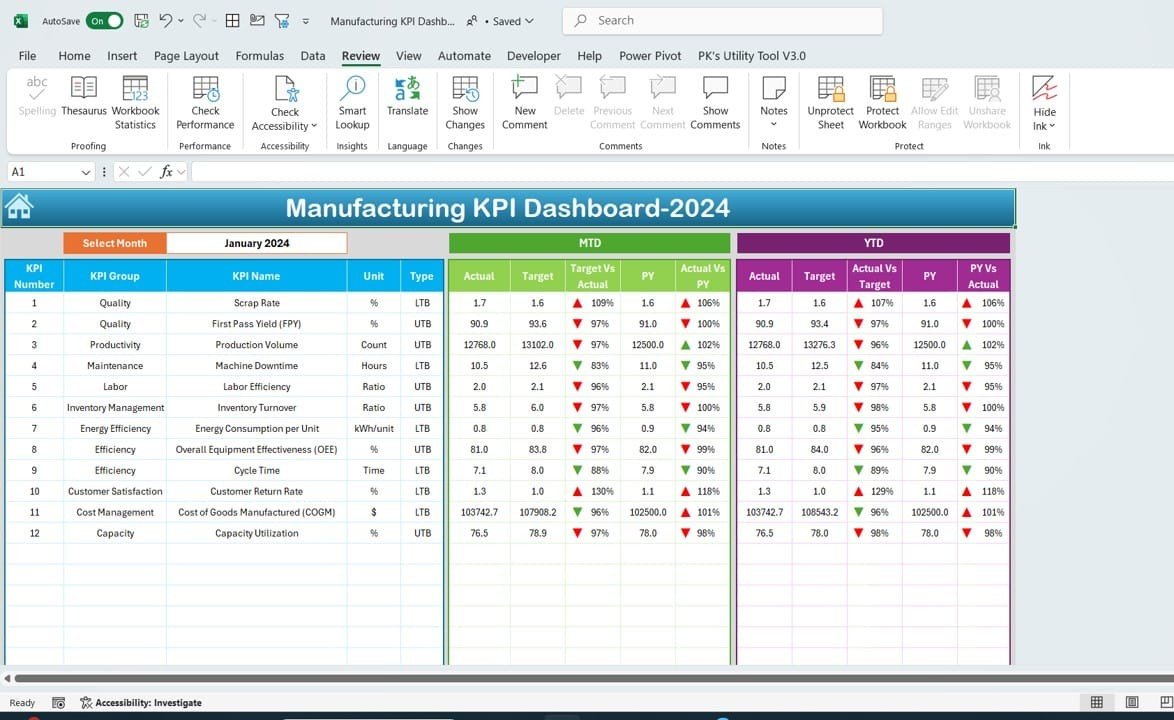
- Manufacturing KPI Dashboard – track production efficiency, scrap rate, cycle time, machine downtime and quality metrics like First Pass Yield.
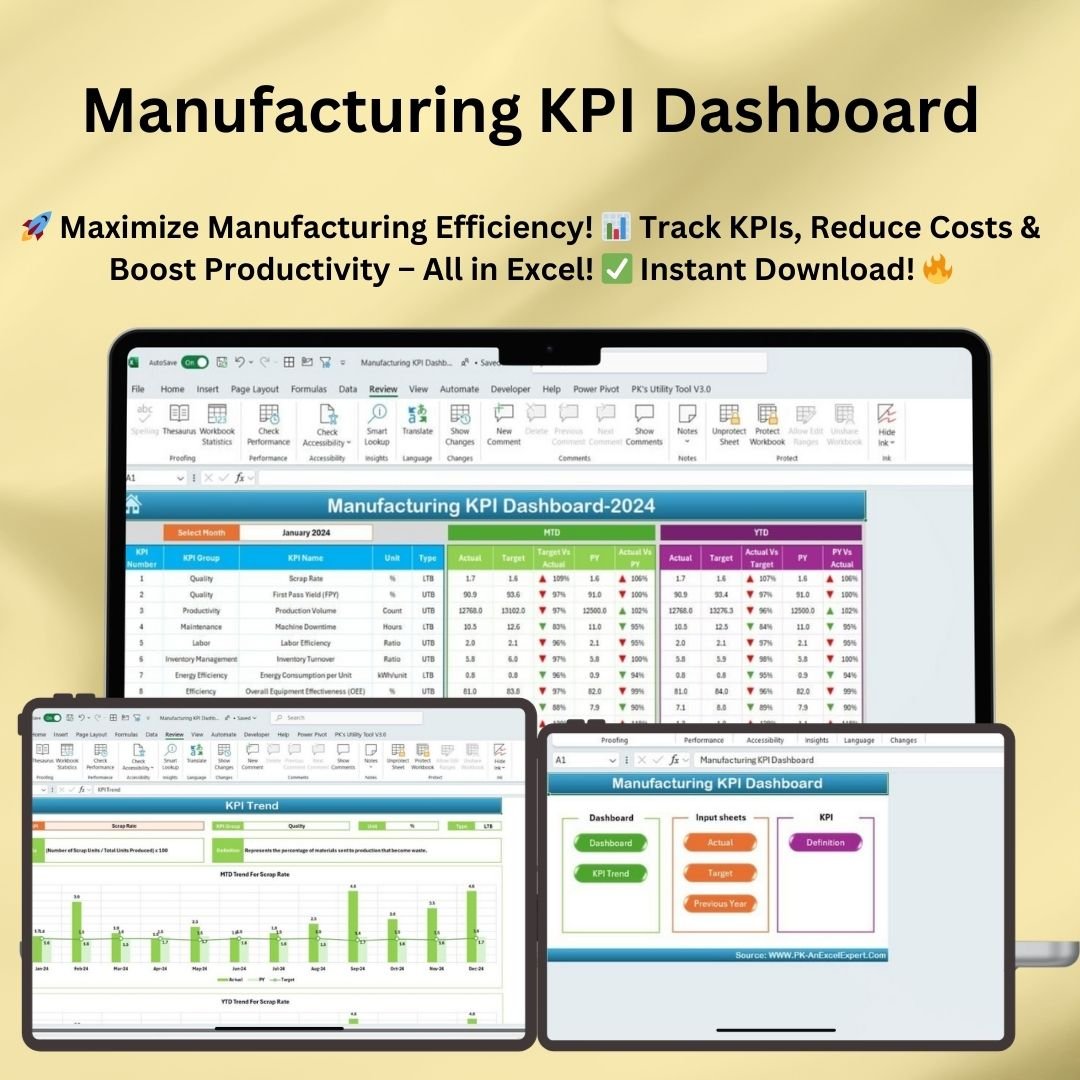
Manufacturing KPI Dashboard
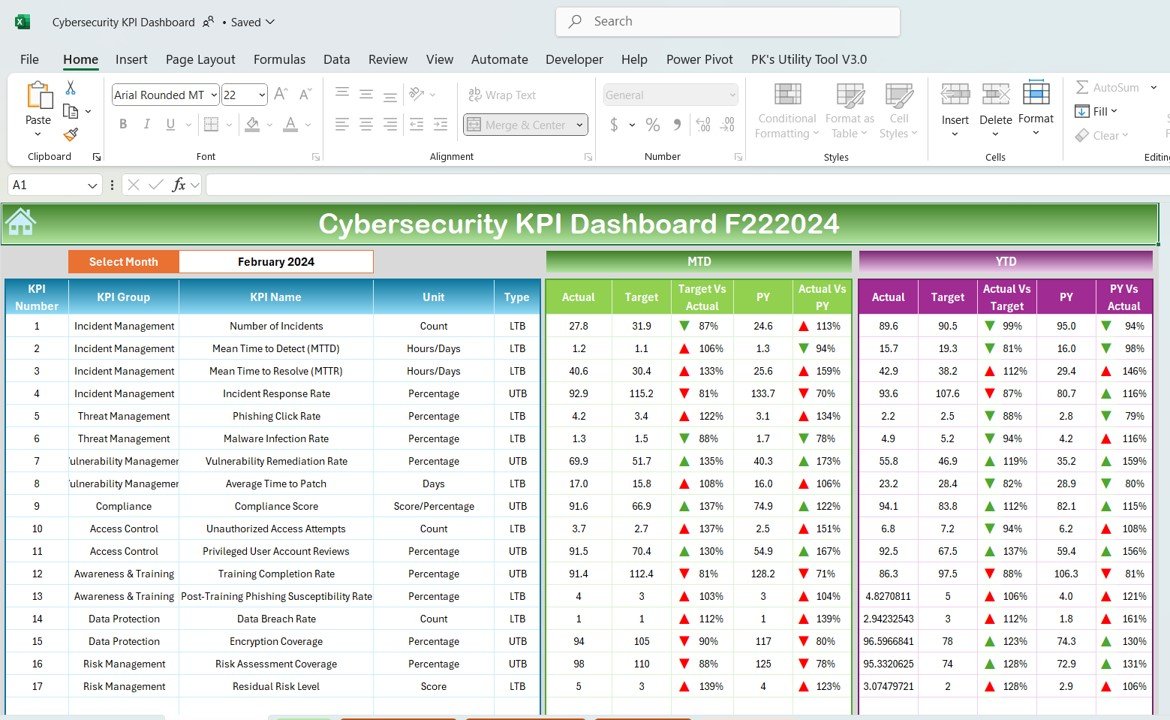
- Cybersecurity KPI Dashboard – monitor incidents, mean time to detect/respond, patch status, phishing rates and overall security posture.
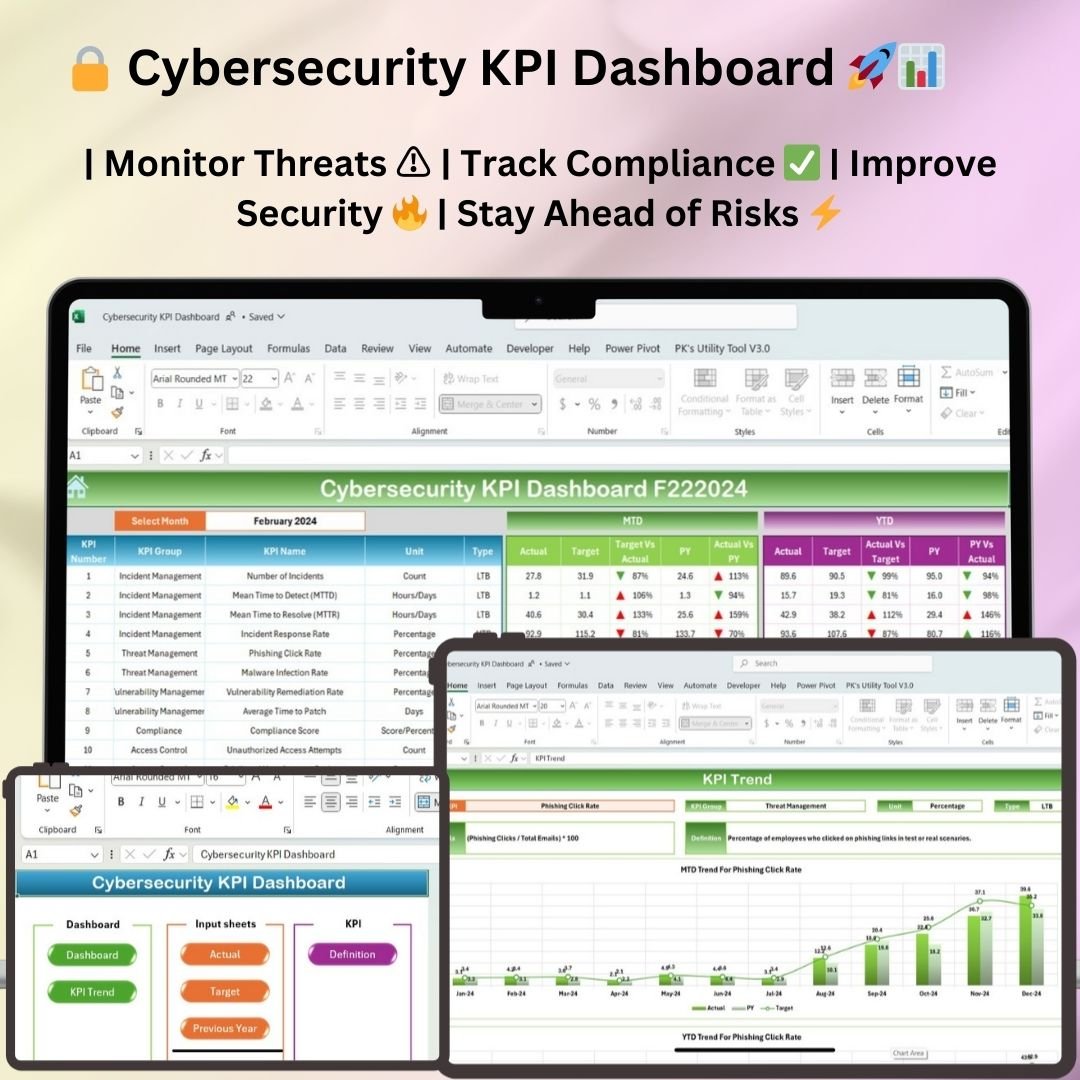
Cybersecurity KPI Dashboard
- Dental Practice KPI Dashboard – measure patient visits, revenue per chair, case acceptance, recall rates and practice profitability.
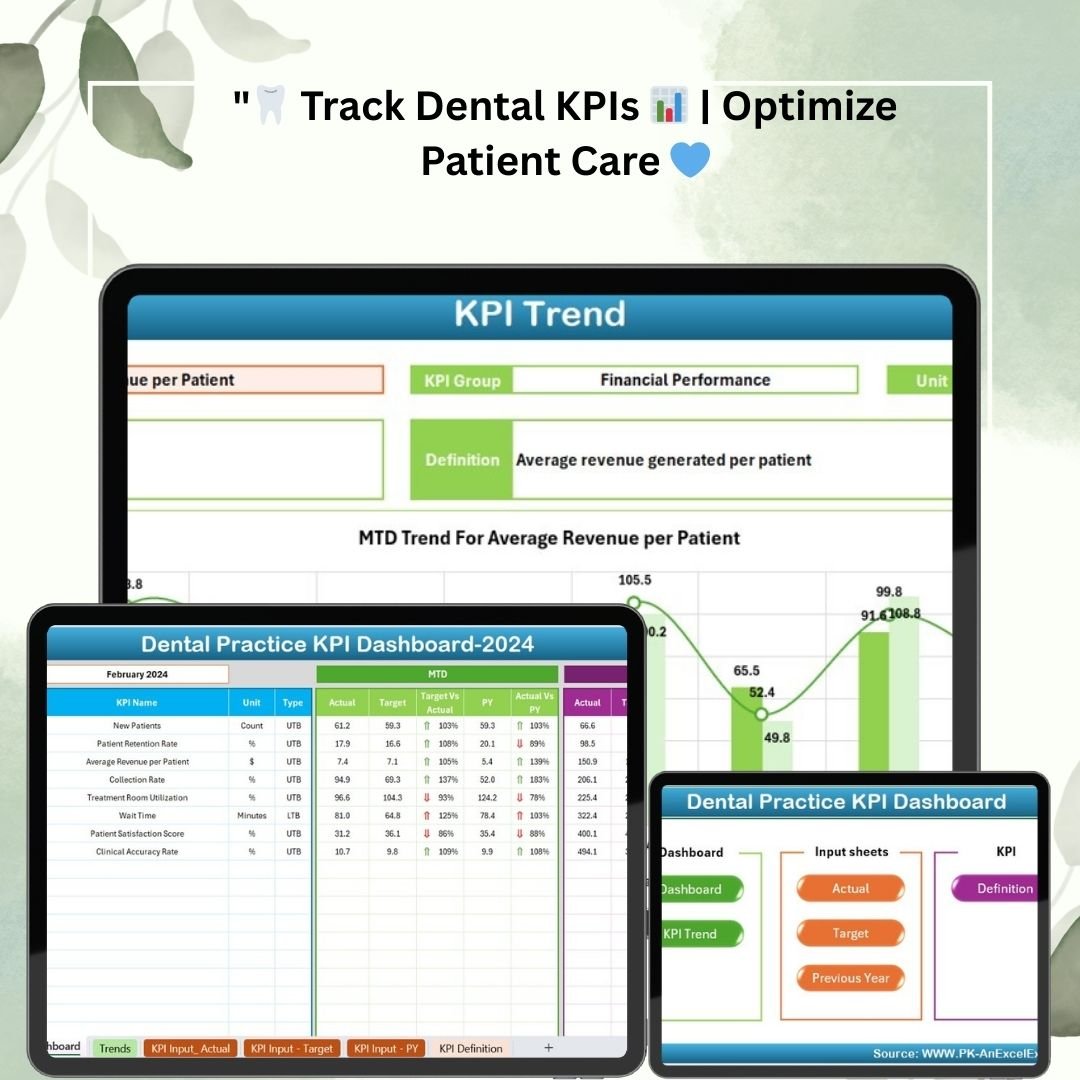
Dental Practice KPI Dashboard
- Freight Cost KPI Dashboard – analyze cost per shipment, cost per mile, carrier performance and freight spend trends.

Freight Cost KPI Dashboard
- Warehouse Management KPI Dashboard – track order accuracy, picking productivity, inventory turnover and space utilization.
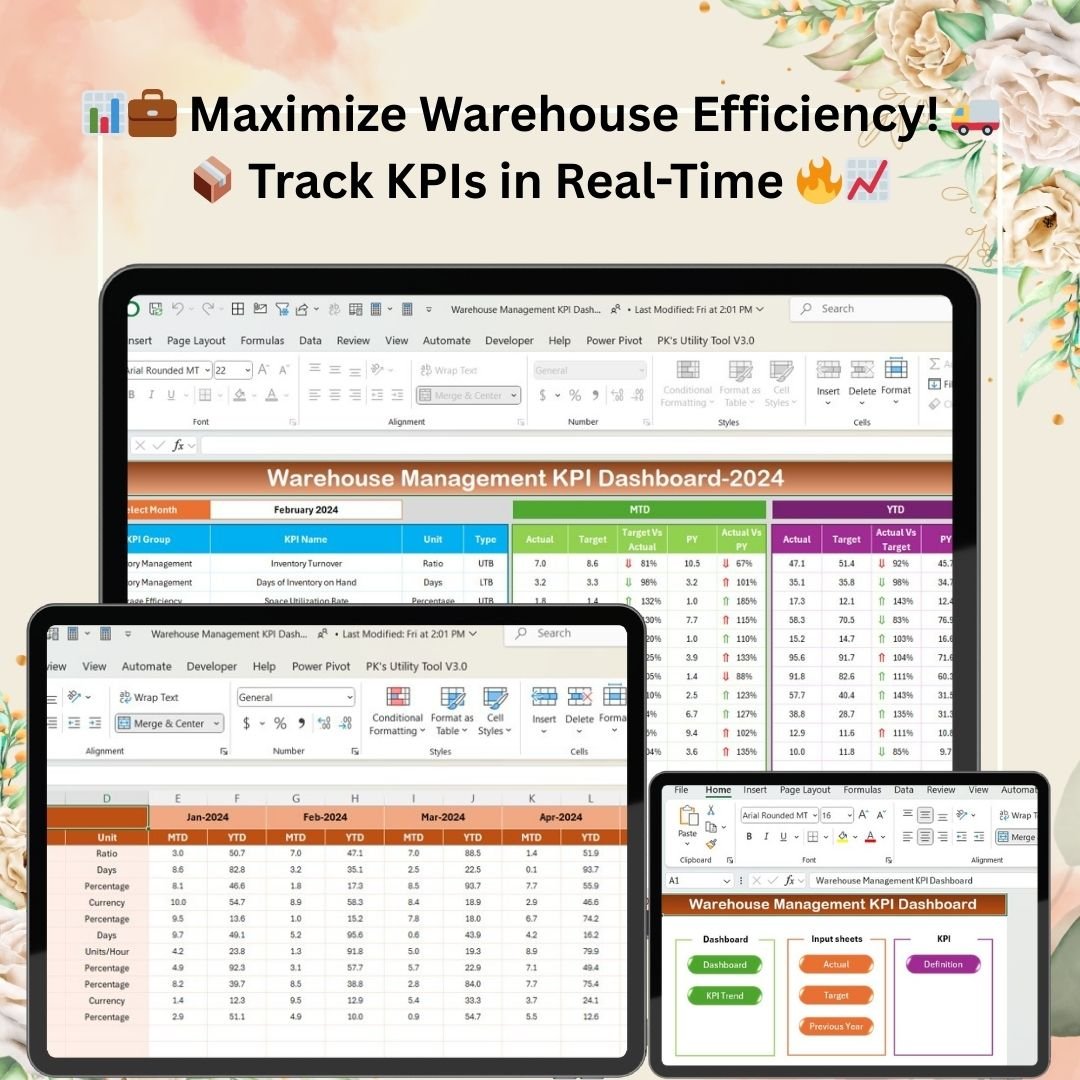
Warehouse Management KPI Dashboard
- Industrial Manufacturing KPI Dashboard – monitor OEE, throughput, energy usage and plant-wide production performance.

Industrial Manufacturing KPI Dashboard
- Data Center KPI Dashboard – track uptime, PUE, capacity, incident response and infrastructure efficiency.

Data Center KPI Dashboard
- IT Operations KPI Dashboard – measure ticket volume, SLA compliance, MTTR, system availability and service desk performance.
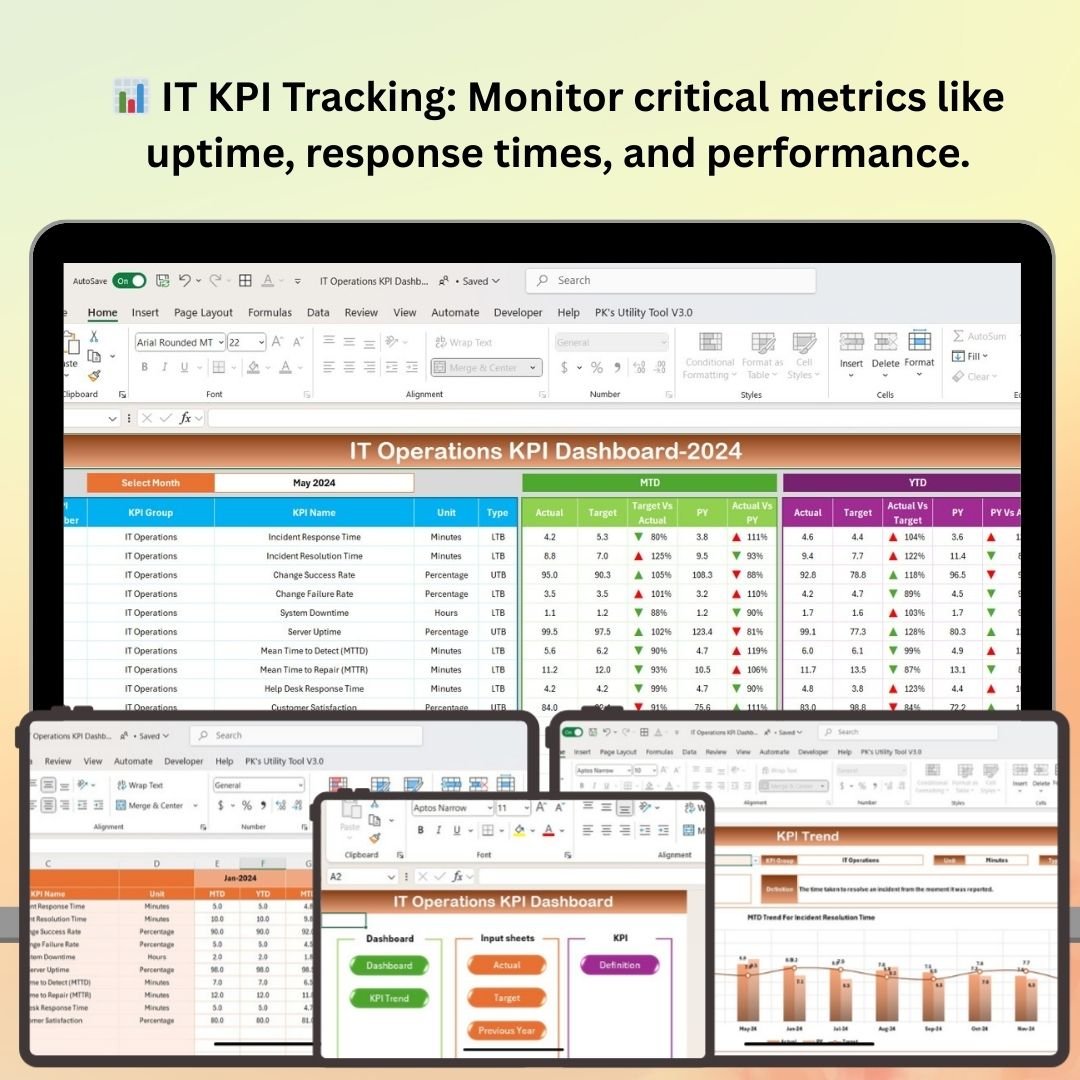
IT Operations KPI Dashboard
- Fleet Management KPI Dashboard – track fuel cost, maintenance, vehicle utilization, downtime and cost per mile.

Fleet Management KPI Dashboard
- Construction KPI Dashboard – monitor budget vs actual, schedule variance, project margins and resource utilization.
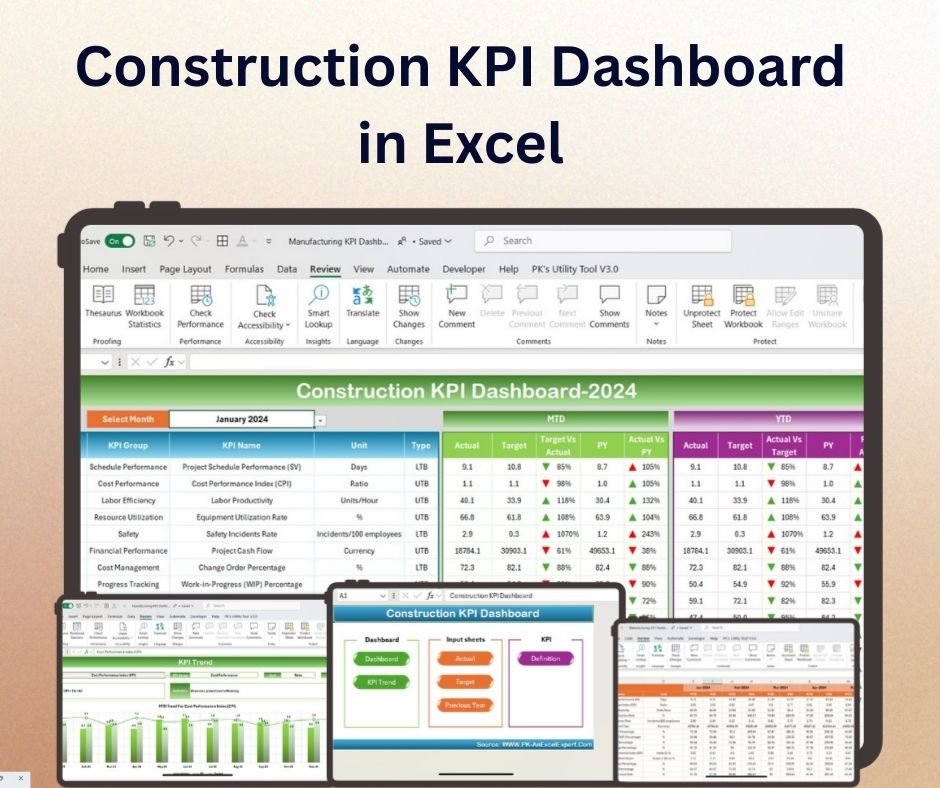
Construction KPI Dashboard
- Shipping KPI Dashboard – track on-time delivery, transit time, damage rate and shipping cost per order.
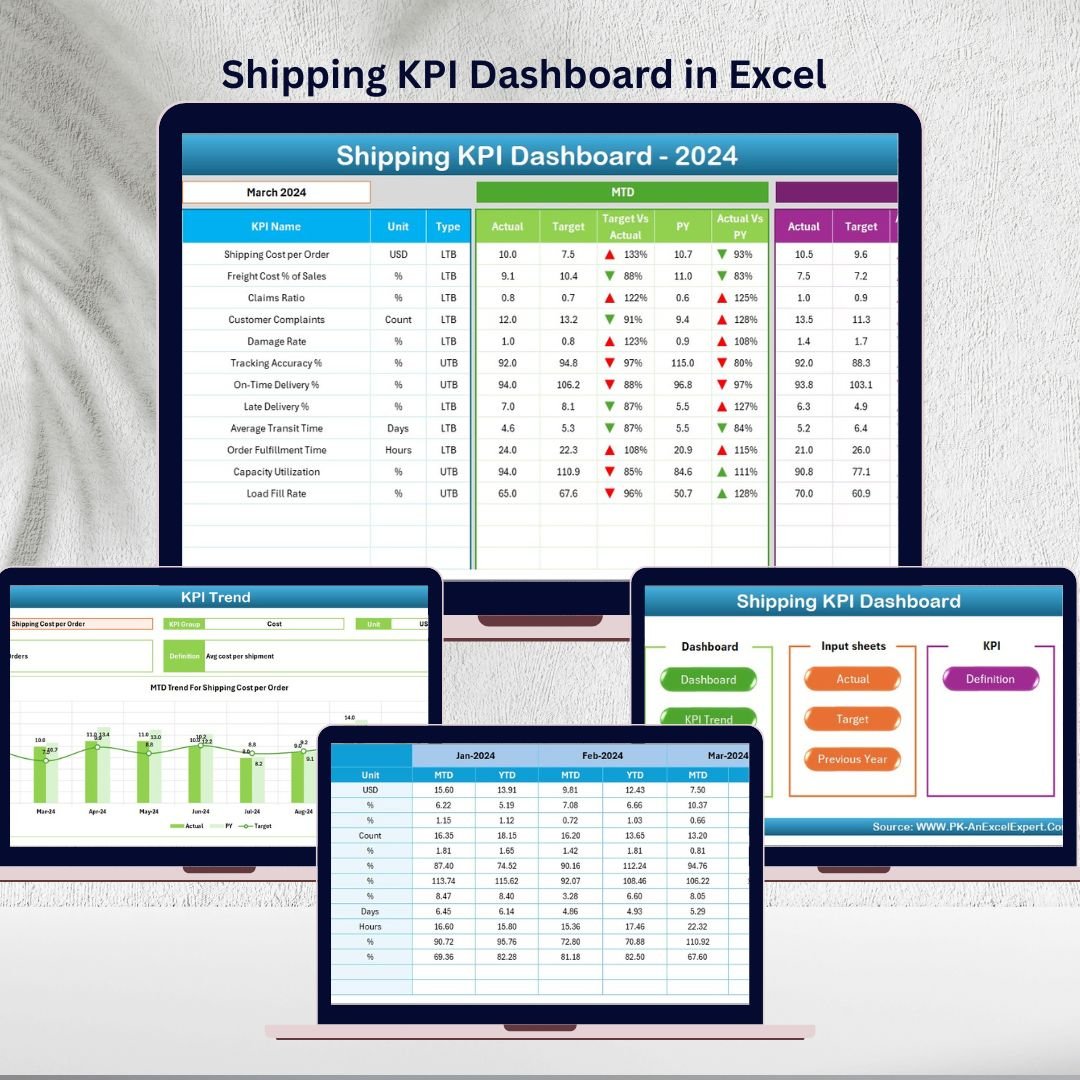
Shipping KPI Dashboard
- Property Management KPI Dashboard – measure occupancy, rent collection, maintenance cost and net operating income.

Property Management KPI Dashboard
- Vacation Rental KPI Dashboard – track occupancy rate, ADR, RevPAR, booking sources and review scores.
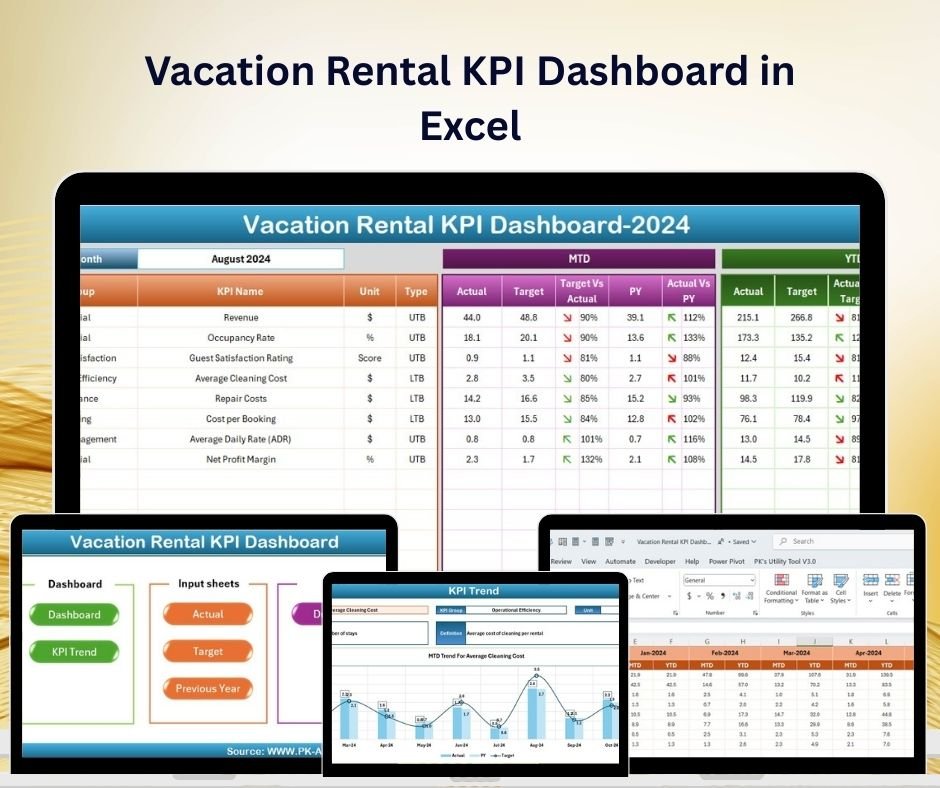
Vacation Rental KPI Dashboard
- Insurance KPI Dashboard – monitor loss ratio, claims cycle time, policy growth, retention and premium trends.
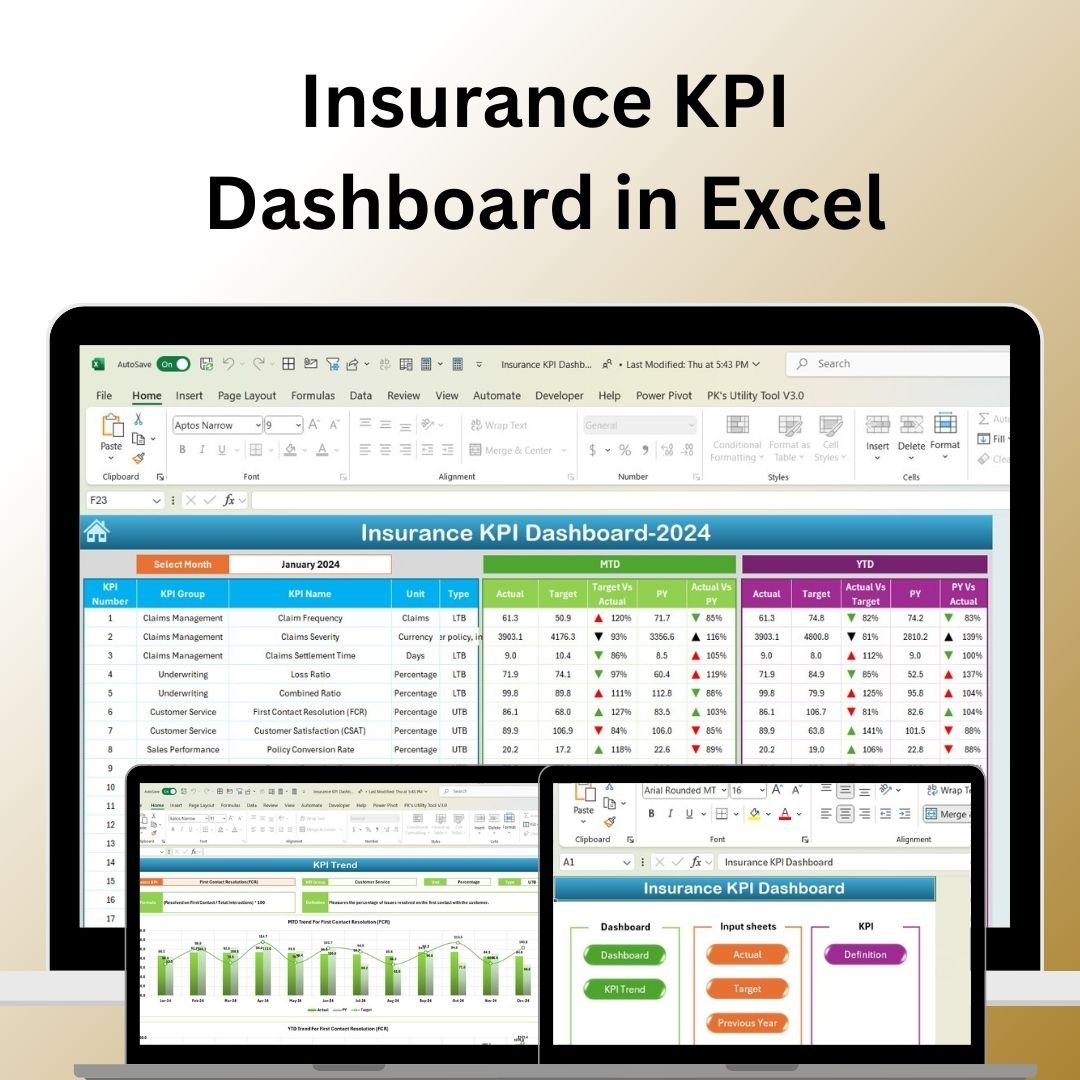
Insurance KPI Dashboard
- Construction Safety KPI Dashboard – track incident rate, TRIR, near misses, training compliance and safety audits.

Construction Safety KPI Dashboard
💡 Smart Comparison – Individual vs Bundle
| Option | What You Get | Price | Best Value |
|---|---|---|---|
| Buying Individually | 15 dashboards @ $12.99 each | ❌ | |
| KPI Dashboard Library (Bundle) | All 15 dashboards + free updates | $89.99 | ✅ Save $104.86 (54%) |
⚙️ How to Use the KPI Dashboard Library
- Download & unzip the bundle to access all 15 Excel files.
- Open the dashboard you need and review the KPI Definition sheet to understand each metric.
- Enter your data in the structured input/actual sheets (monthly, quarterly or yearly).
- Set your targets so target-vs-actual and RAG status update automatically.
- Review the dashboard – charts, KPI cards and trends refresh instantly for decision-making.
👥 Who Can Benefit from This Bundle
✔️ Business analysts & consultants – a ready library to deploy for clients across industries.
✔️ Operations & plant managers – manufacturing, warehouse, fleet and logistics tracking in one kit.
✔️ IT & security leaders – IT operations, data center and cybersecurity dashboards out of the box.
✔️ Property, rental & insurance teams – finance and asset performance at a glance.
✔️ Small business owners & founders – enterprise-grade reporting without enterprise software costs.
Get All 15 Excel KPI Dashboards for Just $89.99
Individual price $194.85 → $89.99 (Save 54%)
Click here to read the detailed blog post about the KPI Dashboard Library (Excel)
Visit our YouTube channel for step-by-step video tutorials on every dashboard.


Reviews
There are no reviews yet.