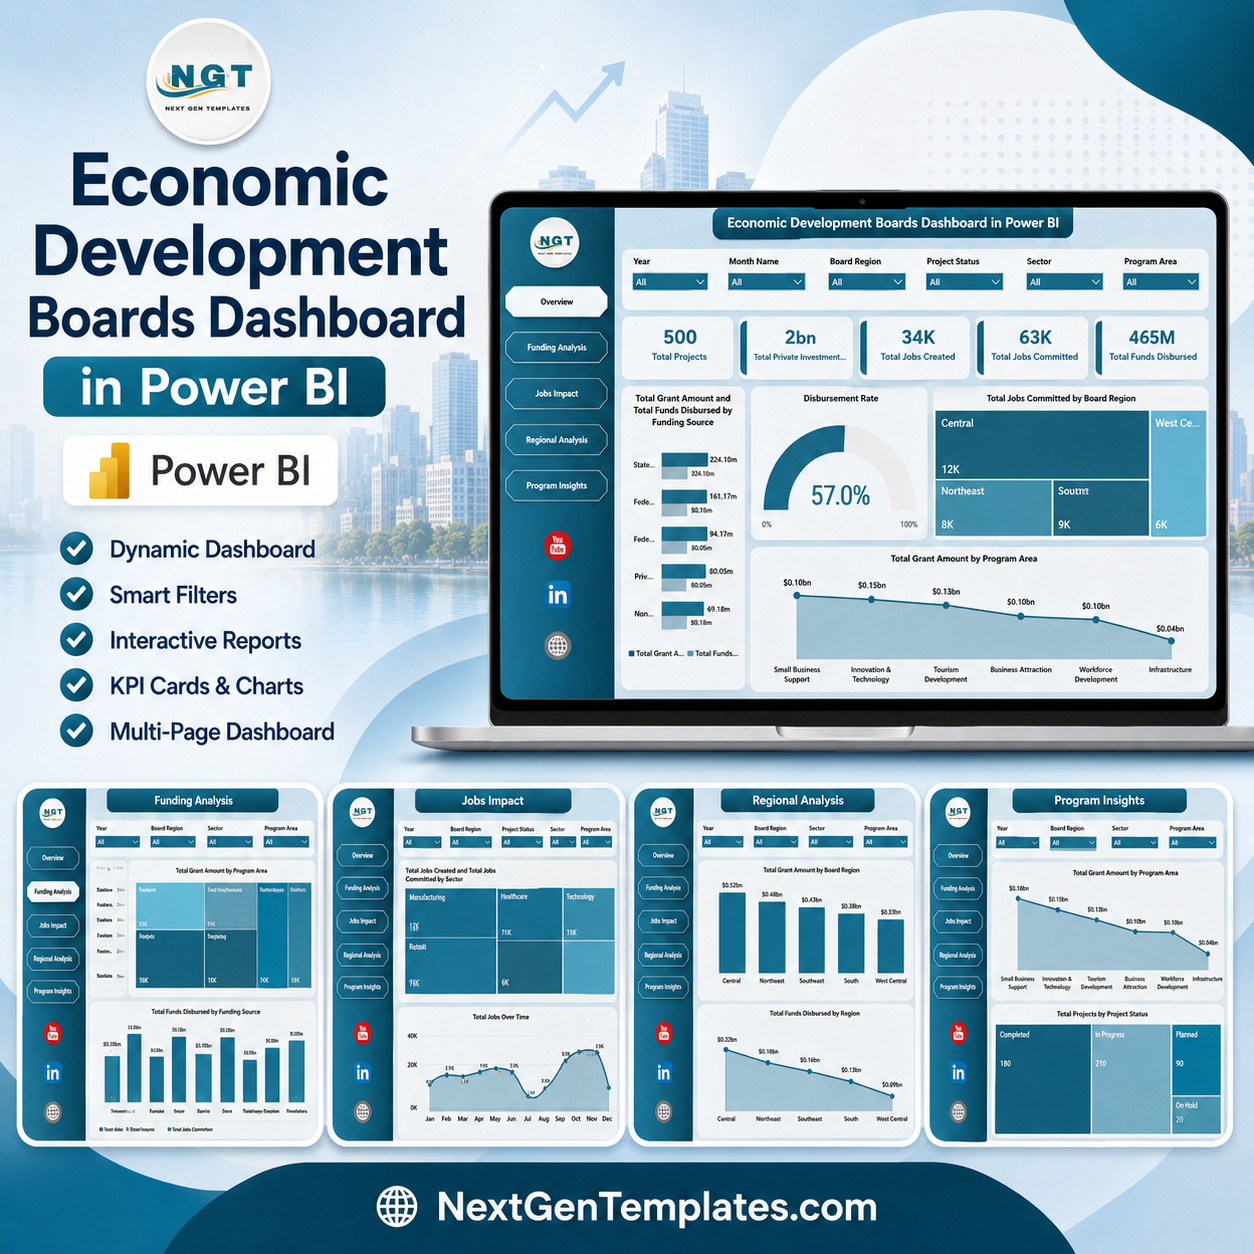


Economic Development Boards Dashboard in Power BI helps public-sector analysts, grant managers, regional boards, and economic development teams review projects, private investment, jobs created, jobs committed, funds disbursed, grant amounts, sectors, funding sources, regions, and program areas in one editable PBIX report. Instead of rebuilding five Power BI pages from scratch or buying a recurring grant reporting system, this template gives you a one-time purchase dashboard with interactive slicers, executive KPI cards, and ready-made visuals for board reporting.
The dashboard is built for practical reviews: check whether disbursements are moving, compare job creation by region, monitor investment by sector, and explain program impact during monthly or quarterly meetings. Instant download, editable PBIX file, no subscription, and a clean risk-reversal path because you can customize the model in Power BI Desktop after purchase.
Key Features of Economic Development Boards Dashboard in Power BI
- 5 Power BI report pages covering Overview, Funding Analysis, Jobs Impact, Regional Analysis, and Program Insights.
- 5 executive KPI cards for Total Projects, Total Private Investment, Total Jobs Created, Total Jobs Committed, and Total Funds Disbursed.
- Interactive slicers to filter the report quickly by region, program, sector, funding source, month, and project status.
- Funding and grant visuals to compare grant amount, disbursed funds, and disbursement rates.
- Jobs impact tracking to review jobs committed, jobs created, businesses assisted, and monthly employment outcomes.
- Regional and program analysis to compare board regions, program areas, impact scores, project statuses, and private investment.
- Editable Power BI file so users can change visuals, colors, fields, measures, and data source settings in Power BI Desktop.
What’s Inside the Economic Development Boards Dashboard in Power BI
1. Overview Page
The Overview page gives leaders a high-level view of economic development activity. The top cards show Total Projects, Total Private Investment, Total Jobs Created, Total Jobs Committed, and Total Funds Disbursed, helping users understand program scale, funding execution, and employment impact in seconds.
Total Grant Amount and Total Funds Disbursed by Funding Source: This chart compares approved grant funding against actual disbursement by source. It helps teams see which funding streams are moving efficiently and which sources may need follow-up.
Disbursement Rate: This visual highlights how much approved funding has converted into actual payouts. It is useful for spotting bottlenecks before they become board-level concerns.
Total Jobs Committed by Board Region: This chart shows planned employment impact by region. It helps leadership understand where commitments are concentrated across the board’s territory.
Total Grant Amount by Program Area: This chart breaks funding across program areas. It helps compare strategic investment priorities and explain allocation decisions clearly.
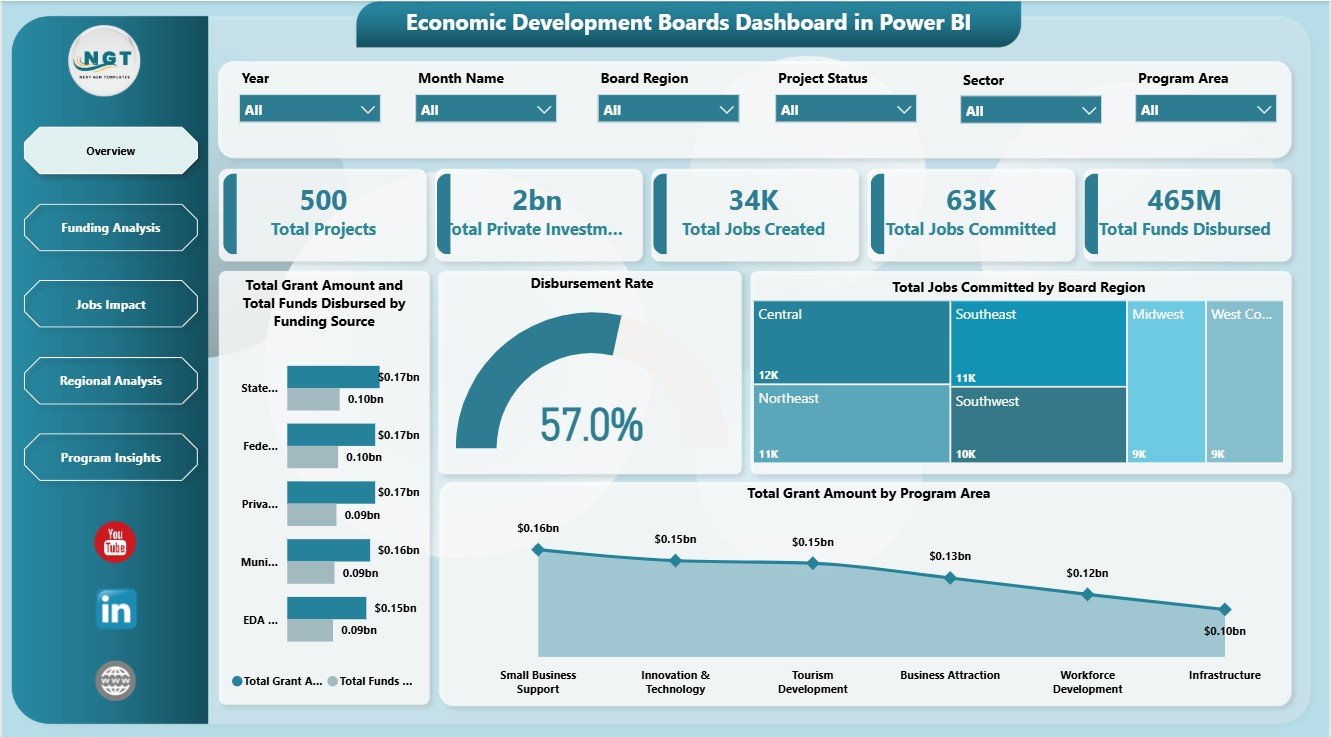
Economic Development Boards Dashboard in Power BI – Overview Page
2. Funding Analysis
The Funding Analysis page focuses on funding movement, sector-level outcomes, and regional disbursement quality. It helps grant teams compare jobs committed versus jobs created by sector, disbursement rate by board region, and the relationship between total grant amount and total private investment by sector.
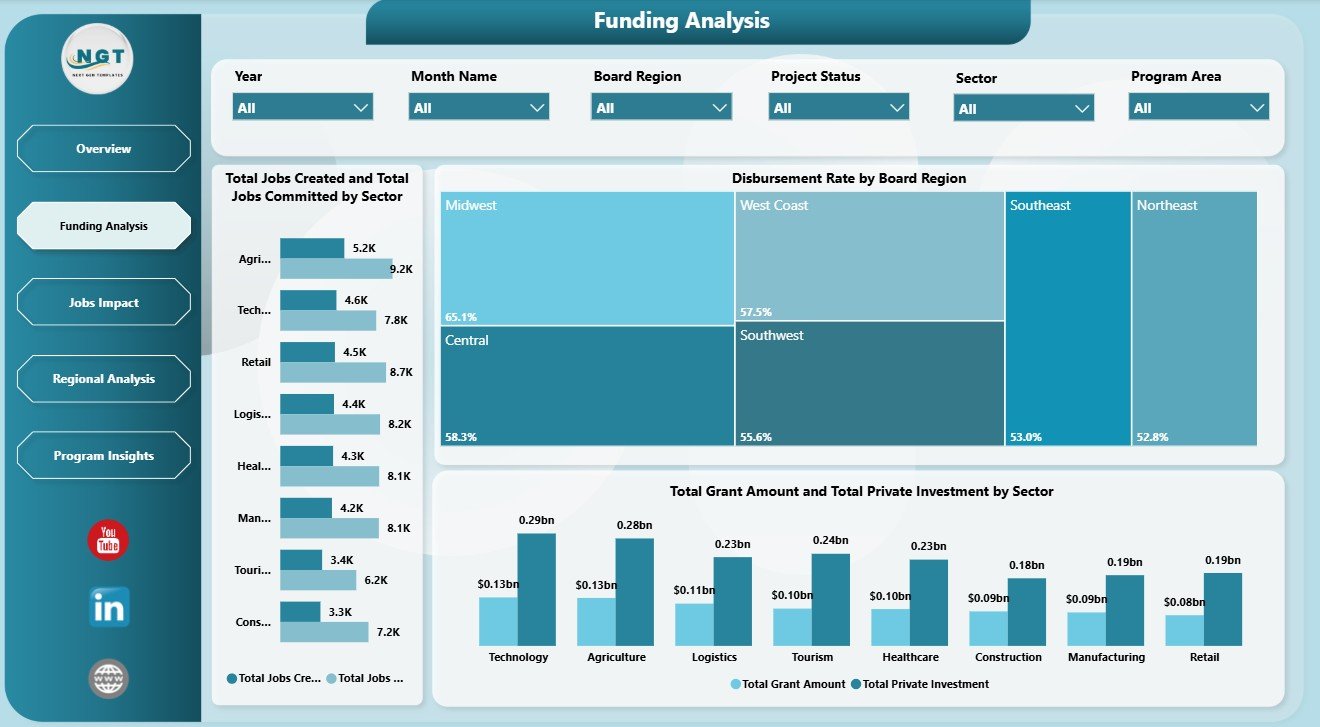
Funding Analysis
3. Jobs Impact
The Jobs Impact page connects public funding to employment and business support outcomes. It includes Total Grant Amount and Total Private Investment by Board Region, Total Businesses Assisted by Board Region, and Total Jobs Created by Month Name for monthly impact review.
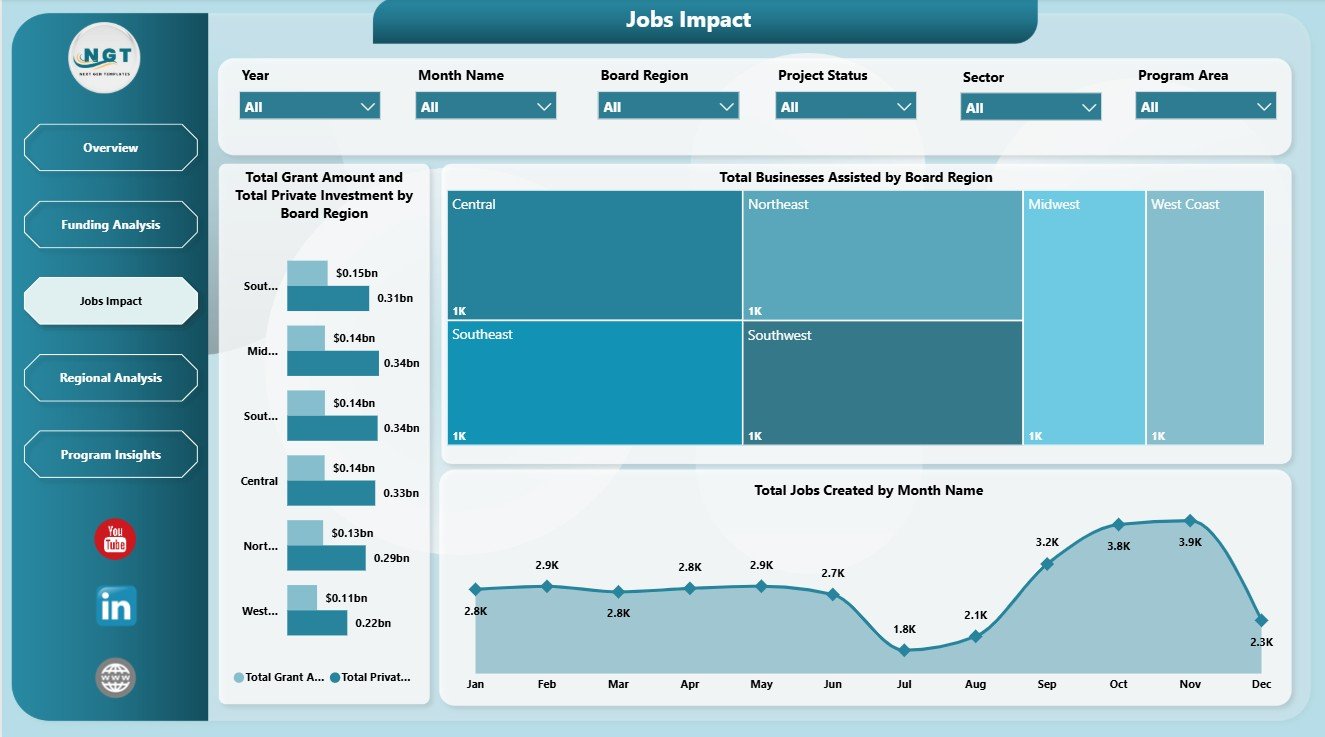
Jobs Impact
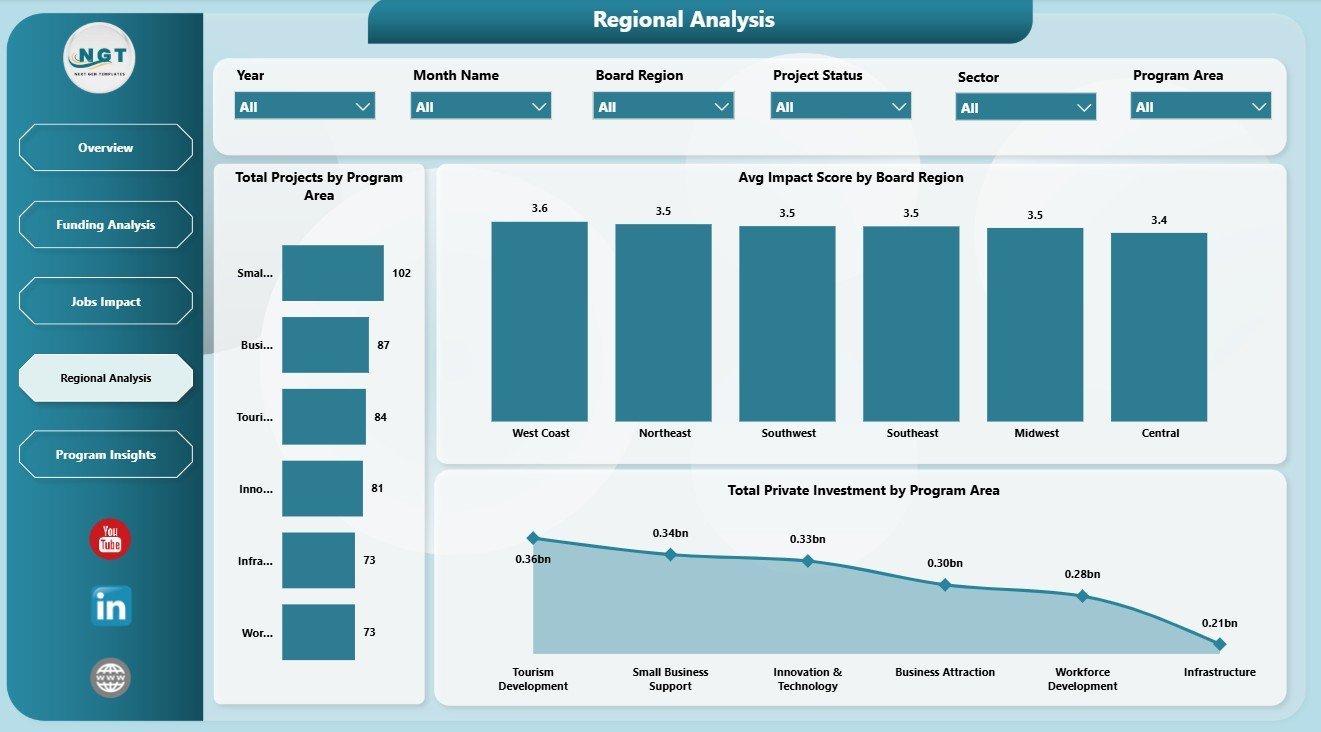
4. Regional Analysis
The Regional Analysis page compares program and regional performance. It includes Total Projects by Program Area, Avg Impact Score by Board Region, and Total Private Investment by Program Area so users can compare delivery, quality, and investment concentration.

Regional Analysis
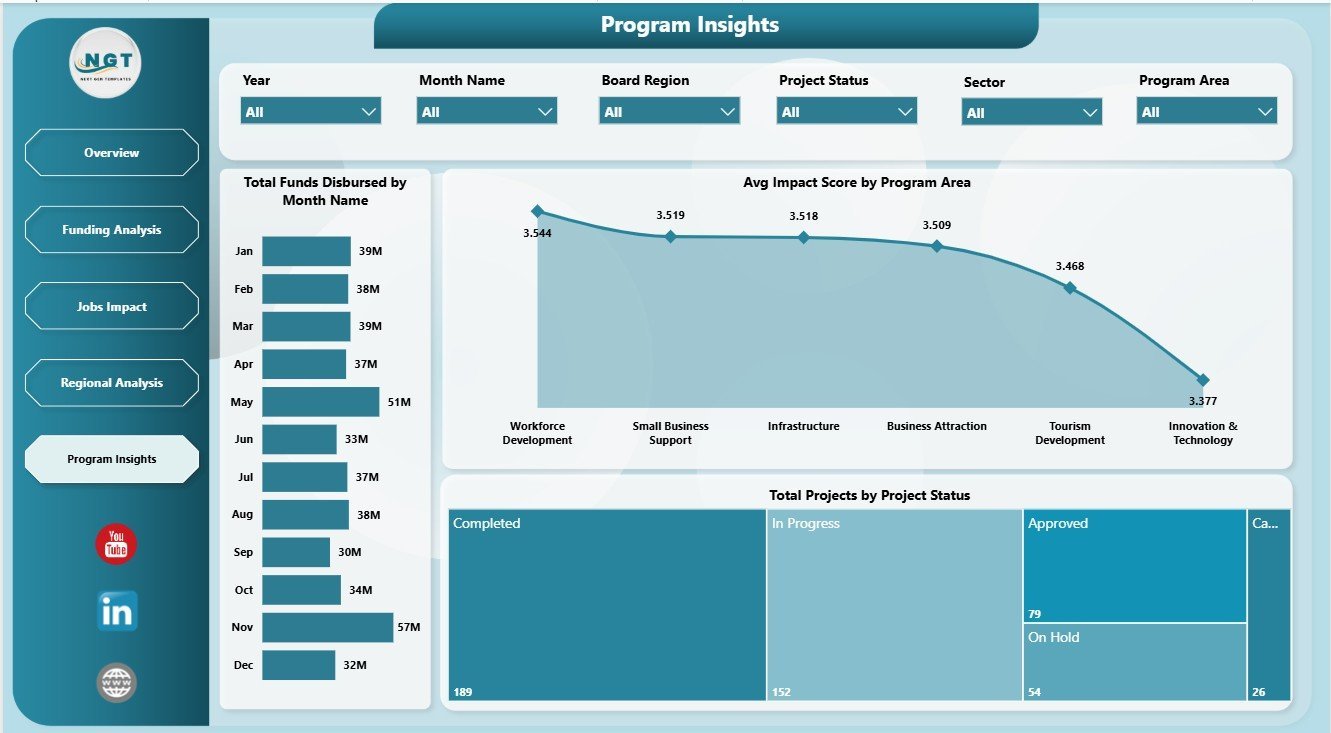
5. Program Insights
The Program Insights page supports program-level reviews. It includes Total Funds Disbursed by Month Name, Avg Impact Score by Program Area, and Total Projects by Project Status for monitoring funding timing, program quality, and active project workload.

Program Insights
Economic Development Boards Dashboard in Power BI vs. Tableau vs. Paid Grant SaaS – Where This Fits
| Feature | This Power BI Dashboard | Tableau or Qlik Alternative | Paid Grant SaaS |
|---|---|---|---|
| Cost | $17.99 one-time | BI license or custom build cost | Recurring subscription or implementation fee |
| Platform | Power BI Desktop / Power BI Service | Separate BI platform setup | Vendor-hosted system |
| Setup time | Open PBIX, replace data, refresh | Build model and report pages | Implementation and onboarding |
| Real-time team collaboration | Available after publishing to Power BI Service | Available with cloud setup | Usually included |
| Customizable fields | Editable report and model | Editable with BI skills | Limited by vendor settings |
| Share with link | Possible through Power BI permissions | Possible through cloud permissions | Usually login controlled |
| Year-1 cost at 5 users | $17.99 plus any Microsoft licensing | Usually much higher | Often hundreds or thousands |
| Economic development metrics | Built in across 5 pages | Must be designed | Depends on plan or module |
Who This Template Is For – and Who It’s Not For
This template is for economic development boards, grant administrators, government analysts, regional development agencies, public-sector consultants, non-profit program managers, and Power BI users who need a reporting layer for grants, jobs, investment, disbursement, sectors, regions, and program outcomes.
It is not a grant application portal, payment processor, workflow approval system, accounting system, or compliance case-management platform. Use it as an analytics dashboard after your source data is prepared for Power BI.
How to Use the Economic Development Boards Dashboard in Power BI
- Download and unzip the purchased file.
- Open the PBIX file in Power BI Desktop.
- Replace the sample data or connect your approved economic development data source.
- Refresh the report to update cards, charts, slicers, and pages.
- Use slicers to filter by board region, program area, funding source, sector, month, and project status.
- Customize visuals, fields, colors, and measures as needed before publishing or presenting.
Real-World Use Cases
Priya, regional board analyst: Priya uses the Overview and Regional Analysis pages before board meetings to explain project volume, funds disbursed, private investment, and jobs created by region.
Michael, grant program manager: Michael reviews Funding Analysis to find sectors or board regions where disbursement rates are lower than expected.
Sofia, economic policy consultant: Sofia uses Jobs Impact and Program Insights to prepare client-ready reports on job creation, business assistance, program impact score, and project status.
Frequently Asked Questions
Do I need Power BI Desktop?
Yes. Open the PBIX file in Power BI Desktop, which is the main Microsoft authoring tool for Power BI reports.
Can I use my own data?
Yes. Replace the sample data or connect your approved source, then refresh the report to update all pages.
What pages are included?
The dashboard includes Overview, Funding Analysis, Jobs Impact, Regional Analysis, and Program Insights.
Can I customize the charts?
Yes. You can edit visuals, fields, measures, colors, labels, slicers, and report pages in Power BI Desktop.
Is this a grant management system?
No. It is a Power BI reporting dashboard, not an application portal, approval workflow, payment tool, or compliance system.
Can I share it with my team?
Yes, if your Microsoft licensing and permissions allow publishing through Power BI Service. Review your data governance rules before sharing.
About the Author
Built by PK – Microsoft Certified Professional with 15+ years of Excel, Google Sheets, and Power BI experience. Founder of NextGenTemplates, reaching 300K+ subscribers across YouTube channels. Every template is hand-built and tested before release.
Explore Related Templates
Browse more Power BI templates and Power BI Dashboard templates. Related templates include Economic Development Boards Dashboard in Excel, Economic Development Boards KPI Dashboard in Excel, Eco Lodges Dashboard in Power BI, and Digital Curriculum Startups Dashboard in Power BI.
Read the detailed blog post
Economic Development Boards Dashboard in Power BI Template
Download the Economic Development Boards Dashboard in Power BI to turn grant, jobs, investment, and regional performance data into a focused Power BI report for board reviews.
Last updated: June 6, 2026.


Reviews
There are no reviews yet.