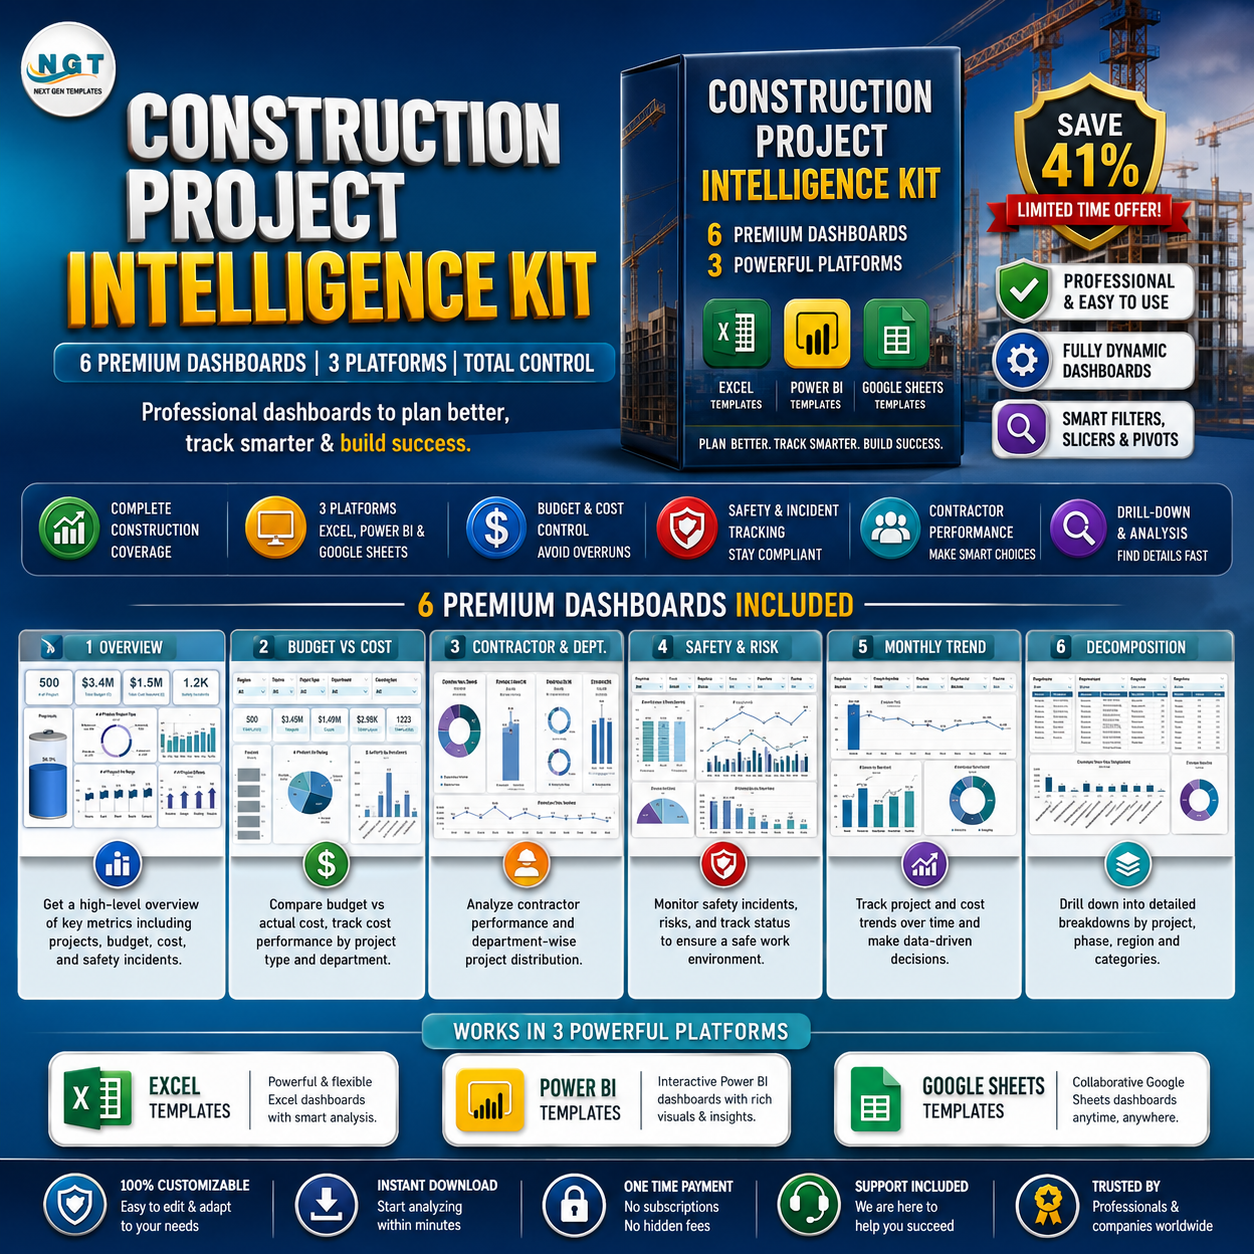


Stop juggling six disconnected spreadsheets, a Power BI file, and a pile of status emails. The Construction Project Intelligence Kit bundles 6 premium construction dashboards across Excel, Power BI, and Google Sheets into one pack so you can track budgets, costs, safety incidents, progress, and contractor performance across every project — whatever tool your team already lives in. Buy the kit for a one-time $49.99 instead of $84.94 separately and pocket the $34.95 saving (about 41% off, and roughly 61% off the $128.94 full retail total).
🔑 Key Features of the Construction Project Intelligence Kit
- 🏗️ Full Construction Coverage – portfolio dashboards, KPI dashboards, and a dedicated safety dashboard in a single bundle.
- 🖥️ Three Platforms, One Kit – Excel, Power BI, and Google Sheets versions so every stakeholder can open the format they prefer.
- 💰 Budget vs Cost Control – spot overruns by department, region, contractor, and project type before they hit the owner’s invoice.
- 🦺 Safety & Incident Tracking – a purpose-built Construction Safety KPI dashboard for incident rates, training, and audits.
- 📈 Progress & Timeline Visibility – monitor phases, milestones, and resource allocation across multiple sites.
- 👷 Contractor Performance – rank your top contractors by project count and budget for smarter award decisions.
- 🔍 Drill-Down & Search – Power BI decomposition views plus Google Sheets keyword search tabs.
- 🔄 Plug-and-Play – enter your project data once and every chart, card, and pivot updates automatically.
- ⚙️ Fully Customizable – rebrand colours, add KPIs, and extend the data sheets to match your workflow.
- 💵 One-Time Price, No Subscriptions – own all six templates for life with no per-seat fees.
📦 What’s Inside the Construction Project Intelligence Kit
- Construction Dashboard in Power BI – a 6-page Power BI report with overview cards, budget vs cost, contractor & department insights, safety & risk, monthly trends, and a decomposition drill-down view.
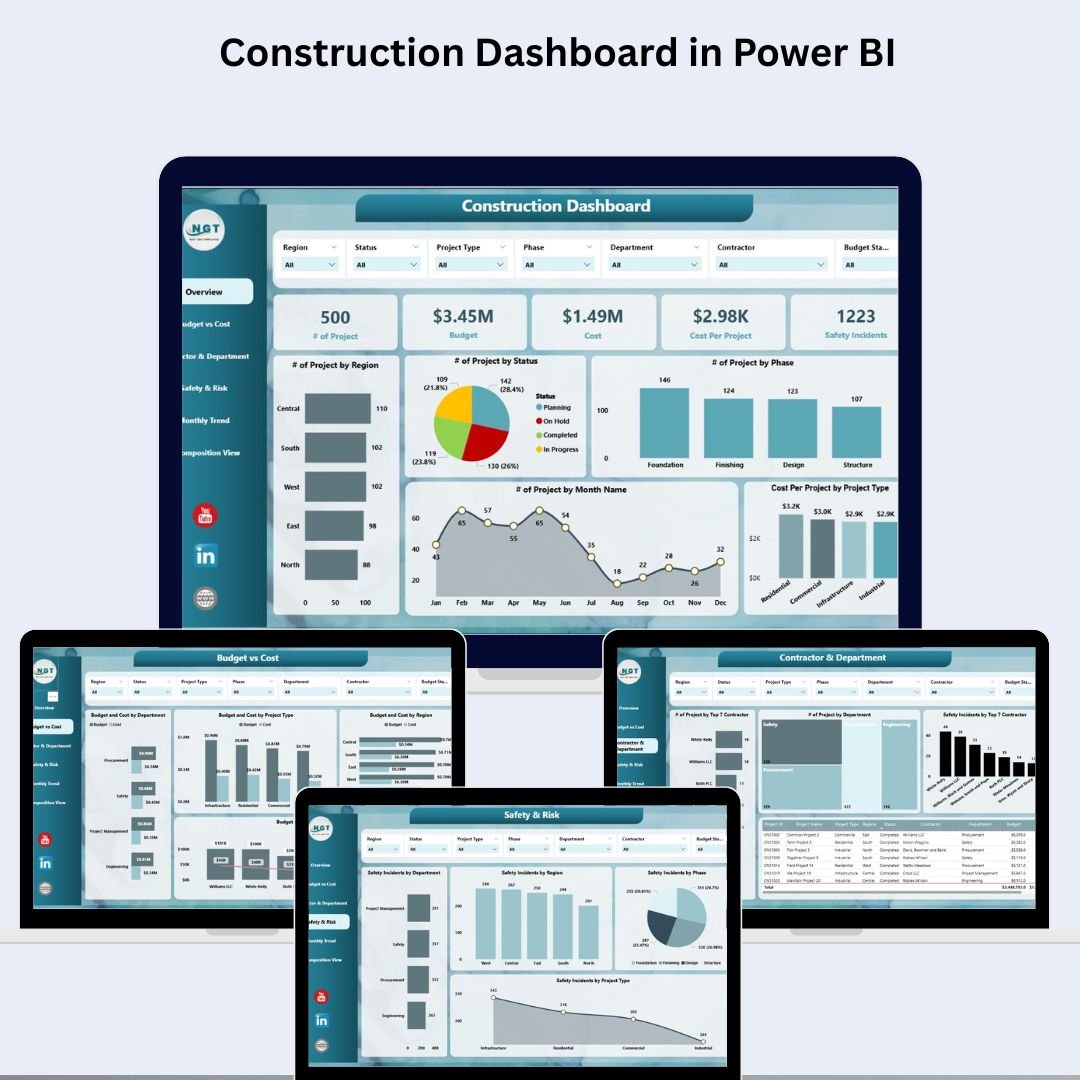
Construction Dashboard in Power BI
- Construction Dashboard in Excel – six connected Excel sheets (Overview, Budget vs Cost, Progress, Contractor, Safety, and a Data tab) that turn one data sheet into an interactive project command centre.
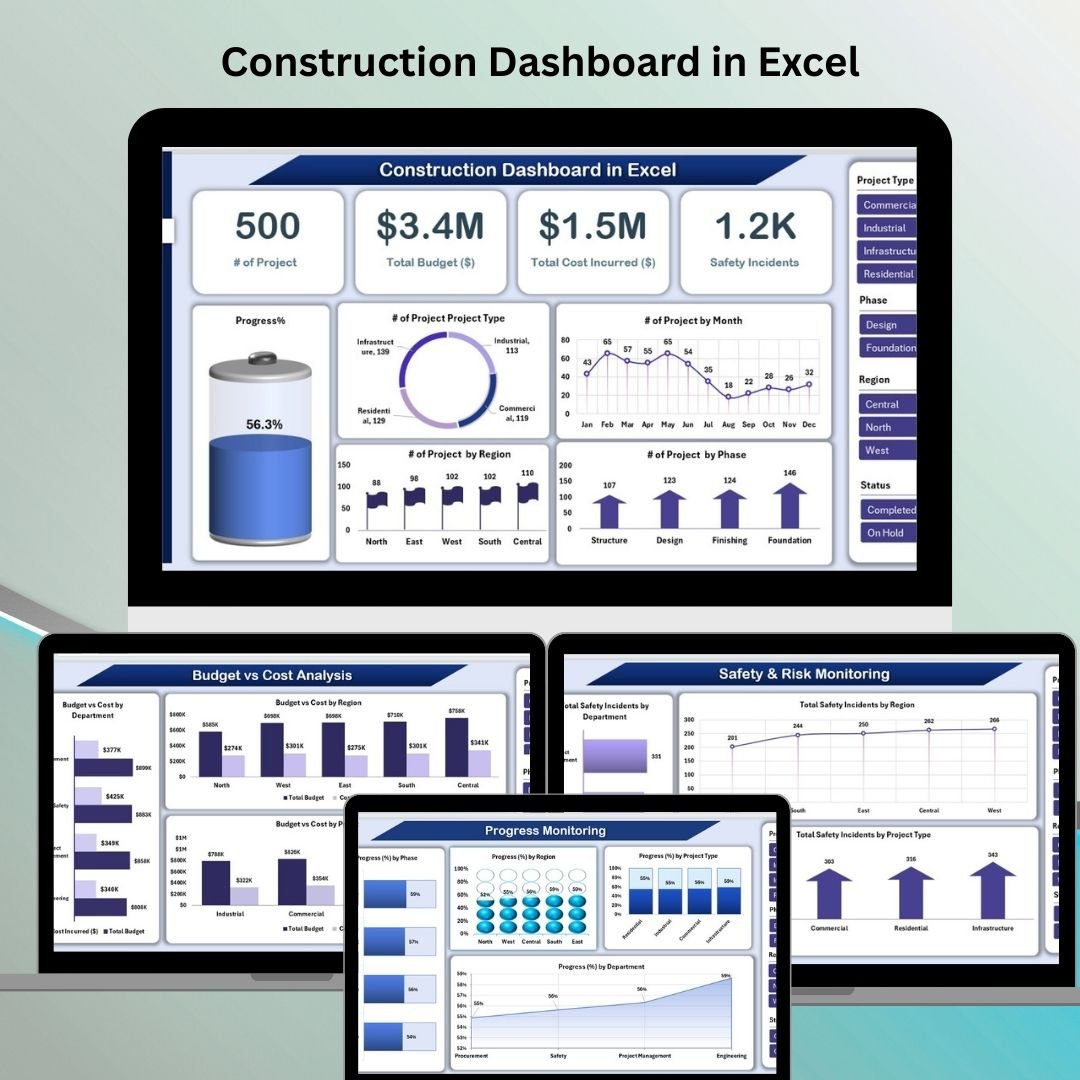
Construction Dashboard in Excel
- Construction Safety KPI Dashboard in Excel – a focused safety dashboard tracking incident rates, lost-time injuries, near misses, training completion, and audit compliance.

Construction Safety KPI Dashboard in Excel
- Construction KPI Dashboard in Google Sheets – a cloud-ready KPI tracker for project progress, budget management, resource allocation, and safety, perfect for collaborative teams.

Construction KPI Dashboard in Google Sheets
- Construction KPI Dashboard in Excel – an interactive Excel KPI dashboard covering project timelines, budget vs actual, labour productivity, and safety metrics with dynamic charts.
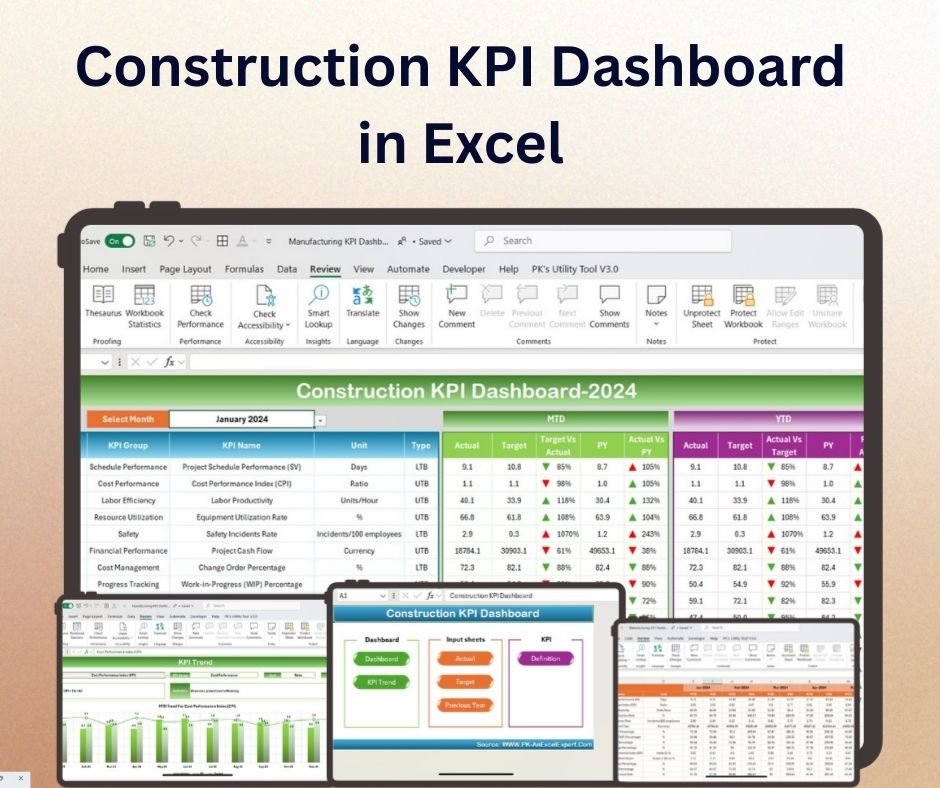
Construction KPI Dashboard in Excel
- Construction Dashboard in Google Sheets – a Google Sheets command centre with KPI cards, charts by region/phase/department, a keyword search tab, and an editable data sheet.
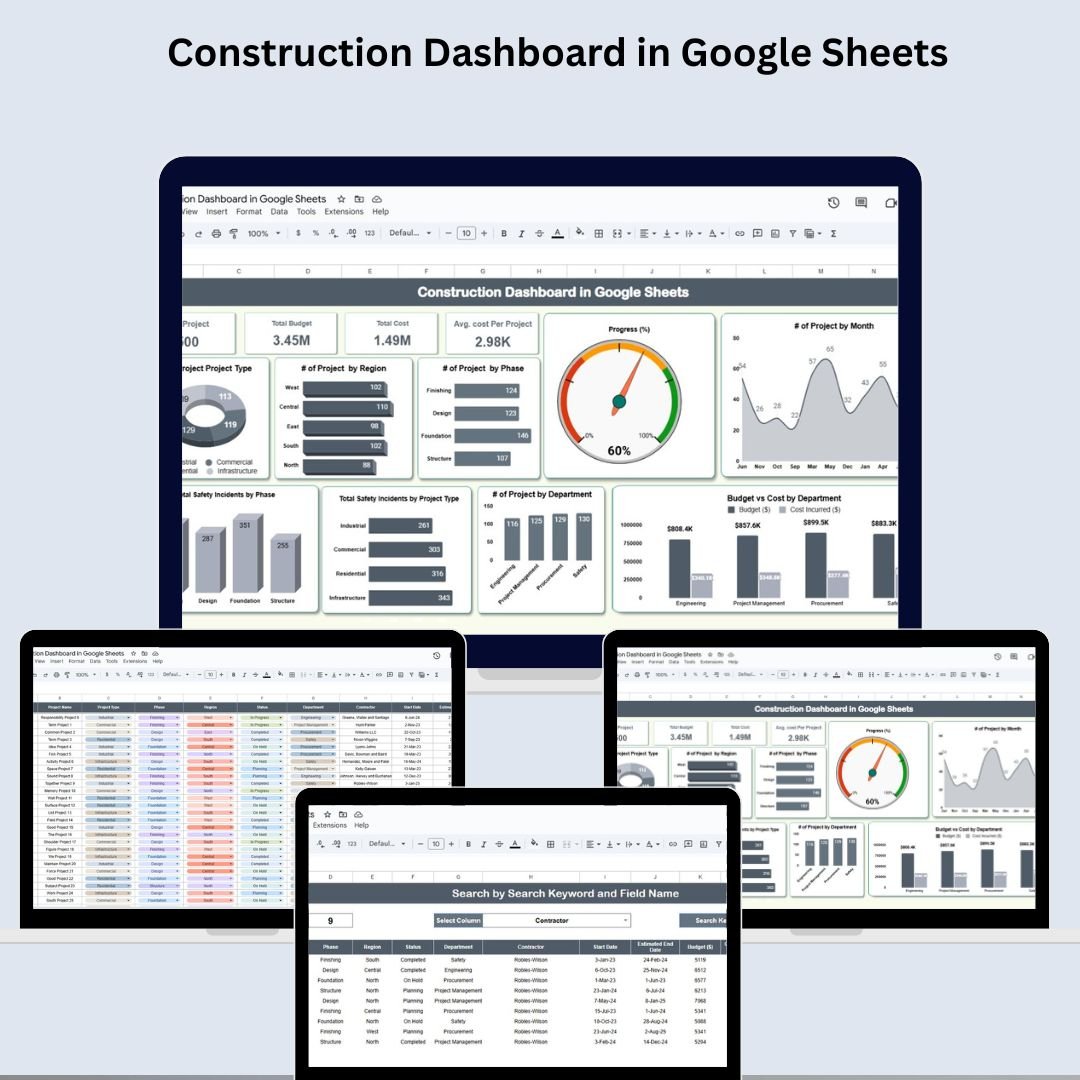
Construction Dashboard in Google Sheets
💡 Smart Comparison — Individual vs Bundle
| Buying Individually | 🏗️ Construction Project Intelligence Kit | |
|---|---|---|
| Templates included | Pay per template | ✅ All 6 in one purchase |
| Platforms | Buy each format separately | ✅ Excel + Power BI + Google Sheets |
| Price | $84.94 (sale) / $128.94 (regular) | ✅ $49.99 one-time |
| You save | — | ✅ $34.95 (~41% off) |
| Best value | ❌ | ✅ Yes |
📊 Product Breakdown
| # | Template | Platform | Individual Price |
|---|---|---|---|
| 1 | Construction Dashboard in Power BI | Power BI | $17.99 |
| 2 | Construction Dashboard in Excel | Excel | $17.99 |
| 3 | Construction Safety KPI Dashboard in Excel | Excel | $12.99 |
| 4 | Construction KPI Dashboard in Google Sheets | Google Sheets | $12.99 |
| 5 | Construction KPI Dashboard in Excel | Excel | $12.99 |
| 6 | Construction Dashboard in Google Sheets | Google Sheets | $9.99 |
| Individual Total | $84.94 | ||
| Bundle Price | $49.99 | ||
⚙️ How to Use the Construction Project Intelligence Kit
- Download the bundle – unzip the pack to find all six templates ready to open.
- Pick your platform – open the Excel, Power BI, or Google Sheets file your team uses.
- Enter your project data – add projects, budgets, costs, phases, contractors, and incidents into the Data sheet.
- Watch it update – KPI cards, charts, and pivots refresh automatically.
- Share & customise – send to stakeholders, rebrand colours, and add your own KPIs as needed.
👥 Who Can Benefit from This Kit
- 🏗️ General Contractors & Construction Project Managers
- 🧑💼 Specialty & Civil Contractors managing multiple sites
- 🏢 Real Estate Developers & Owner PMOs
- 🧾 Finance, Procurement & Cost Controllers
- 🦺 Safety Officers & EHS Managers
- 📈 Site Supervisors & Engineering Teams
🏗️ Get All 6 Construction Dashboards for One Low Price
Individual total $84.94 → Bundle $49.99
You save $34.95 (~41% off)
📖 Click here to read the detailed Construction Project Intelligence Kit guide on our blog
📺 Watch step-by-step dashboard tutorials on our YouTube channel: youtube.com/@PKAnExcelExpert


Reviews
There are no reviews yet.