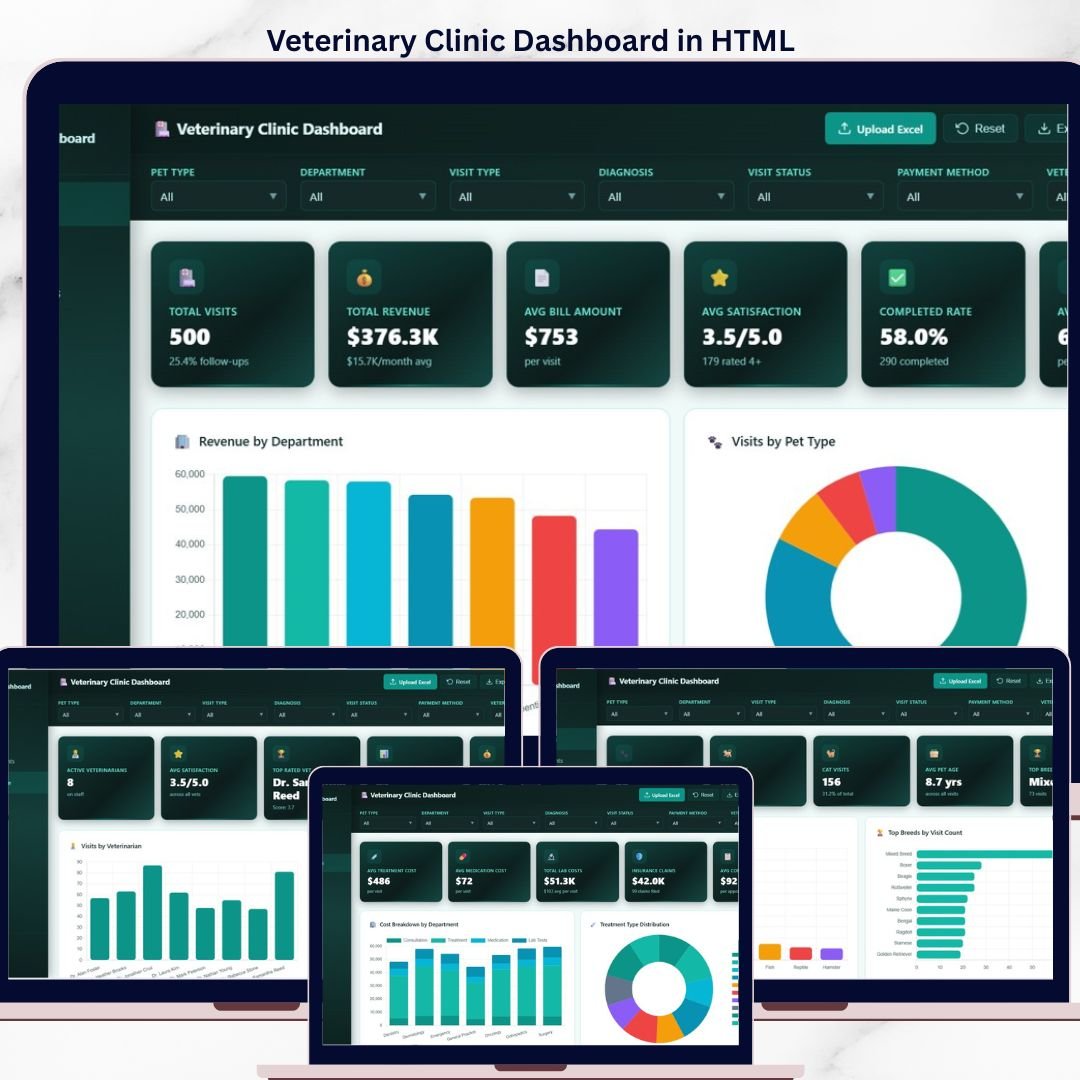
Bring your veterinary practice to life with the Veterinary Clinic Dashboard in HTML — a fully interactive, browser-based analytics template built to help vet clinics, animal hospitals, and pet care practices track visits, revenue, patient data, treatments, and veterinarian performance in one beautifully designed workspace. This single-file HTML dashboard runs in any modern browser, needs zero installation, and delivers a real-time, SaaS-style view of every important clinic metric. Whether you run a small neighborhood animal clinic or a multi-doctor veterinary hospital, this template gives you the clarity to make confident, data-driven decisions.
Built using clean HTML, CSS, and JavaScript, this HTML dashboard template is lightweight, mobile-friendly, and easy to host anywhere — your website, internal portal, or a local machine. It is the perfect alternative when you want a polished dashboard without relying on Excel, Power BI, or Google Sheets.
Overview
🔑 Key Features of Veterinary Clinic Dashboard in HTML
The Veterinary Clinic Dashboard in HTML tracks 6 core KPIs and 20+ charts across 5 interactive pages, giving clinic owners, office managers, and veterinarians a full operational view of their practice.
🐾 Single-file HTML dashboard – open index.html in any modern browser (Chrome, Edge, Firefox, Safari) and the dashboard runs instantly with no setup.
📊 6 KPI cards at the top – Total Visits, Total Revenue, Avg Bill Amount, Avg Satisfaction, Completed Rate, and Avg Visit Duration.
🎚️ Interactive slicers and filters – slice data by date, pet type, department, veterinarian, and more to see instant filtered views.
📈 5 analytical pages covering Overview, Patient Analysis, Treatment Insights, Vet Performance, and a full Data View with search, sort, pagination, and CSV export.
🐕 Pet-level analytics – track visits by pet type, top breeds, age distribution, and diagnosis patterns.
💉 Treatment and cost intelligence – visualize cost by department, treatment type, payment methods, and diagnosis categories.
🩺 Vet performance tracking – compare each veterinarian by visits handled, satisfaction rating, revenue generated, and duration per visit.
📱 Responsive design – works beautifully on desktops, tablets, and mobile phones.
📦 What’s Inside the Veterinary Clinic Dashboard in HTML
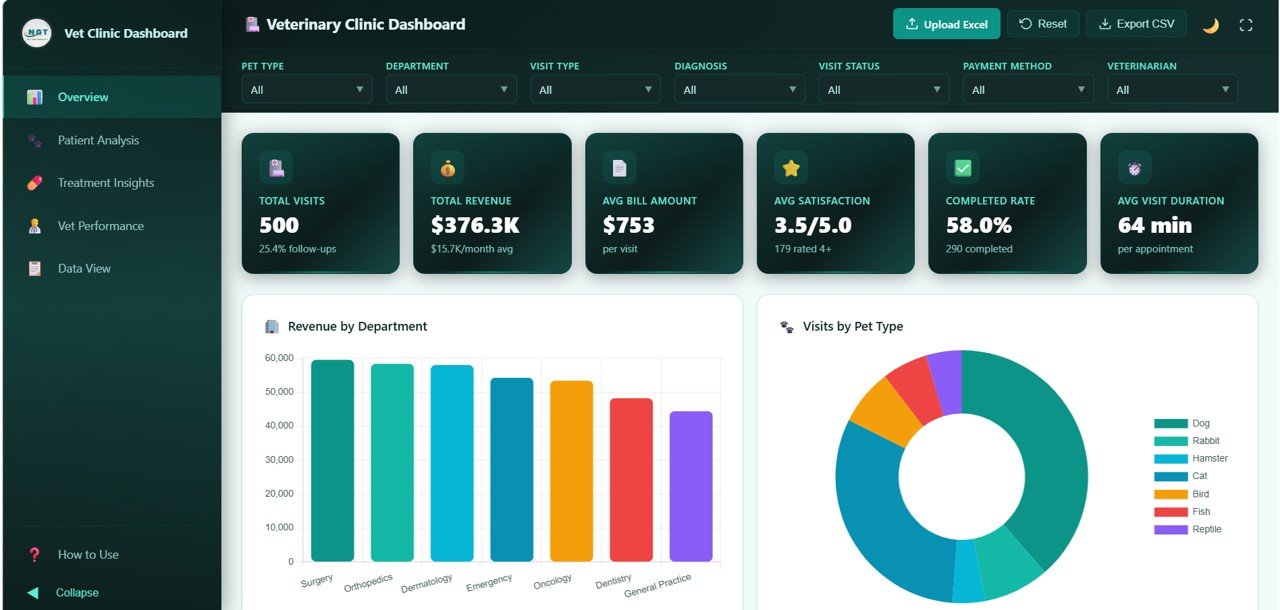
1 — Overview Page
At the top of the overview page are 6 KPI cards showing high-level clinic metrics: Total Visits, Total Revenue, Avg Bill Amount, Avg Satisfaction, Completed Rate, and Avg Visit Duration. Below the cards, multiple slicers let you filter the dashboard instantly. Five charts explain the full picture of your practice:
🔹 Revenue by Department – shows which departments (surgery, general checkup, vaccination, etc.) contribute most to total revenue.
🔹 Visits by Pet Type – quickly see the mix of dogs, cats, birds, and exotic pets visiting the clinic.
🔹 Visit Status Distribution – breakdown of completed, cancelled, rescheduled, and no-show visits.
🔹 Monthly Revenue Trend – spot seasonal trends, peaks, and revenue growth over time.
🔹 Top Diagnosis Categories – see which health conditions drive the most clinic visits.
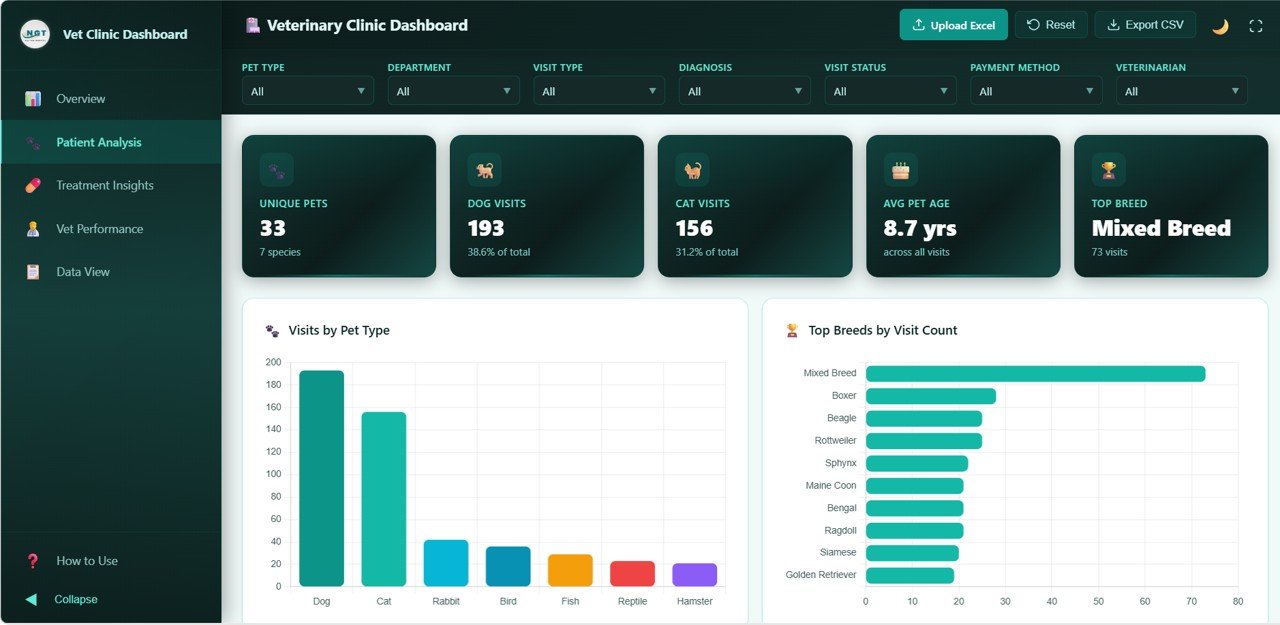
2 — Patient Analysis
Patient Analysis
The Patient Analysis page gives you a deep look into your pet patients with these charts:
🔹 Visits by Pet Type – total visit counts for dogs, cats, and other species.
🔹 Top Breeds by Visit Count – identify the most frequently visiting breeds.
🔹 Pet Age Distribution – see how young, adult, and senior pets are distributed.
🔹 Pet Type by Visit Type – understand which pets come in for checkups, emergencies, vaccinations, or surgery.
🔹 Diagnosis by Pet Type – discover which conditions are common across each species.
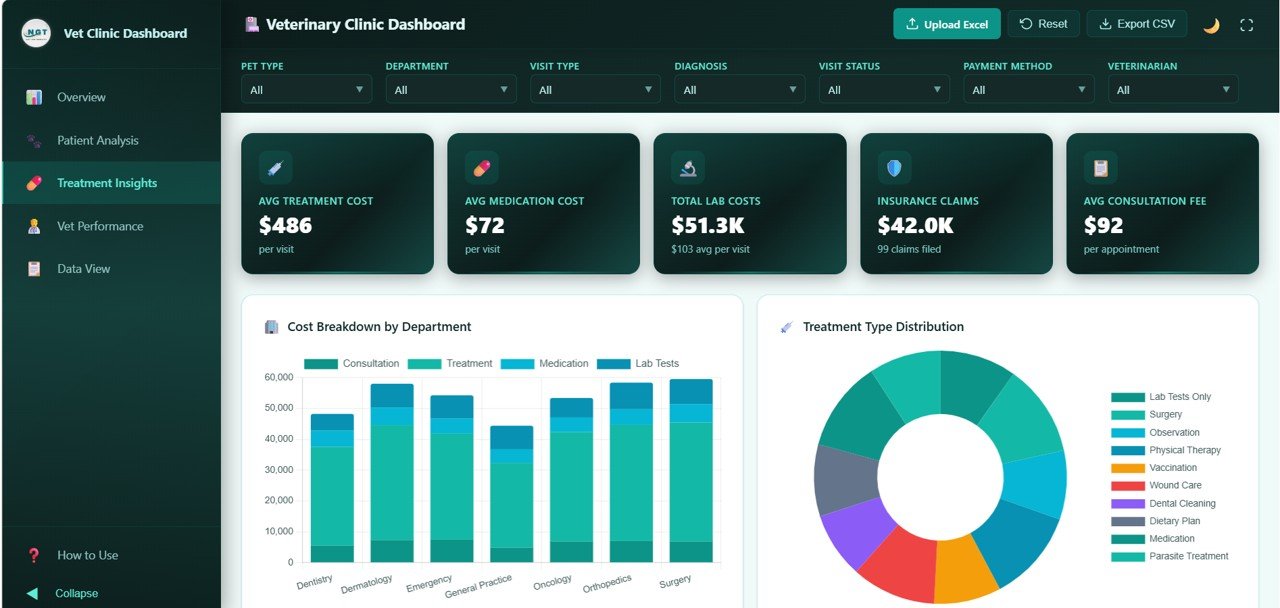
3 — Treatment Insights
Treatment Insights
The Treatment Insights page focuses on clinical and financial decisions:
🔹 Cost Breakdown by Department – compare costs across clinical departments.
🔹 Treatment Type Distribution – see the mix of treatments being delivered.
🔹 Diagnosis Category Distribution – top clinical categories handled by the clinic.
🔹 Average Cost by Treatment Type – benchmark pricing for each treatment service.
🔹 Payment Method Distribution – breakdown of cash, card, insurance, and other payment methods.
4 — Vet Performance
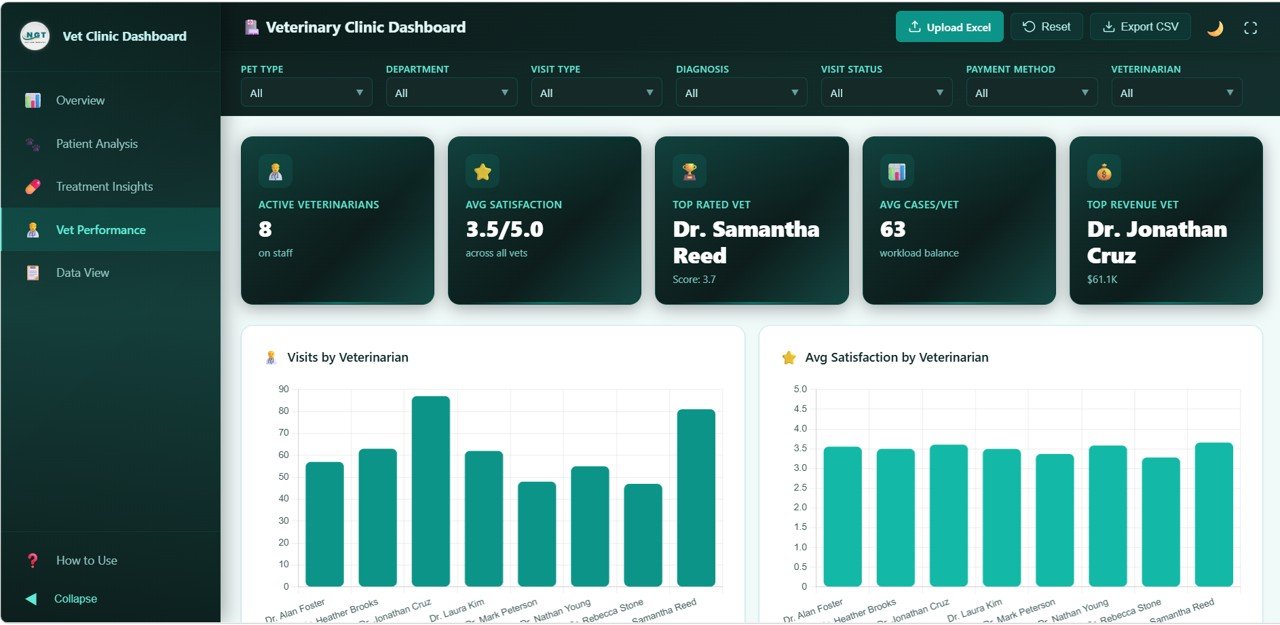
Vet Performance
Track how each veterinarian is performing:
🔹 Visits by Veterinarian – total case volume per vet.
🔹 Avg Satisfaction by Veterinarian – pet-owner satisfaction per vet.
🔹 Revenue by Veterinarian – revenue contribution of each vet.
🔹 Avg Visit Duration by Veterinarian – measure consultation efficiency.
🔹 Department Distribution by Veterinarian – see which specialties each vet handles most.
5 — Data View
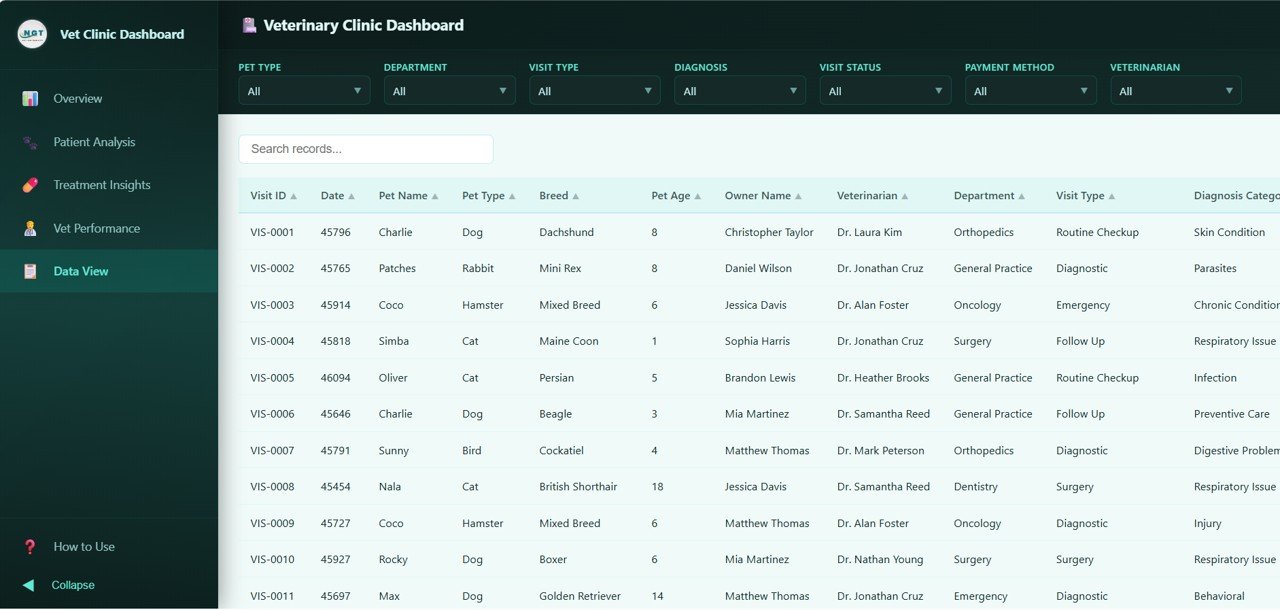
Data View tab
The Data View is a detailed table of every clinic record. Use the built-in search bar, column sort, and pagination to quickly find specific visits, and export filtered data to CSV in one click.
⚙️ How to Use the Veterinary Clinic Dashboard in HTML
1. Download and unzip the HTML dashboard package.
2. Open index.html in any modern browser — Chrome, Edge, Firefox, or Safari.
3. Replace the sample data in the included data file with your own clinic records.
4. Refresh the browser — all KPIs, charts, and tables update automatically.
5. Use the slicers and filters on each page to explore your data.
6. Export the Data View to CSV any time you need a raw record file.
👥 Who Can Benefit from This Veterinary Clinic Dashboard in HTML
🐾 Veterinary clinic owners and practice managers
🐾 Animal hospitals tracking multiple vets and specialties
🐾 Pet care centers, grooming clinics, and boarding facilities
🐾 Veterinary students and educators building case studies
🐾 Data analysts working with healthcare or pet-care organizations
🐾 Developers who want a ready-made HTML dashboard template for their own veterinary software
If you prefer a different platform, explore our Veterinary Clinic Dashboard in Excel, Veterinary Clinic Dashboard in Google Sheets, or Veterinary Clinic Dashboard in Power BI — all available on NextGenTemplates.com.
❓ Frequently Asked Questions
What is the Veterinary Clinic Dashboard in HTML?
The Veterinary Clinic Dashboard in HTML is an interactive, browser-based analytics template that tracks visits, revenue, patient demographics, treatments, diagnoses, and vet performance across 5 pages. It runs locally in any modern browser and needs no software installation.
How many KPIs and charts does the Veterinary Clinic Dashboard in HTML include?
This HTML dashboard includes 6 KPI cards (Total Visits, Total Revenue, Avg Bill Amount, Avg Satisfaction, Completed Rate, Avg Visit Duration) and 20+ charts distributed across the Overview, Patient Analysis, Treatment Insights, and Vet Performance pages.
Do I need coding skills to use this veterinary HTML dashboard?
No. You simply open index.html in a browser and replace the sample data in the data file with your own. The dashboard auto-updates without any code changes. Basic HTML knowledge helps only if you want to customize the design.
Can I export the data from the Veterinary Clinic Dashboard in HTML?
Yes. The Data View page includes a CSV export button that exports any filtered or sorted records to a downloadable CSV file.
Is this HTML dashboard compatible with mobile and tablet devices?
Yes. The Veterinary Clinic Dashboard in HTML uses a responsive design that works on desktops, tablets, and mobile phones.
Where can I find similar HTML dashboard templates?
Browse more options in our HTML Dashboard Templates collection on NextGenTemplates.com.
🔗 Explore Related Templates
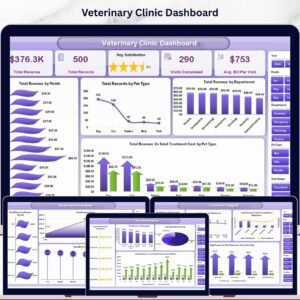
🔹 Veterinary Clinic Dashboard in Excel – Same insights as this HTML version but in Excel with pivot-based charts.
🔹 Veterinary Clinic Dashboard in Power BI – A Power BI version with DAX-powered KPIs.
🔹 Veterinary Clinic KPI Scorecard in Excel – Monthly MTD/YTD scorecard for vet clinic performance.
🔹 Event Management Analysis Dashboard in HTML – Another interactive HTML dashboard from the same series.
📖 Click here to read the Detailed Blog Post
🎥 Visit our YouTube channel to learn step-by-step video tutorials
👉 YouTube.com/@NextGenTemplates


Reviews
There are no reviews yet.