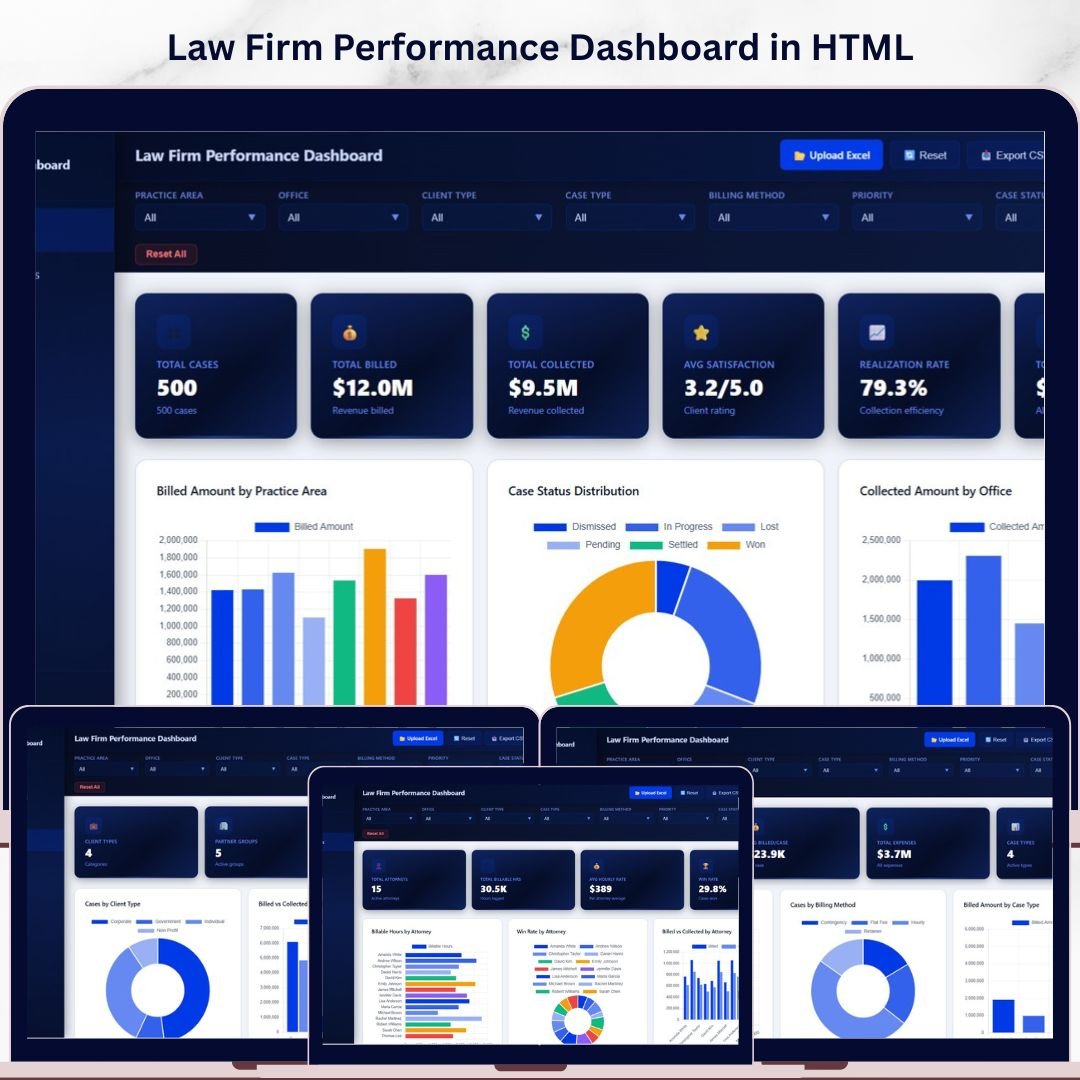
Law Firm Performance Dashboard in HTML is a professionally designed, browser-based analytics template built for law firms, legal departments, solo practitioners, and corporate counsel teams who need instant visibility into billing, collections, attorney performance, client segmentation, and practice area profitability — all from one sleek, interactive HTML dashboard. This template features 5 interactive pages that transform your raw legal case data into clear, actionable visual insights you can access from any modern web browser without installing any software.
Whether you manage a boutique litigation firm or a large corporate legal department, this dashboard delivers instant clarity on realization rates, billed vs collected amounts, attorney win rates, and client type analysis. Simply open the HTML file in your browser, replace the sample data, and watch every chart and KPI update automatically. If you prefer spreadsheets, check out the Law Firm Performance Dashboard in Excel for a pivot-powered alternative.
🔑 Key Features of the Law Firm Performance Dashboard in HTML
📌 5 Interactive Dashboard Pages — Overview, Attorney Analysis, Practice Insights, Client Analysis, and Data View provide a 360-degree view of your law firm operations in a clean, responsive HTML interface.
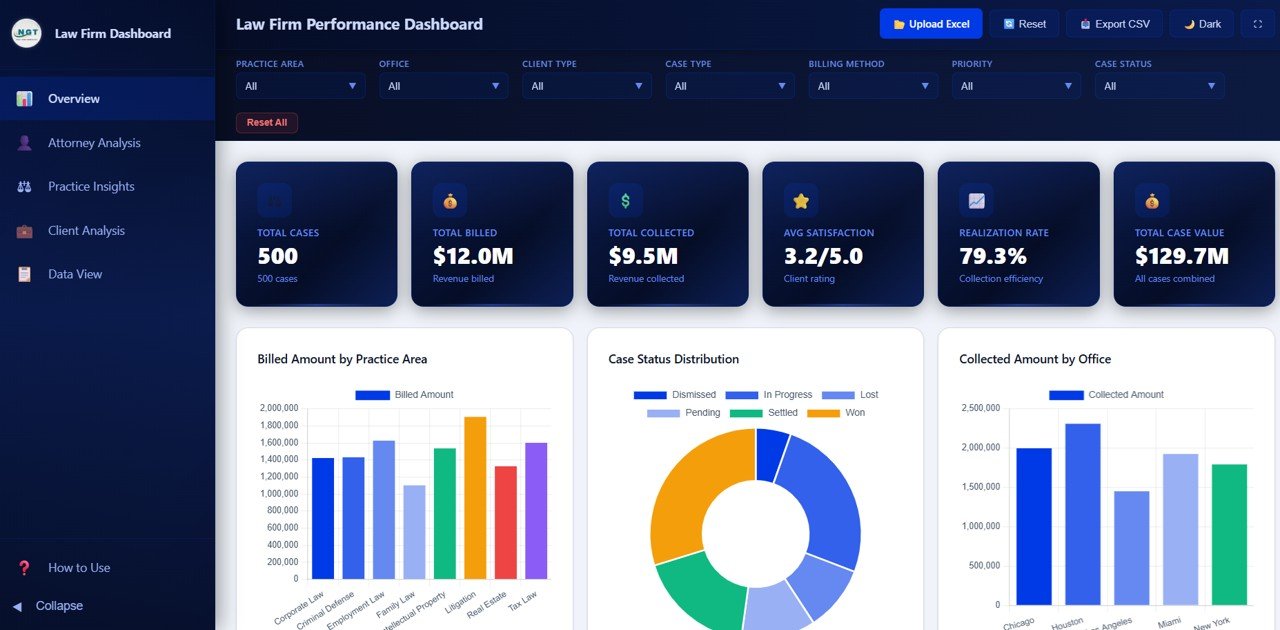
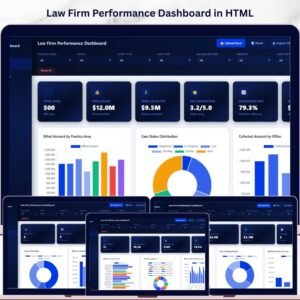
📌 High-Level KPI Cards — The Overview page displays Total Cases, Total Billed, Total Collected, Avg Satisfaction, Realization Rate, and Total Case Value at a glance so you can monitor firm health instantly.
📌 Dynamic Charts and Visuals — Analyze Billed Amount by Practice Area, Case Status Distribution, Collected Amount by Office, Monthly Billing Trend, and Case Value by Priority — all on the Overview page with interactive filtering capabilities.
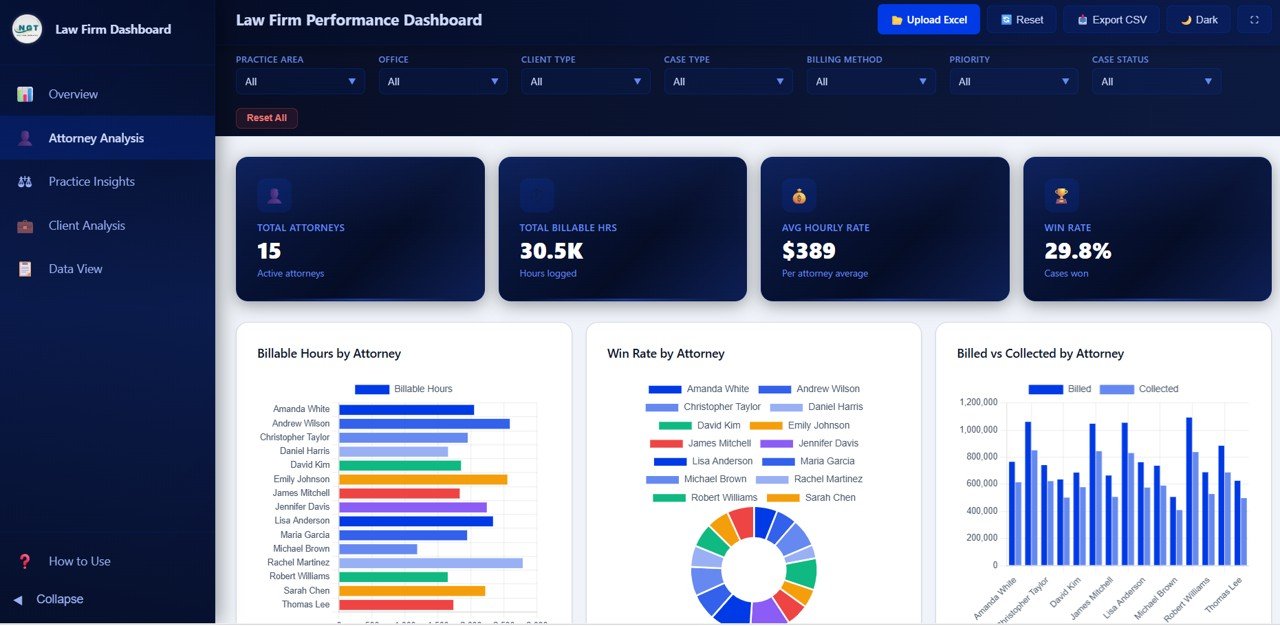
📌 Attorney Analysis Page — Deep dive into Billable Hours by Attorney, Win Rate by Attorney, Billed vs Collected by Attorney, and Satisfaction Score by Attorney to evaluate individual performance and identify top performers in your firm.
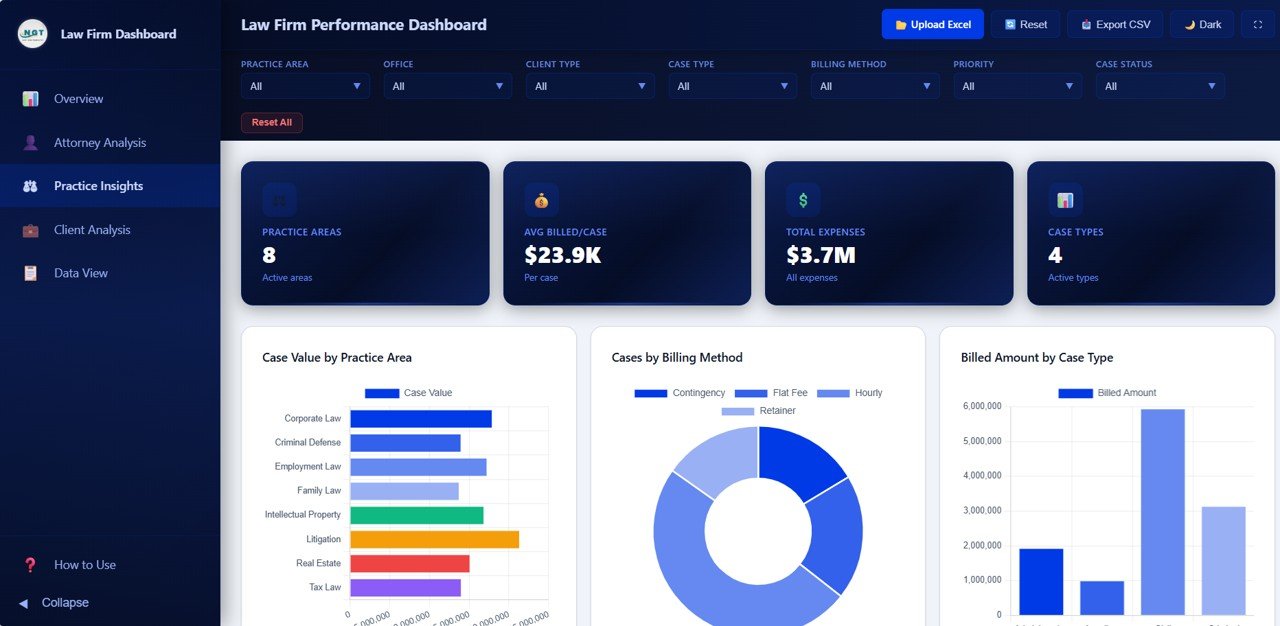
📌 Practice Insights Page — Understand revenue drivers through Case Value by Practice Area, Cases by Billing Method, Billed Amount by Case Type, and Cases by Case Status to optimize your practice area strategy.
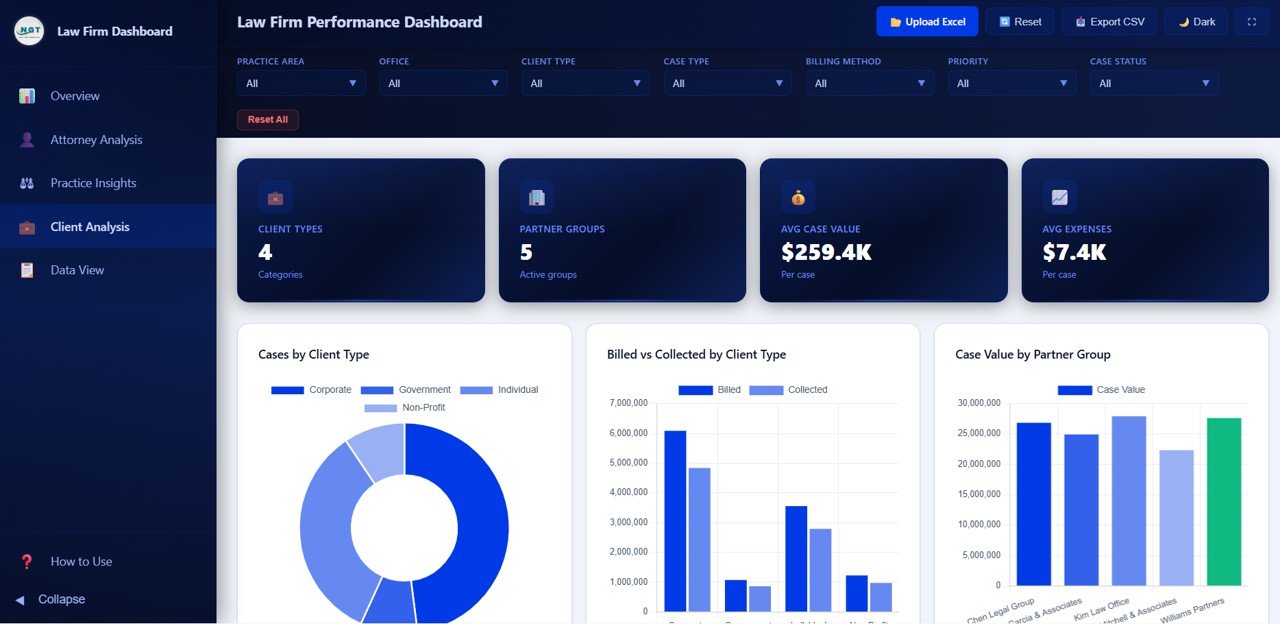
📌 Client Analysis Page — Segment your client base with Cases by Client Type, Billed vs Collected by Client Type, Case Value by Partner Group, and Expenses by Client Type to identify your most profitable client segments.
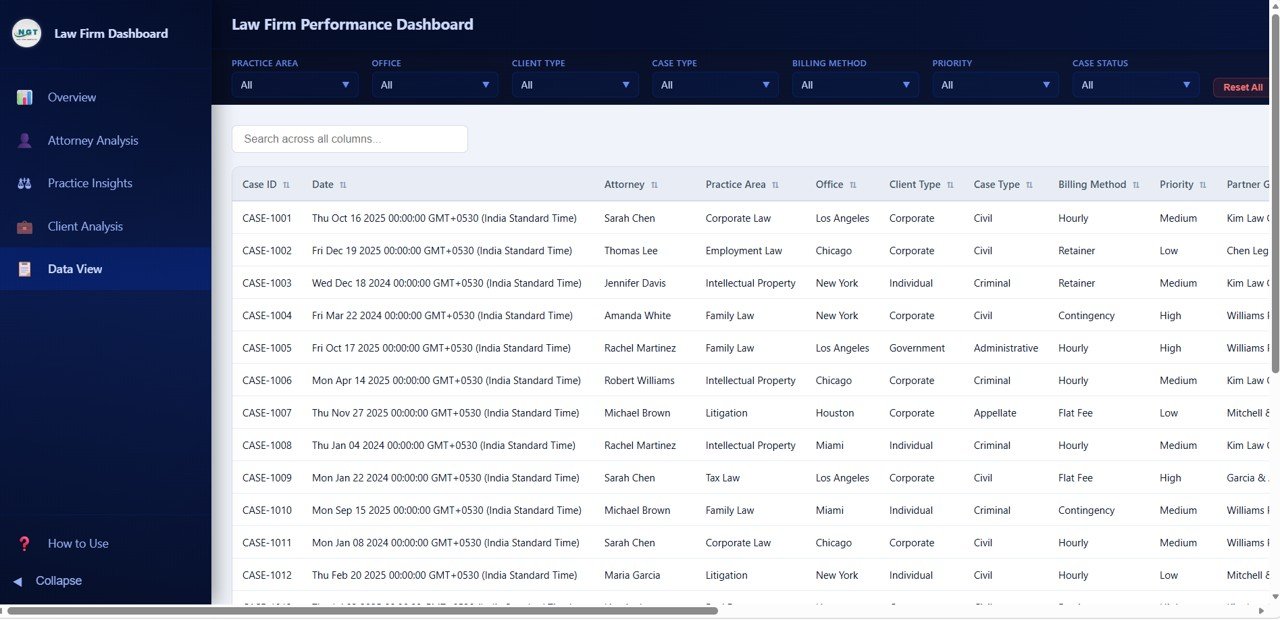
📌 Data View Page — Access all records in a detailed data table with search, sort, and pagination features. Export filtered data to CSV for further analysis or reporting.
📌 Multiple Slicers for Quick Filtering — Apply filters across the dashboard to drill down by practice area, office, client type, attorney, and time period for targeted analysis.
📌 Zero Installation Required — Open in Chrome, Firefox, Edge, or Safari — no software installation, no plugins, no Excel or Power BI license needed.
📦 What’s Inside the Law Firm Performance Dashboard in HTML
This HTML template includes 5 fully designed dashboard pages:
📊 Overview Page — High-level KPI cards (Total Cases, Total Billed, Total Collected, Avg Satisfaction, Realization Rate, Total Case Value) plus charts for Billed Amount by Practice Area, Case Status Distribution, Collected Amount by Office, Monthly Billing Trend, and Case Value by Priority.
📊 Attorney Analysis — Billable Hours by Attorney, Win Rate by Attorney, Billed vs Collected by Attorney, and Satisfaction Score by Attorney for comprehensive attorney performance evaluation.
📊 Practice Insights — Case Value by Practice Area, Cases by Billing Method, Billed Amount by Case Type, and Cases by Case Status for practice-level revenue analysis.
📊 Client Analysis — Cases by Client Type, Billed vs Collected by Client Type, Case Value by Partner Group, and Expenses by Client Type for client segmentation insights.
📊 Data View — A detailed data table page with search, sort, pagination, and CSV export functionality for granular record-level analysis.
⚙️ How to Use the Law Firm Performance Dashboard in HTML
1️⃣ Download and unzip the file to a folder on your computer.
2️⃣ Open the index.html file in any modern web browser (Chrome, Firefox, Edge, or Safari).
3️⃣ Explore the sample data to understand the dashboard structure and all five pages.
4️⃣ Replace the sample data in the data file with your own law firm case records.
5️⃣ Use the interactive filters and slicers to drill down by practice area, attorney, client type, office, or time period.
6️⃣ Export filtered data from the Data View page to CSV for reporting or sharing.
👥 Who Can Benefit from This Law Firm Performance Dashboard in HTML
📌 Managing partners tracking firm-wide billing, collections, and realization rates across offices and practice areas
📌 Law firm administrators monitoring attorney productivity, billable hours, and client satisfaction metrics
📌 Solo practitioners analyzing case profitability, billing method effectiveness, and client type revenue
📌 Legal operations managers evaluating practice area performance and monthly billing trends
📌 Finance teams in corporate legal departments tracking expenses by client type and partner group
📌 Legal consultants providing performance dashboards and benchmarking reports to law firm clients
Explore more analytics solutions in our HTML Dashboard Templates collection.
❓ Frequently Asked Questions
What KPIs does the Law Firm Performance Dashboard in HTML track?
The Law Firm Performance Dashboard in HTML tracks 6 key performance indicators on the Overview page: Total Cases, Total Billed, Total Collected, Avg Satisfaction, Realization Rate, and Total Case Value. Additional analysis pages provide breakdowns by attorney, practice area, client type, billing method, and monthly trends.
Do I need any software to use this HTML dashboard?
No. Simply open the index.html file in any modern web browser such as Chrome, Firefox, Edge, or Safari. No Excel, Power BI, or any other software installation is required.
Can I customize the dashboard with my own data?
Yes. Replace the sample data in the included data file with your own law firm case records. All charts, KPI cards, and visuals update automatically based on the new data.
How many dashboard pages are included in this template?
This template includes 5 interactive pages — Overview, Attorney Analysis, Practice Insights, Client Analysis, and Data View — each designed to provide focused insights into different aspects of law firm operations.
Is this template available in Excel or Power BI?
Yes. NextGenTemplates offers the Law Firm Performance Dashboard in Excel and the Law Firm Performance Dashboard in Power BI as well. Visit our website to explore all available formats.
What is the best HTML dashboard template for tracking law firm performance?
The Law Firm Performance Dashboard in HTML from NextGen Templates is one of the most comprehensive browser-based options available. It covers billing, collections, attorney productivity, practice area revenue, client analysis, and data export across 5 interactive pages with dynamic filtering.
🔗 Explore Related Templates
📌 Law Firm Performance Dashboard in Power BI — The same law firm analytics powered by Power BI with interactive slicers and DAX-driven visuals.
📌 Law Firm Performance Dashboard in Excel — Pivot-powered law firm analytics in Excel with automatic refresh and slicer filtering.
📌 Arbitration and Mediation Dashboard in Excel — Track dispute resolution cases, claim amounts, and settlement outcomes.
📖 Click here to read the Detailed Blog Post
🎥 Visit our YouTube channel to learn step-by-step video tutorials
👉 YouTube.com/@NextGenTemplates
Watch the step-by-step video tutorial:
YouTube


Reviews
There are no reviews yet.