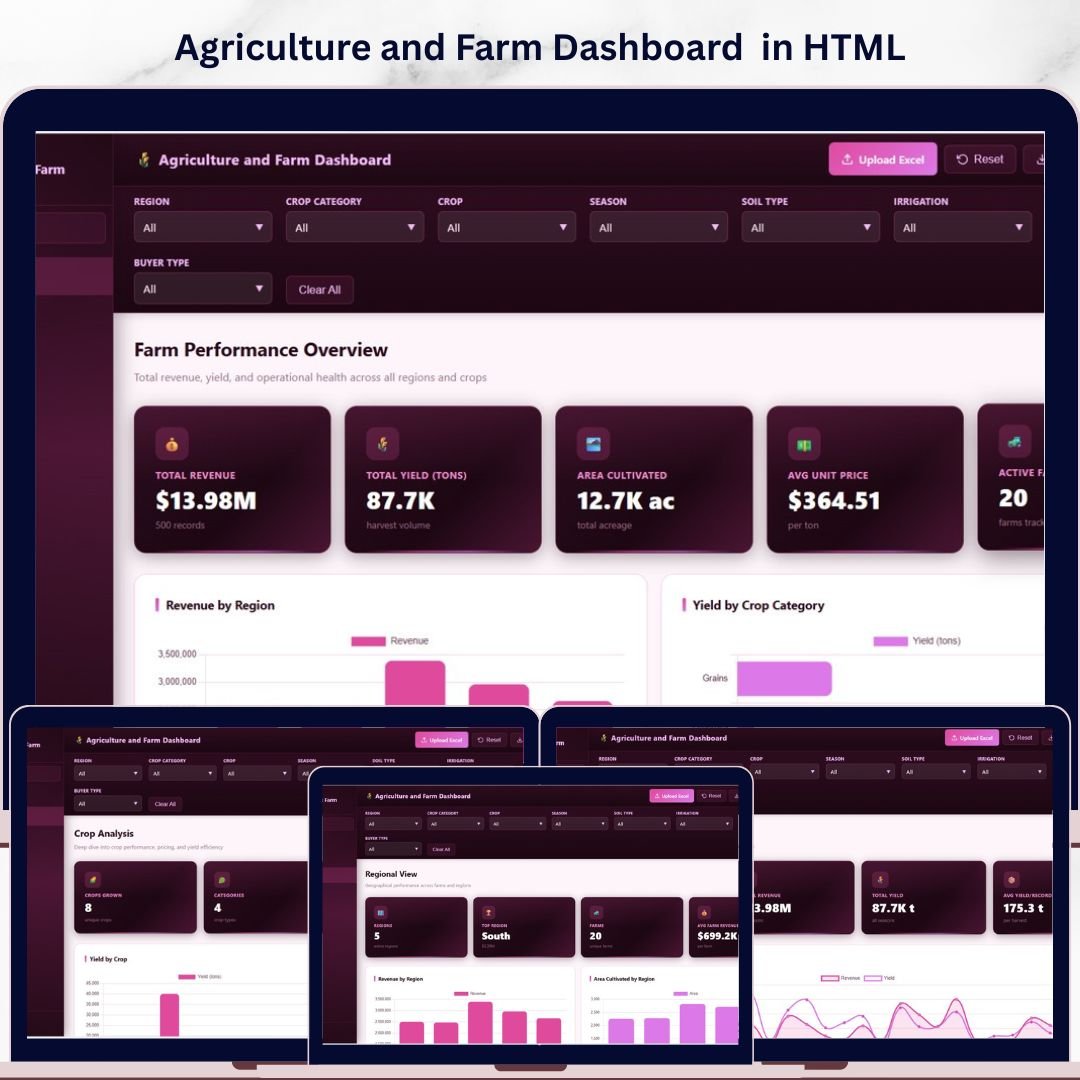

Agriculture and Farm Dashboard in HTML is a modern, interactive analytical tool built for farm owners, agronomists, and agribusiness managers who need to track revenue, yield, area cultivated, pricing, and seasonal performance across multiple farms, regions, and crops in a single unified view. Instead of juggling disconnected spreadsheets and reports, this HTML dashboard template brings all your critical agricultural metrics together in beautifully designed interactive pages that work directly in any web browser with zero installation required.
🔑 Key Features of Agriculture and Farm Dashboard in HTML
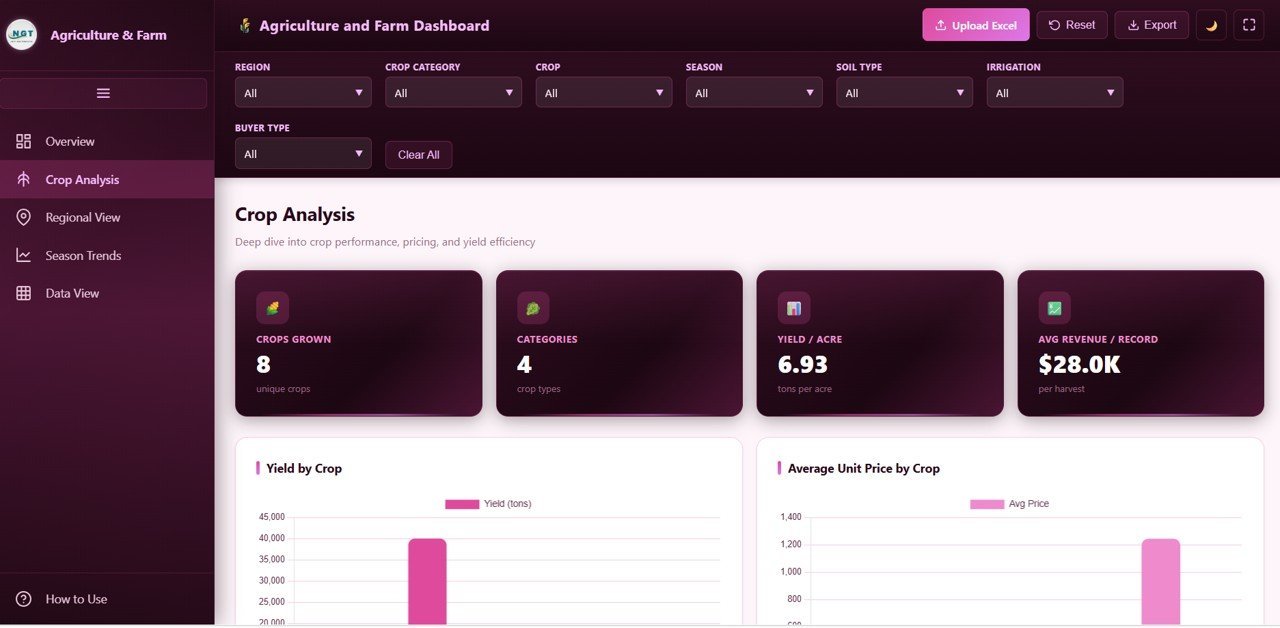
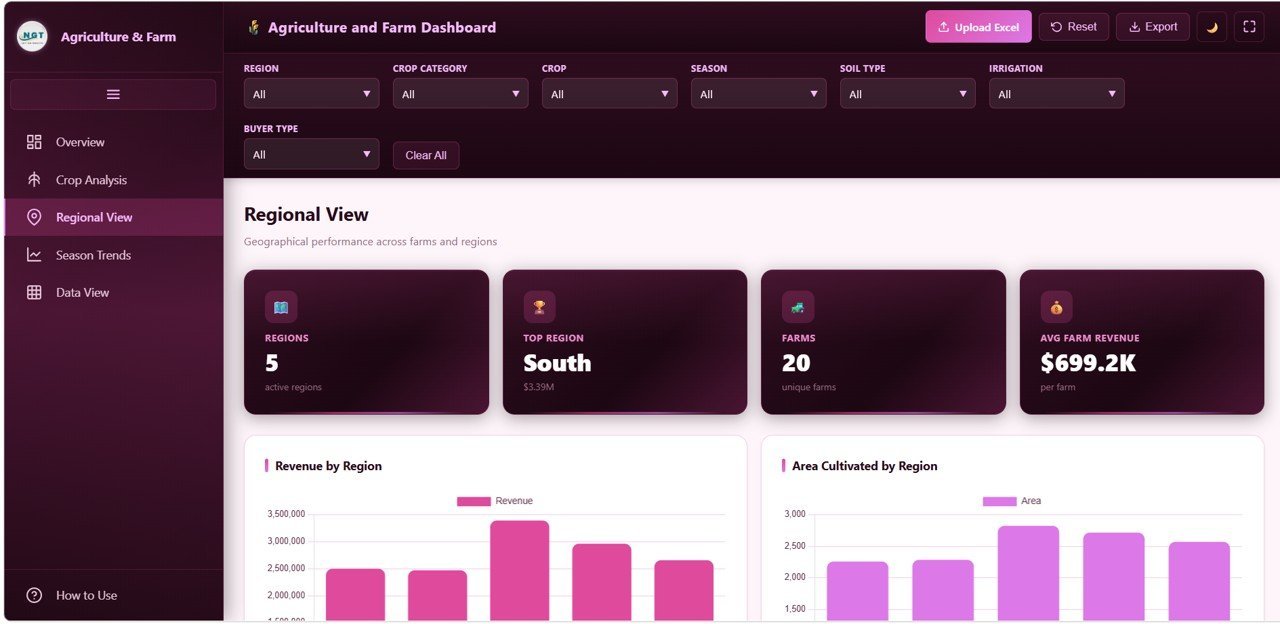
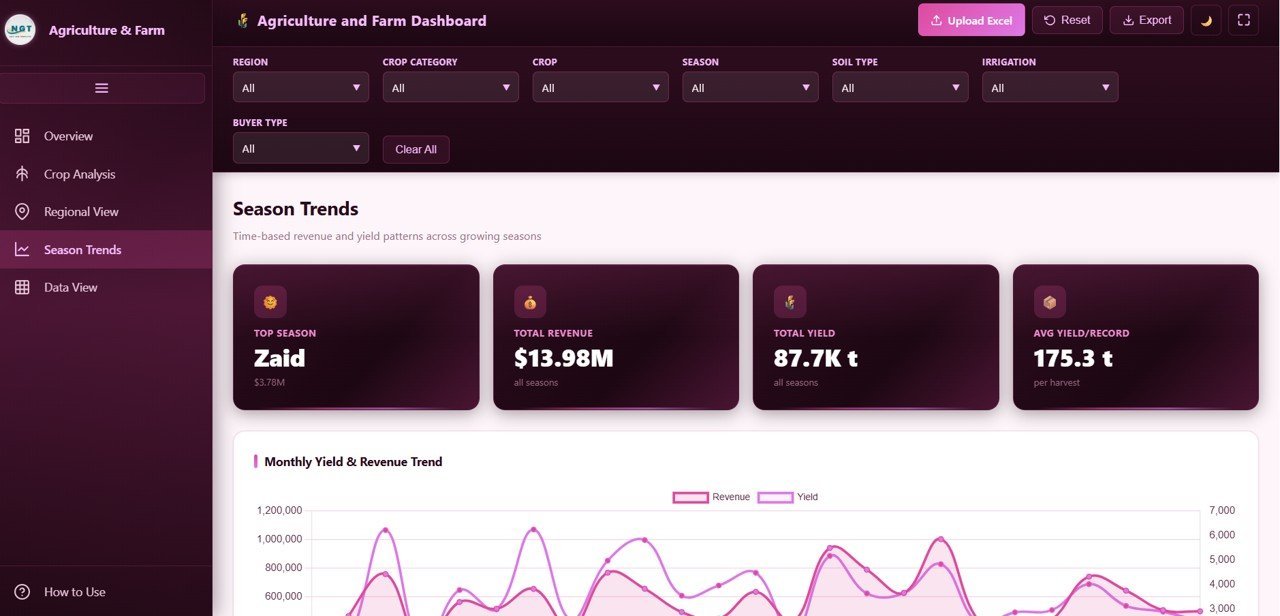
🌾 5 Interactive Dashboard Pages – This template includes five fully designed analytical pages covering Overview, Crop Analysis, Regional View, Season Trends, and Data View to give you a 360-degree picture of your farming operations.
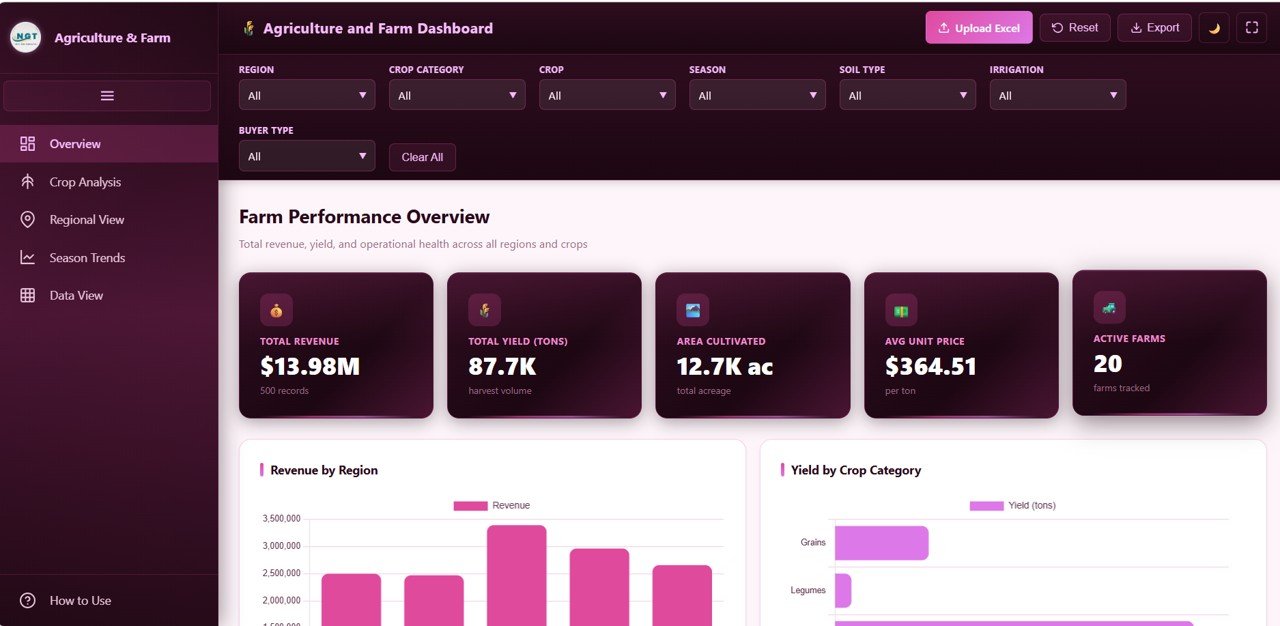
📊 High-Level KPI Cards – Instantly monitor top-line metrics including Total Revenue, Total Yield Tons, Area Cultivated, Average Unit Price, and Active Farms right from the overview page.
📈 Advanced Visual Analytics – Explore your farming data through powerful charts showing Revenue by Region, Yield by Crop Category, Revenue Distribution by Season, Top 8 Crops by Revenue, and Monthly Revenue Trend.
🎛️ Multi-Select Checkbox Filters – Apply filters across every page to slice and dice data by region, crop, season, farm, buyer type, irrigation method, and soil type for highly focused decision-making.
🌙 Light and Dark Theme Toggle – Switch between light and dark modes for comfortable viewing in any environment.
📂 Excel and CSV Upload – Load your own farm data directly into the dashboard by uploading an Excel or CSV file. The dashboard adapts automatically to your dataset.
📥 CSV Export – Download any filtered data view as a CSV file for offline analysis, reporting, or sharing with stakeholders.
📱 Fully Responsive Design – Works seamlessly on desktop, tablet, and mobile browsers so you can check farm metrics from the field or the office.
🖥️ Fullscreen Mode and Collapsible Sidebar – Maximize your workspace with fullscreen mode and a collapsible sidebar navigation that keeps the interface clean and distraction-free.
📦 What’s Inside the Agriculture and Farm Dashboard
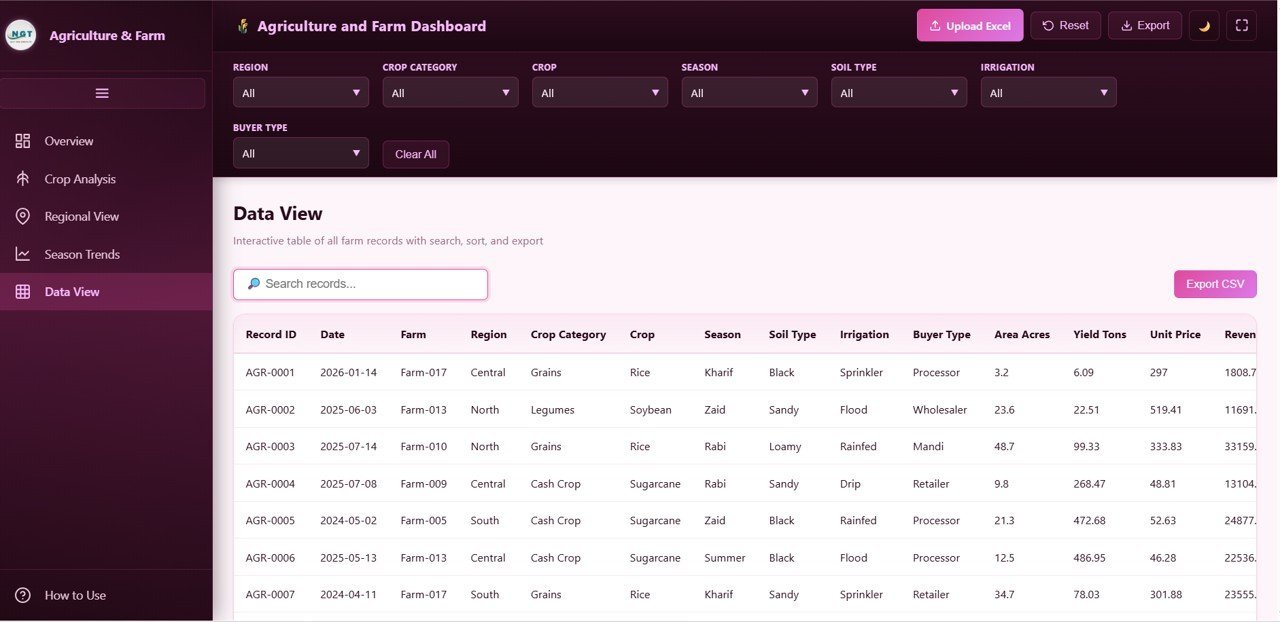
This dashboard contains 5 interactive pages. The Overview page displays KPI cards for Total Revenue, Total Yield Tons, Area Cultivated, Avg Unit Price, and Active Farms alongside charts for Revenue by Region, Yield by Crop Category, Revenue Distribution by Season, Top 8 Crops by Revenue, and Monthly Revenue Trend. The Crop Analysis page tracks Crops Grown, Categories, Yield per Acre, and Avg Revenue per Record with visuals for Yield by Crop, Average Unit Price by Crop, Revenue by Crop Category, and Area and Revenue by Crop. The Regional View page compares Active Regions, Top Region, Farms, and Average Farm Revenue with charts for Revenue by Region, Area by Region, Top 10 Farms by Revenue, and Records by Irrigation Method. The Season Trends page analyzes Top Season, Total Revenue, Total Yield, and Avg Yield per Record with Revenue and Yield by Month, Revenue by Season, Yield by Soil Type, and Revenue by Buyer Type visuals. The Data View page provides a complete interactive table with search, sorting, pagination, and CSV export.
⚙️ How to Use the Agriculture and Farm Dashboard
1️⃣ Download and unzip the template file from NextGenTemplates.com.
2️⃣ Open the index.html file in any modern web browser such as Chrome, Firefox, Edge, or Safari.
3️⃣ Explore the sample data across all five dashboard pages to understand the layout and KPIs.
4️⃣ Upload your own farm data using the built-in Excel or CSV upload feature.
5️⃣ Apply filters using the multi-select checkbox sidebar to focus on specific regions, crops, seasons, or farms.
6️⃣ Export any filtered dataset as CSV for further reporting or sharing with your team.
👥 Who Can Benefit from This Agriculture and Farm Dashboard
🌱 Farm owners and operators tracking revenue and yield across multiple farms and crop types.
🧑🌾 Agronomists analyzing crop performance, soil types, and irrigation methods to optimize output.
📊 Agribusiness managers comparing regional performance and identifying top-performing farms.
🏦 Agricultural lenders and investors evaluating farm portfolio performance and seasonal trends.
🎓 Agriculture students and researchers studying farm economics and data visualization techniques.
Also check out our Farm Production and Profitability Dashboard in Google Sheets and the Vertical Farming Dashboard in Power BI for more agricultural analytics solutions.
❓ Frequently Asked Questions
What KPIs does the Agriculture and Farm Dashboard in HTML track?
The Agriculture and Farm Dashboard in HTML tracks Total Revenue, Total Yield Tons, Area Cultivated, Average Unit Price, Active Farms, Crops Grown, Yield per Acre, Average Farm Revenue, and seasonal performance metrics across 5 interactive pages.
Can I upload my own farm data into this HTML dashboard?
Yes. The dashboard includes a built-in Excel and CSV upload feature that lets you replace the sample data with your own farm records. All charts and KPI cards update automatically.
Does this agriculture dashboard work on mobile devices?
Yes. The Agriculture and Farm Dashboard in HTML is fully responsive and works on desktop, tablet, and mobile browsers without any installation or plugins required.
What is the best HTML dashboard template for agriculture and farming?
The Agriculture and Farm Dashboard in HTML from NextGenTemplates.com is one of the best options. It covers revenue tracking, crop analysis, regional comparison, seasonal trends, and data export in a single interactive template.
How do I track crop yield and revenue by region using a dashboard?
The Regional View page in this dashboard lets you compare Revenue by Region, Area by Region, and Top 10 Farms by Revenue. Combined with multi-select filters, you can isolate any region or crop for focused analysis.
🔗 Explore Related Templates
🌿 Agriculture Dashboard in Google Sheets – A comprehensive Google Sheets agriculture dashboard with automated charts and KPI tracking.
🌾 Agriculture Dashboard in Power BI – A Power BI agriculture analytics solution with interactive slicers and drill-through pages.
🐟 Aquaculture Dashboard in Power BI – Track aquaculture operations including production, cost, and revenue analytics.
📖 Click here to read the Detailed Blog Post
Watch the step-by-step video tutorial:


Reviews
There are no reviews yet.