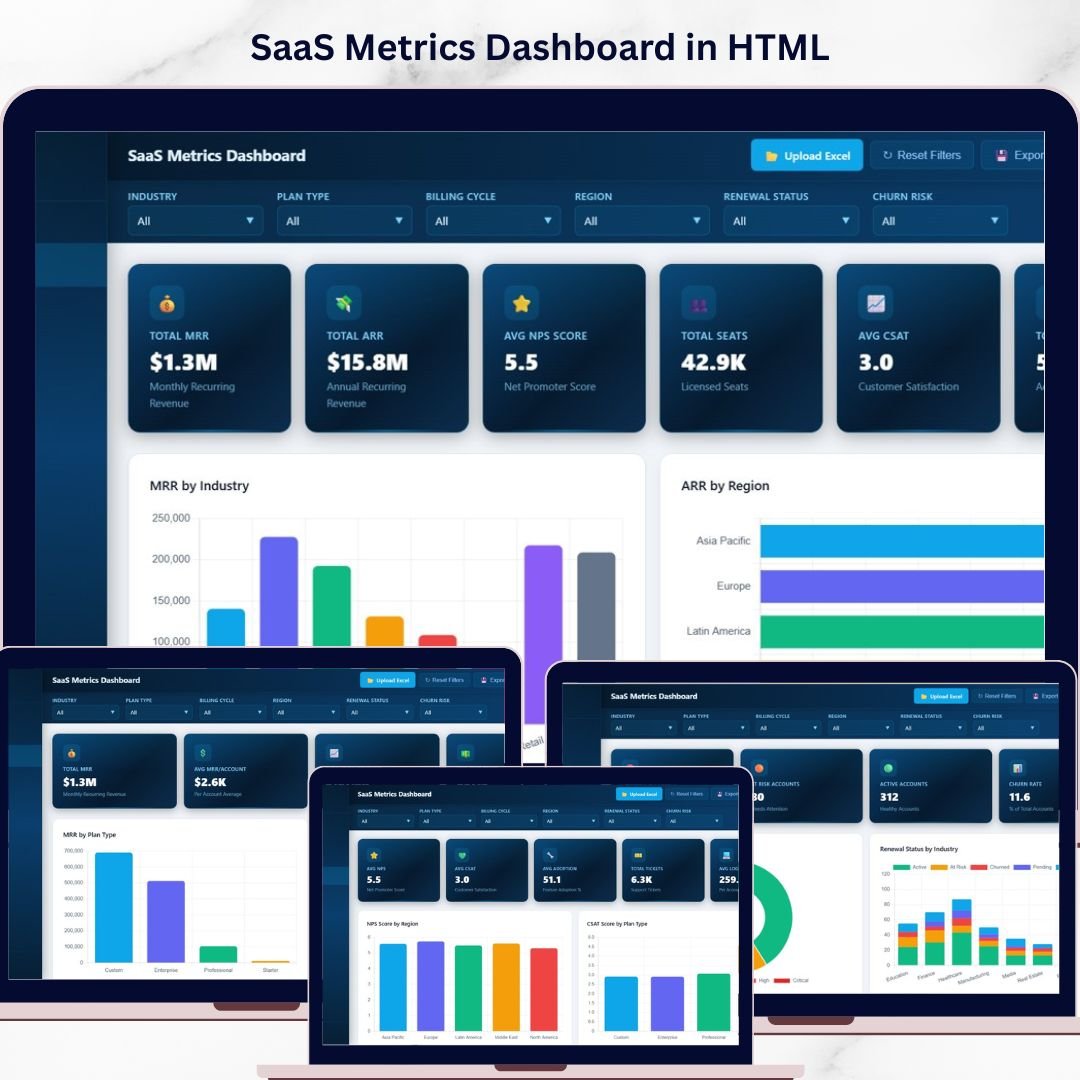
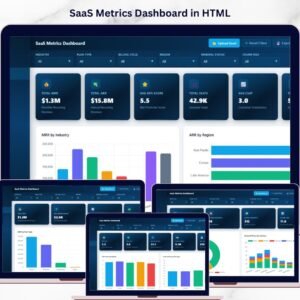
SaaS Metrics Dashboard in HTML is a powerful, browser-based analytics template designed for SaaS founders, product managers, revenue operations teams, and customer success leaders who want to monitor subscription revenue, customer health, and churn risk from a single interactive interface. This dashboard transforms raw SaaS data into actionable visual insights without requiring any software installation 🚀. Simply open the HTML file in Chrome, Firefox, or Edge and start exploring your SaaS metrics instantly.
This template includes 5 interactive dashboard pages covering Overview, Revenue Analysis, Customer Health, Churn Analysis, and a detailed Data View — making it one of the most comprehensive SaaS analytics solutions available. Whether you are tracking MRR growth, monitoring NPS scores, analyzing churn risk, or evaluating expansion revenue, this dashboard gives you complete visibility into your SaaS business operations with dynamic charts, KPI cards, and smart filtering options.
🔑 Key Features of SaaS Metrics Dashboard in HTML
📊 5 Interactive Dashboard Pages – Navigate between Overview, Revenue Analysis, Customer Health, Churn Analysis, and Data View tabs to explore SaaS data from every angle.
📈 6 Dynamic KPI Cards – Track high-level metrics at a glance including Total MRR, Total ARR, Avg NPS Score, Total Seats, Avg CSAT, and Total Accounts.
🔍 Advanced Slicers and Filters – Filter the entire dashboard instantly by industry, region, plan type, billing cycle, account manager, and more for targeted SaaS analysis.
💰 Revenue Deep-Dive Analytics – Analyze MRR by Plan Type, ARR by Account Manager, Expansion Revenue by Industry, MRR by Billing Cycle, and Avg Seat Price by Plan Type to understand your revenue streams.
❤️ Customer Health Scoring – Monitor NPS Score by Region, CSAT Score by Plan Type, Support Tickets by Industry, Feature Adoption by Industry, and NPS vs CSAT comparisons.
⚠️ Churn Risk Identification – Spot at-risk accounts with Churn Risk Distribution, Renewal Status by Industry, At-Risk Accounts by Region, and Churned Accounts by Industry analysis.
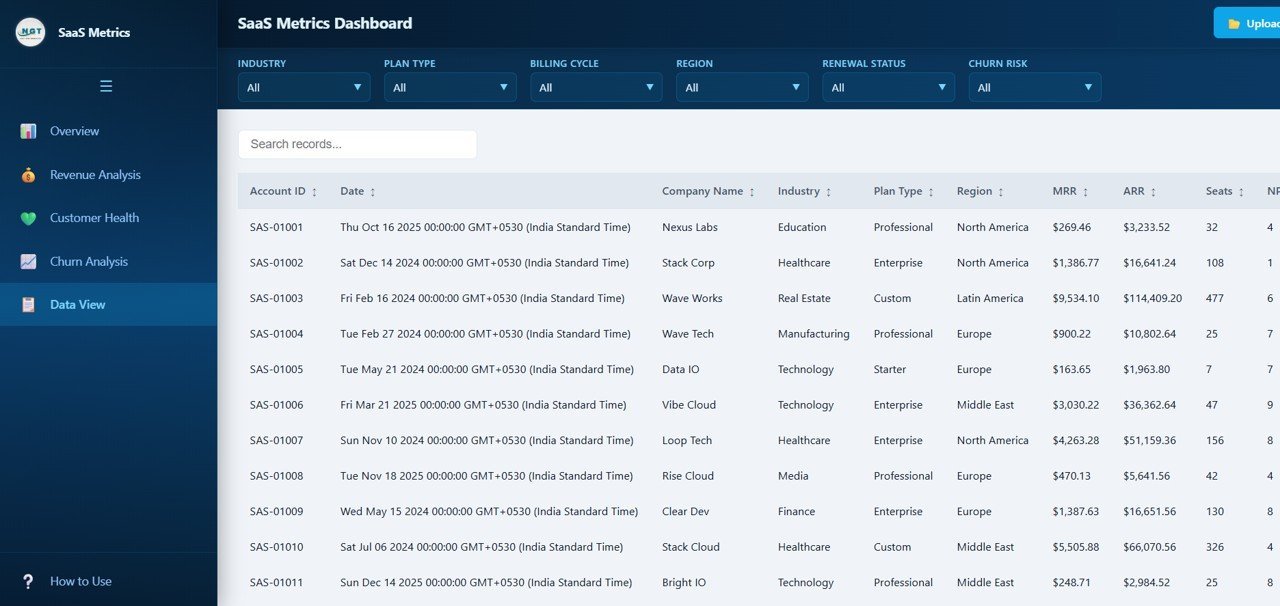
📋 Data View with Export – Browse all records with search, sort, and pagination features plus one-click CSV export for offline analysis.
🌐 Zero Installation Required – Works instantly in any modern browser without plugins, extensions, or desktop software installation.
📦 What’s Inside the SaaS Metrics Dashboard in HTML
This SaaS Metrics Dashboard in HTML contains 5 fully interactive pages that provide comprehensive coverage of subscription business analytics:
1. Overview Page: The main landing page features 6 high-level KPI cards showing Total MRR, Total ARR, Avg NPS Score, Total Seats, Avg CSAT, and Total Accounts. Below the cards, interactive charts display MRR by Industry, ARR by Region, Accounts by Plan Type, Renewal Status Distribution, and Monthly MRR Trend. Multiple slicers allow you to filter the entire dashboard for quick, focused analysis.
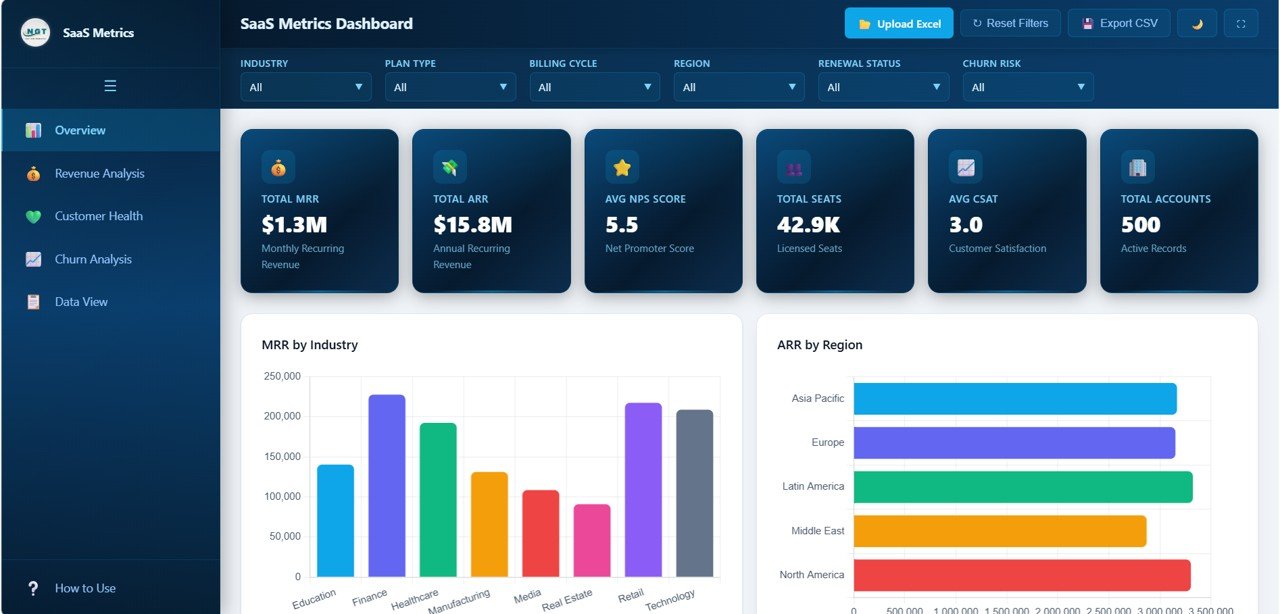 SaaS Metrics Dashboard Overview
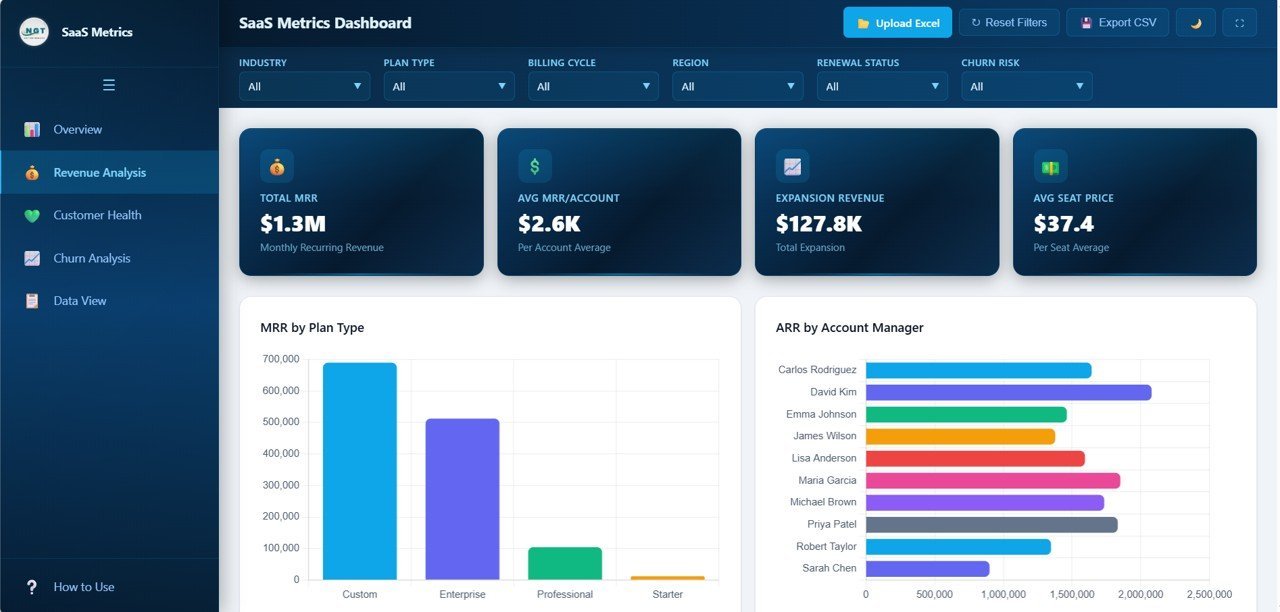
2. Revenue Analysis: This page dives deep into your revenue streams with charts showing MRR by Plan Type, ARR by Account Manager, Expansion Revenue by Industry, MRR by Billing Cycle, and Avg Seat Price by Plan Type. Perfect for understanding which plans, managers, and industries drive the most revenue.
 Revenue Analysis
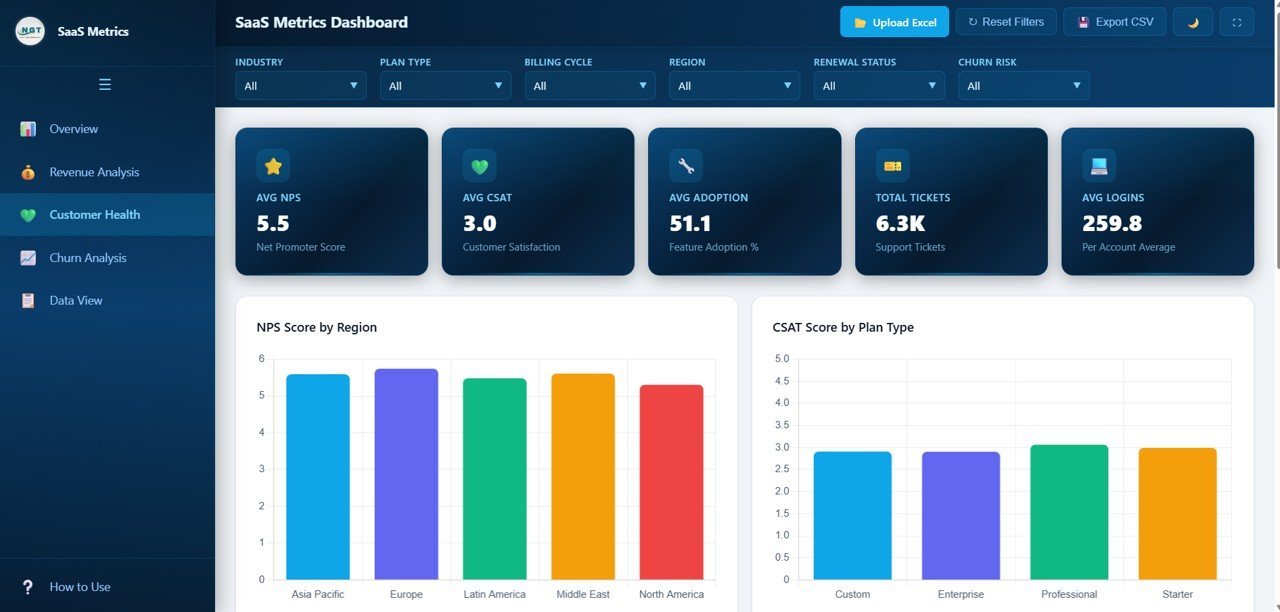
3. Customer Health: Monitor the pulse of your customer base with NPS Score by Region, CSAT Score by Plan Type, Support Tickets by Industry, Feature Adoption by Industry, and NPS vs CSAT by Plan Type analysis. This page helps you identify satisfaction trends and potential issues before they escalate.
 Customer Health
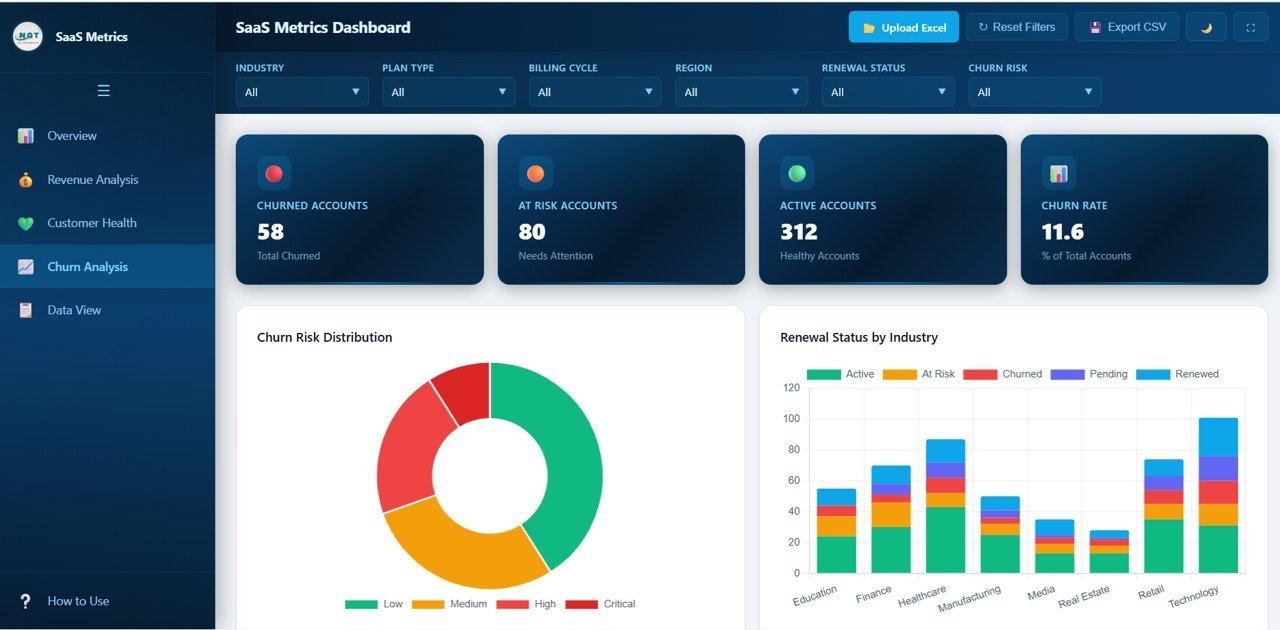
4. Churn Analysis: Protect your revenue with proactive churn monitoring. This page shows Churn Risk Distribution, Renewal Status by Industry, At-Risk Accounts by Region, Churned Accounts by Industry, and Churn Risk by Plan Type — giving you the intelligence needed to retain customers and reduce churn.
 Churn Analysis
5. Data View: The detailed data table page lets you browse all records with search, sort, and pagination features. You can also export the filtered data to CSV for further analysis in Excel or other tools.
 Data View
⚙️ How to Use the SaaS Metrics Dashboard in HTML
1️⃣ Download and unzip the template file to your computer.
2️⃣ Open the index.html file in any modern browser (Chrome, Firefox, or Edge recommended).
3️⃣ Explore the pre-loaded sample data across all 5 dashboard pages to understand the layout and features.
4️⃣ Replace the sample data in the data file with your own SaaS business data.
5️⃣ Use the slicers and filters to drill down into specific industries, regions, plan types, and account managers.
6️⃣ Export filtered data from the Data View tab to CSV for offline analysis or reporting.
👥 Who Can Benefit from This SaaS Metrics Dashboard in HTML
📌 SaaS Founders & CEOs – Get a bird’s-eye view of MRR, ARR, customer health, and churn risk in one place.
📌 Revenue Operations Teams – Analyze revenue streams by plan type, billing cycle, account manager, and industry.
📌 Customer Success Managers – Monitor NPS, CSAT, support tickets, and feature adoption to keep customers healthy and engaged.
📌 Product Managers – Track feature adoption and customer satisfaction to prioritize product improvements.
📌 Financial Analysts – Deep-dive into MRR trends, expansion revenue, and ARR breakdowns for forecasting and planning.
📌 Startup Teams & Investors – Present key SaaS metrics in a professional, interactive format for board meetings and investor updates.
❓ Frequently Asked Questions
What KPIs does the SaaS Metrics Dashboard in HTML track?
The SaaS Metrics Dashboard in HTML tracks 6 key performance indicators including Total MRR, Total ARR, Avg NPS Score, Total Seats, Avg CSAT, and Total Accounts. It also includes 20+ analytical charts across revenue, customer health, and churn analysis pages.
Do I need any software to use this HTML dashboard template?
No. Simply unzip the downloaded file and open index.html in any modern web browser like Chrome, Firefox, or Edge. No additional software, plugins, or installation is required.
Can I customize the data in this SaaS dashboard?
Yes. The template comes pre-loaded with realistic sample data. You can replace the sample data in the data file with your own SaaS business data, and all charts and KPIs will update automatically.
What is the best HTML dashboard template for tracking SaaS metrics?
The SaaS Metrics Dashboard in HTML from NextGenTemplates is the best choice for tracking subscription revenue, customer health, and churn risk. It includes 5 interactive pages with 6 KPI cards, 20+ charts, smart filters, and CSV export — all running in your browser without any installation.
How does this dashboard help reduce SaaS churn?
The dedicated Churn Analysis page shows Churn Risk Distribution, Renewal Status by Industry, At-Risk Accounts by Region, and Churned Accounts by Industry. These insights help you identify at-risk customers early and take proactive steps to improve retention.
Can I export data from this dashboard?
Yes. The Data View tab includes a one-click CSV export feature that lets you download filtered data for further analysis in Excel, Google Sheets, or any other spreadsheet application.
🔗 Explore Related Templates
📎 Customer Relationship Management (CRM) Dashboard in HTML – Track customer interactions, sales pipeline, and relationship metrics with this comprehensive CRM analytics template.
📎 IT Support Ticket Dashboard in HTML – Monitor support ticket volume, resolution times, and technician performance with this interactive IT dashboard.
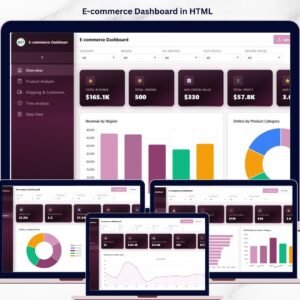
📎 E-commerce Dashboard in HTML – Analyze sales performance, customer behavior, and product analytics with this browser-based e-commerce template.
Browse all HTML Dashboard Templates for more interactive analytics solutions.
📖 Click here to read the Detailed Blog Post about SaaS Metrics Dashboard in HTML
Watch the step-by-step video tutorial:


Reviews
There are no reviews yet.