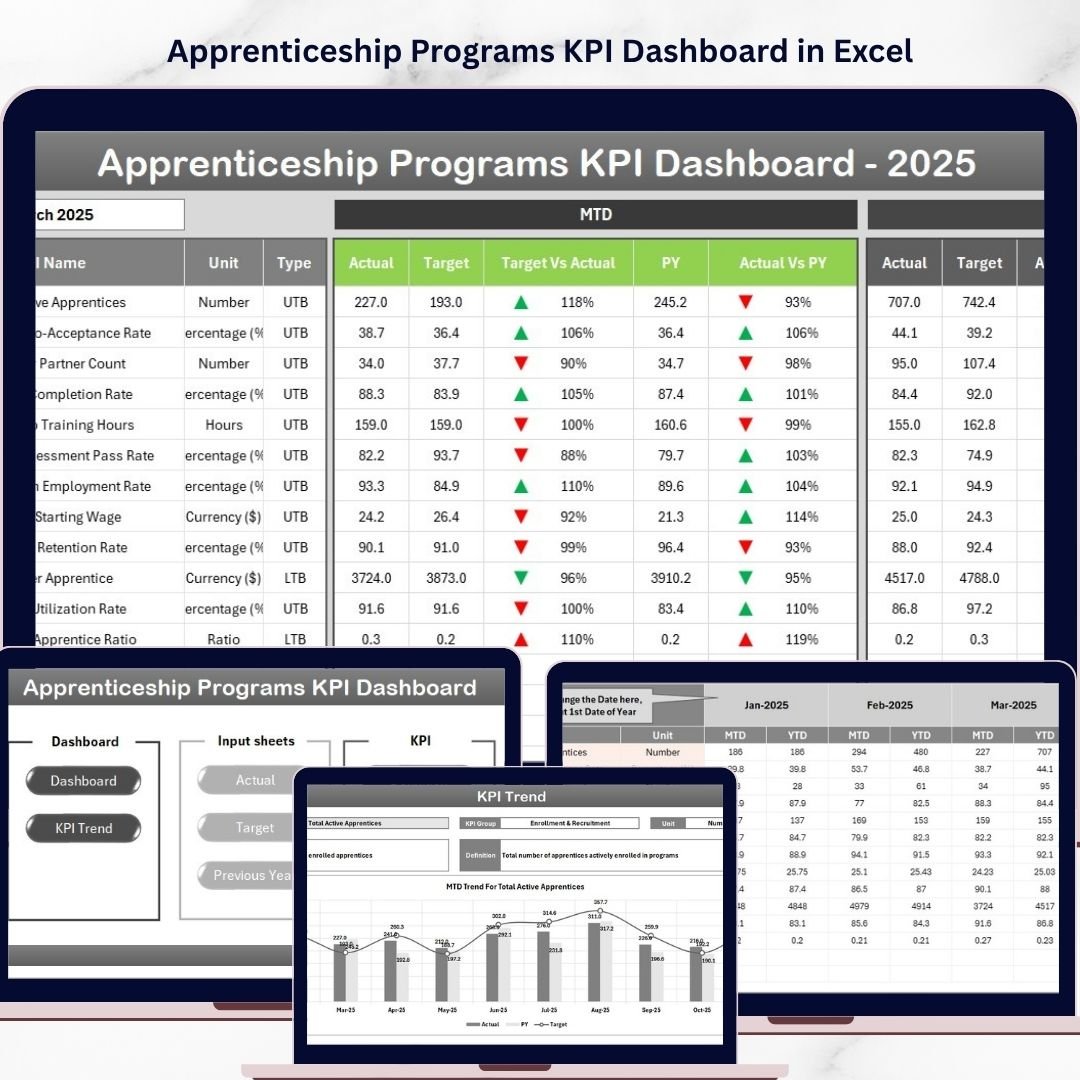
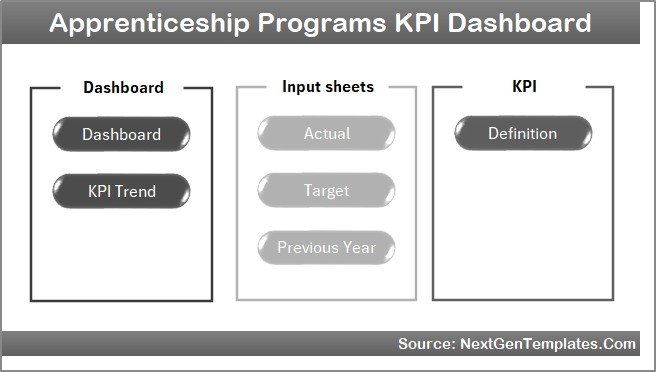
Key Features of Apprenticeship Programs KPI Dashboard
Unlock the full potential of your apprenticeship programs with our Apprenticeship Programs KPI Dashboard, designed to provide you with comprehensive insights and real-time data tracking. This digital dashboard offers a streamlined, user-friendly interface to monitor and analyze key performance indicators (KPIs) critical for apprenticeship success. Featuring seven dynamic worksheets, you can seamlessly navigate through vital data points that help you make informed decisions and drive program improvements.
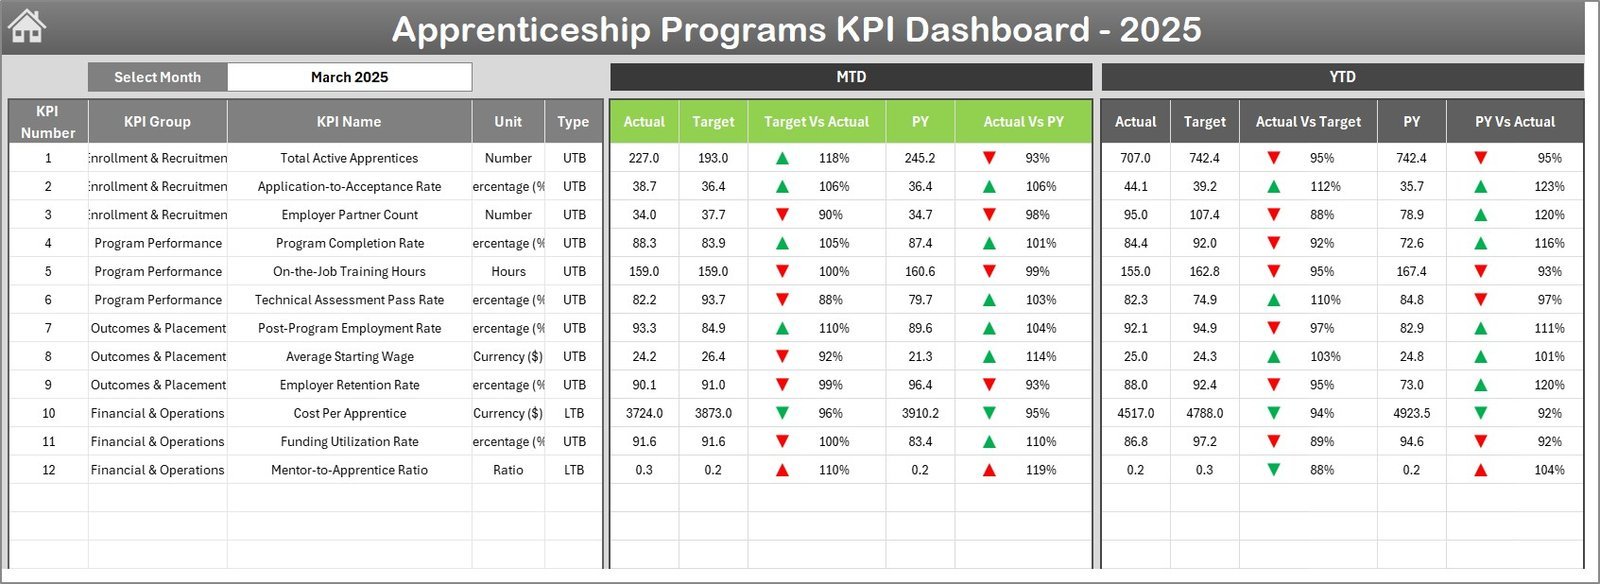
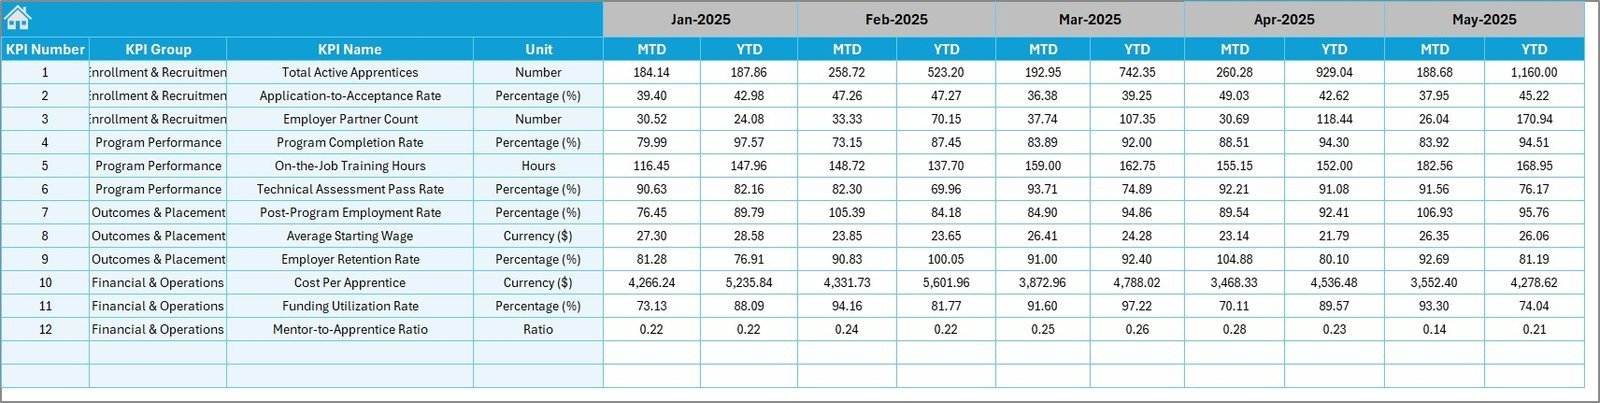
The Home sheet acts as an intuitive navigation hub, equipped with six clickable buttons that direct you swiftly to other relevant sheets, saving you time and enhancing your workflow efficiency. The Dashboard sheet is the heart of the product, displaying Month-to-Date (MTD) actuals, targets, previous year data, and year-to-date (YTD) metrics. It includes powerful conditional formatting with up/down arrows that visually highlight performance trends against targets and previous year comparisons.
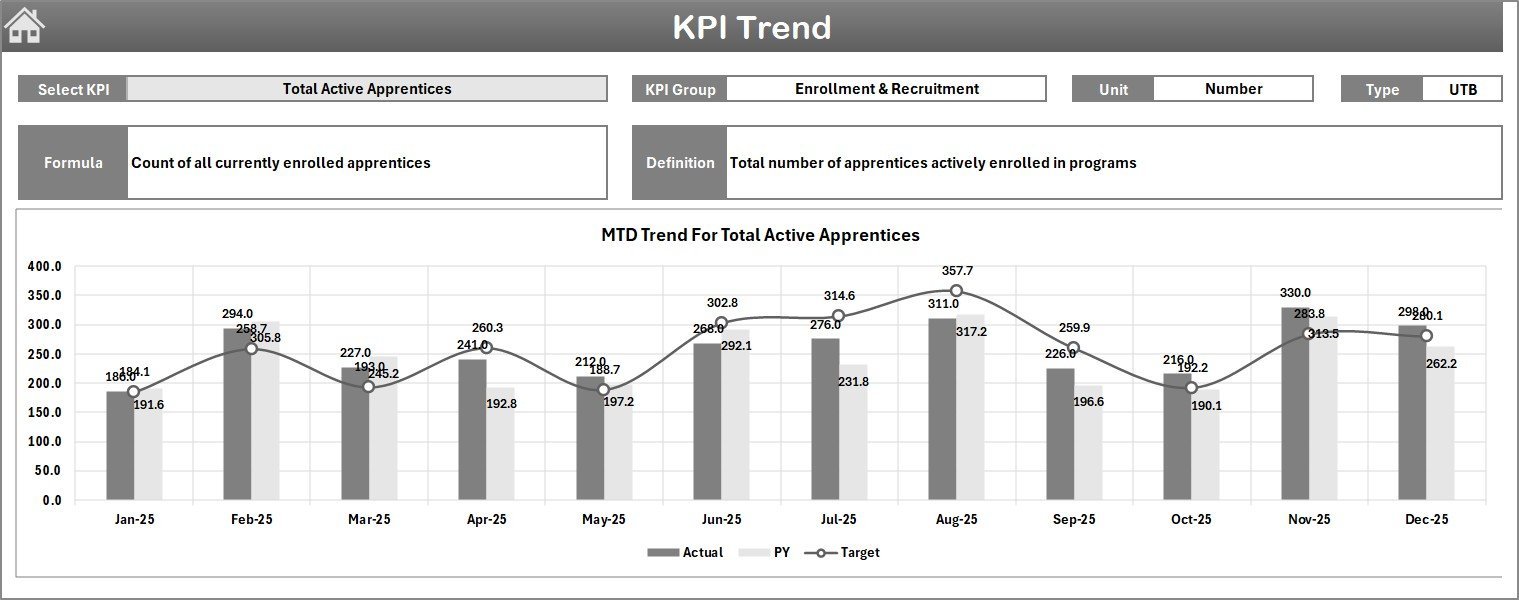
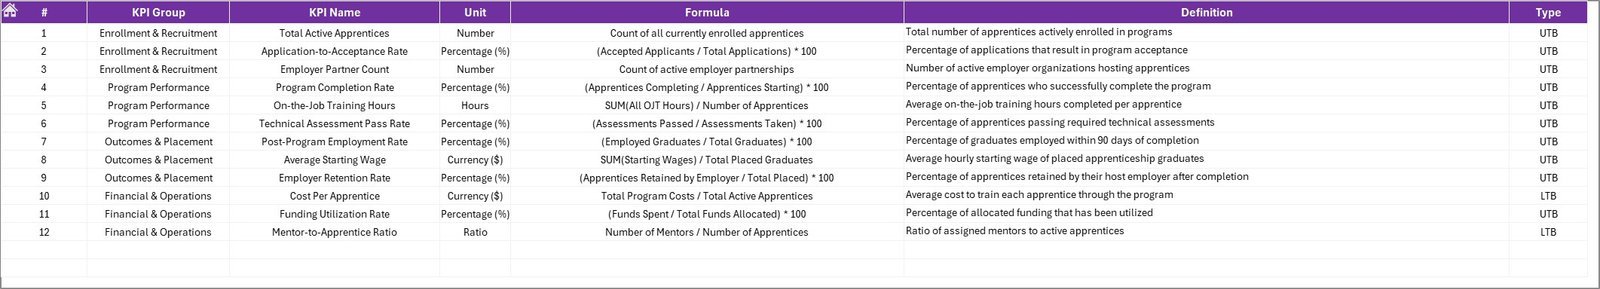
In the KPI Trend sheet, select any KPI from a drop-down menu to view detailed information such as KPI group, unit, type (whether lower or upper the better), formula, and a clear definition. The sheet also visualizes MTD and YTD trends through charts, enabling you to spot performance patterns at a glance.
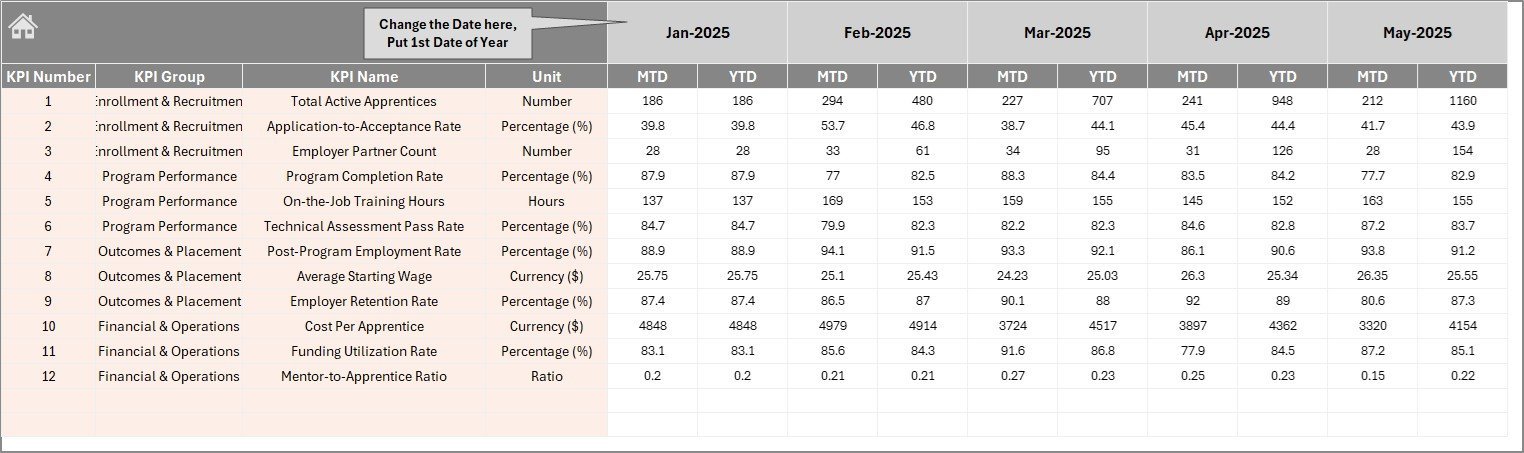
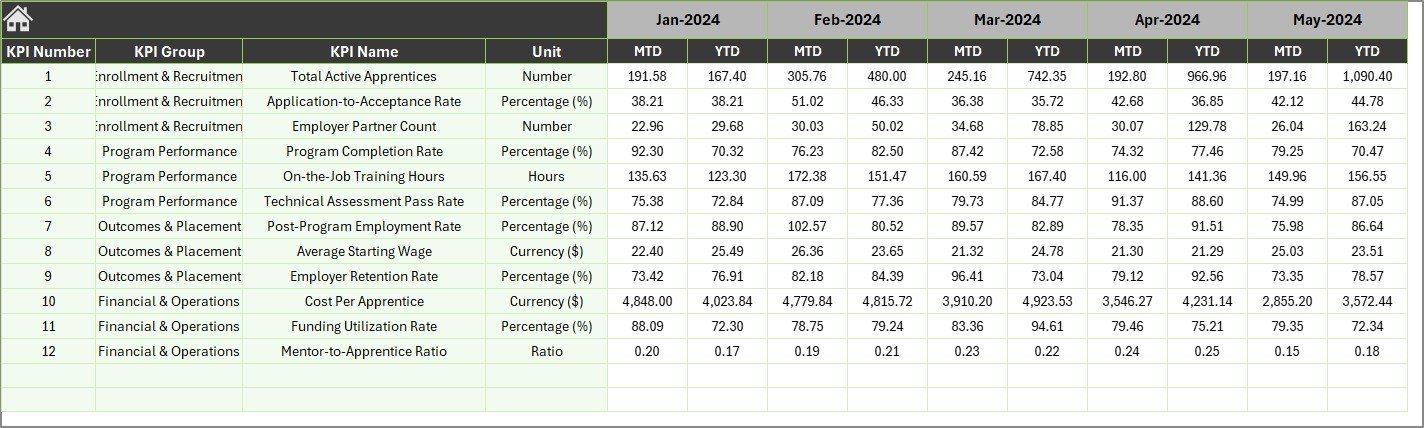
Inputting data is easy and organized across three dedicated sheets: Actual Numbers Input for entering MTD and YTD actuals, Target Number Input to set monthly targets, and Previous Year Number Input for entering last year’s data, ensuring year-over-year performance tracking is straightforward and consistent.
Finally, the KPI Definition sheet lets you customize and maintain your KPI details by entering names, groups, units, formulas, and definitions, along with the KPI type for precise performance interpretation.
What’s Inside the Apprenticeship Programs KPI Dashboard
- 🏠 Home Sheet: Central navigation hub with quick access to all sheets.
- 📊 Dashboard Sheet: Comprehensive overview of all KPIs with month and year comparisons.
- 📈 KPI Trend Sheet: Detailed KPI insights with interactive charts and definitions.
- ✍️ Actual Numbers Input Sheet: Easy data entry for current year metrics.
- 🎯 Target Number Input Sheet: Set and update monthly KPI targets seamlessly.
- 📅 Previous Year Number Input Sheet: Input previous year’s numbers to benchmark progress.
- 📚 KPI Definition Sheet: Customize KPI details for accurate tracking and understanding.
How to Use the Apprenticeship Programs KPI Dashboard
Getting started with the Apprenticeship Programs KPI Dashboard is simple and requires no advanced technical skills. Begin by navigating the Home sheet to familiarize yourself with the dashboard layout. Use the intuitive buttons to jump between sheets.
Input your current month’s actual numbers and target figures in the designated input sheets. Make sure to update the month in the dropdowns or input cells to keep your data relevant. Next, enter last year’s corresponding numbers in the Previous Year Number Input sheet to enable comparative analysis.
Review the Dashboard sheet regularly to monitor your apprenticeship KPIs, observe trends, and identify areas needing improvement. Use the conditional formatting and arrows to quickly spot whether you are meeting, exceeding, or falling short of your targets.
For deeper insights, explore the KPI Trend sheet where you can drill down into specific KPIs, understand their formulas, units, and performance type, along with visual trend charts that help you track progress over time.
Maintain and update your KPIs in the KPI Definition sheet to ensure the dashboard reflects your organization’s evolving metrics and goals.
Who Can Benefit from This Apprenticeship Programs KPI Dashboard
- 👩💼 HR Managers: Track apprenticeship performance and alignment with organizational goals.
- 📊 Program Coordinators: Easily monitor and report KPIs to stakeholders.
- 🏫 Training Managers: Assess effectiveness of training modules and identify improvement areas.
- 📈 Business Analysts: Conduct detailed KPI analysis with trend visualizations.
- 💼 Apprenticeship Supervisors: Gain insight into apprentice progress and target attainment.
- 🖥️ Executives & Decision Makers: Get quick, data-driven overviews for strategic planning.
- 📋 Consultants: Utilize the dashboard as a powerful tool for client performance reviews.
- 🎯 Any Organization Running Apprenticeship Programs: Streamline KPI tracking and improve program outcomes.
Click here to read the Detailed blog post.
Visit our YouTube channel to learn step-by-step video tutorials


Reviews
There are no reviews yet.