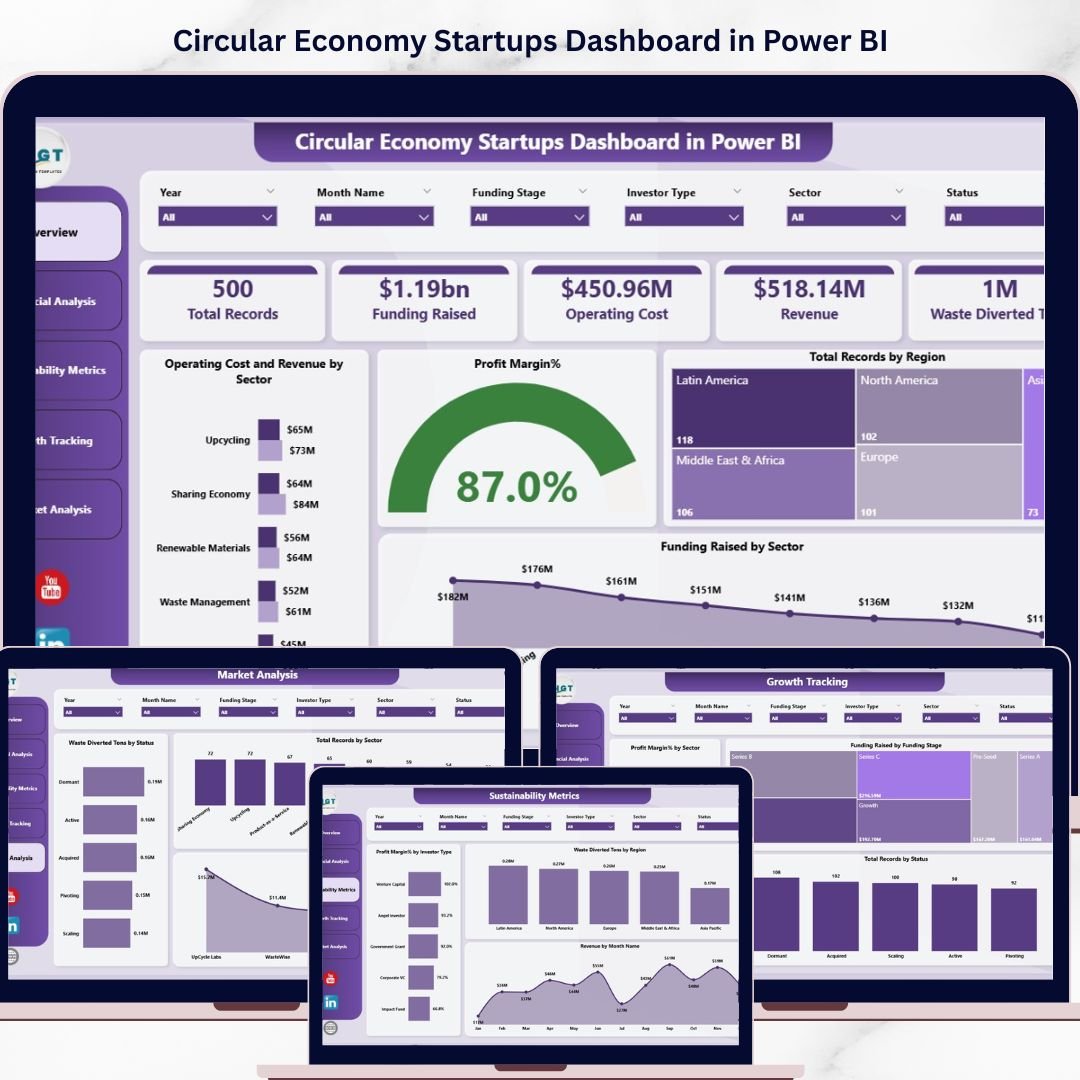
Circular Economy Startups Dashboard in Power BI is a professionally designed analytics template built for sustainability-focused startups, green investors, and circular economy advocates who want to monitor, measure, and optimize performance across key environmental and operational metrics. If you are running an eco-innovation venture, managing a portfolio of circular economy startups, or tracking sustainability progress for stakeholder reporting — this interactive Power BI dashboard transforms complex circular economy data into clear, actionable visual insights.
Startups operating within the circular economy face unique analytical challenges — from tracking material recovery and recycling efficiency to monitoring waste diversion rates and resource optimization across multiple product lines. This Power BI dashboard addresses those challenges by delivering a centralized, multi-page analytics hub where founders, sustainability managers, and impact investors can instantly evaluate how effectively a startup is implementing circular economy principles — all with dynamic slicers, interactive charts, and rich visual storytelling.
🔑 Key Features of Circular Economy Startups Dashboard in Power BI
♻️ End-to-End Circular Economy Analytics — Track startup performance across waste diversion, recycling rates, resource efficiency, carbon savings, material recovery, and sustainability impact metrics all from one powerful multi-page dashboard template.
📊 Five Interactive Analysis Pages — Navigate through visually rich analysis pages covering overview KPIs, material flow analysis, sustainability impact trends, operational efficiency breakdowns, and regional performance comparisons.
🎯 Dynamic Slicer Filters — Filter your dashboard instantly by startup name, material category, region, time period, and business model to focus on the metrics that matter most to your stakeholders.
📈 Professional KPI Card Layout — Key metrics are displayed in visually appealing card formats showing totals, percentages, and trend indicators at a glance for quick decision-making.
⚡ Powered by Power BI DAX — All calculations, measures, and KPI logic are built using Power BI DAX formulas for lightning-fast performance and automatic data refresh.
🔧 Fully Customizable Design — Easily add new KPIs, modify visuals, adjust color themes, and expand the data model to match your specific circular economy tracking requirements.
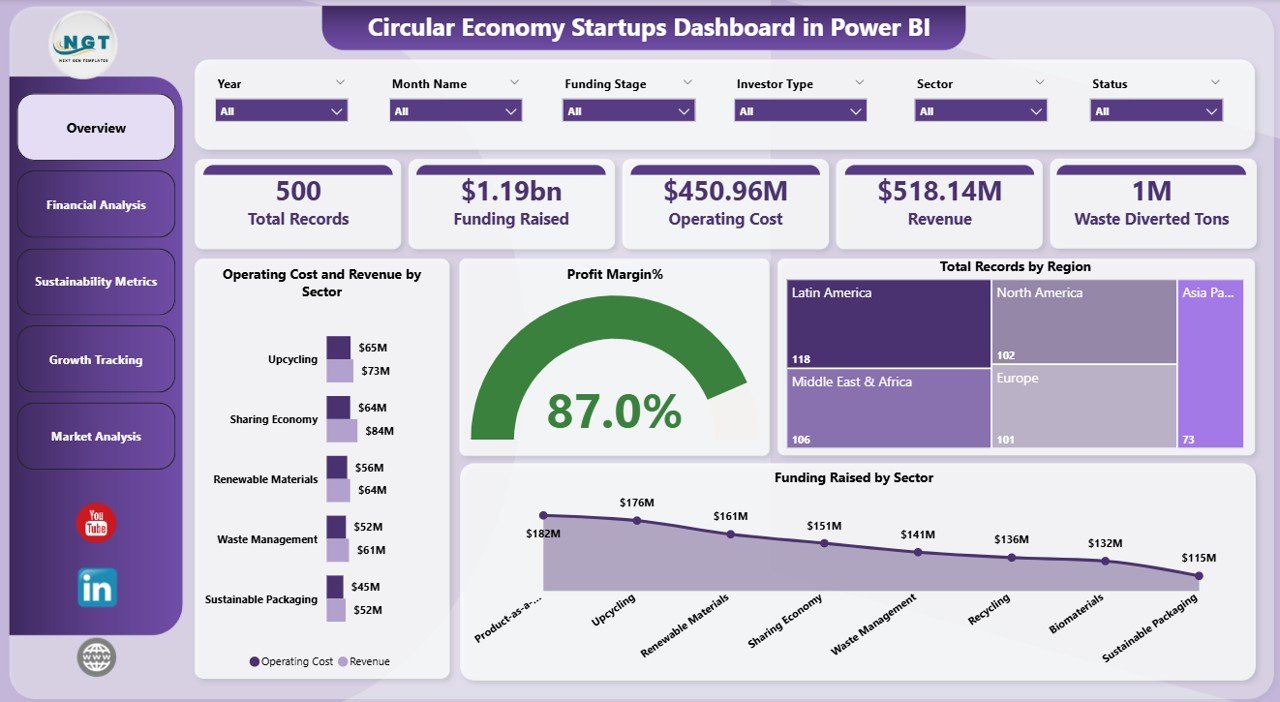 Circular Economy Startups Dashboard in Power BI – Overview Page
📦 What’s Inside the Circular Economy Startups Dashboard in Power BI
This professionally structured Power BI template includes five organized dashboard pages designed for complete startup sustainability visibility:
📊 1 — Overview Page — The main dashboard displaying high-level KPI cards including Total Revenue, Waste Diverted, Recycling Rate, Carbon Savings, Active Startups, and Resource Recovery Rate. Multiple interactive charts visualize performance across key dimensions with slicers for instant filtering.
📈 2 — Material Flow Analysis — Deep-dive analysis showing material recovery by category, waste composition breakdown, recycling efficiency by material type, and resource utilization trends across startup operations.
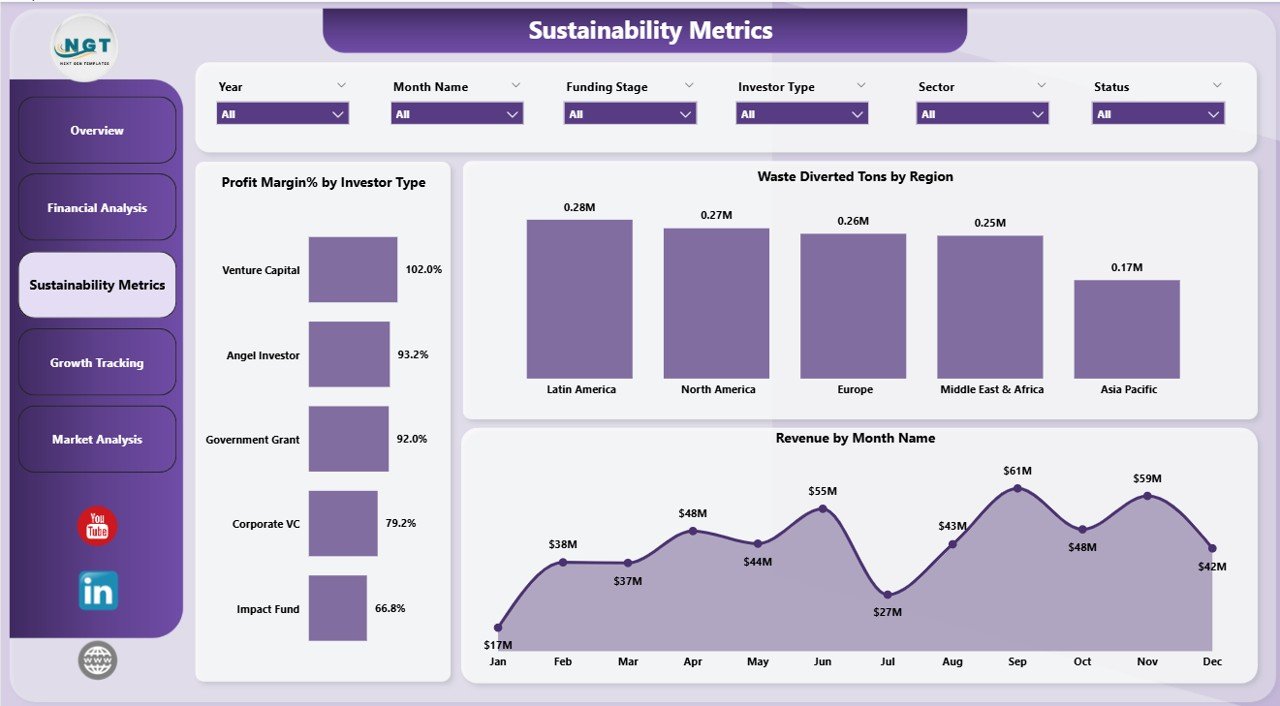
🔍 3 — Sustainability Impact Analysis — Track carbon emission reductions, water conservation metrics, energy savings, and environmental impact scores by startup and region with comparative trend charts.
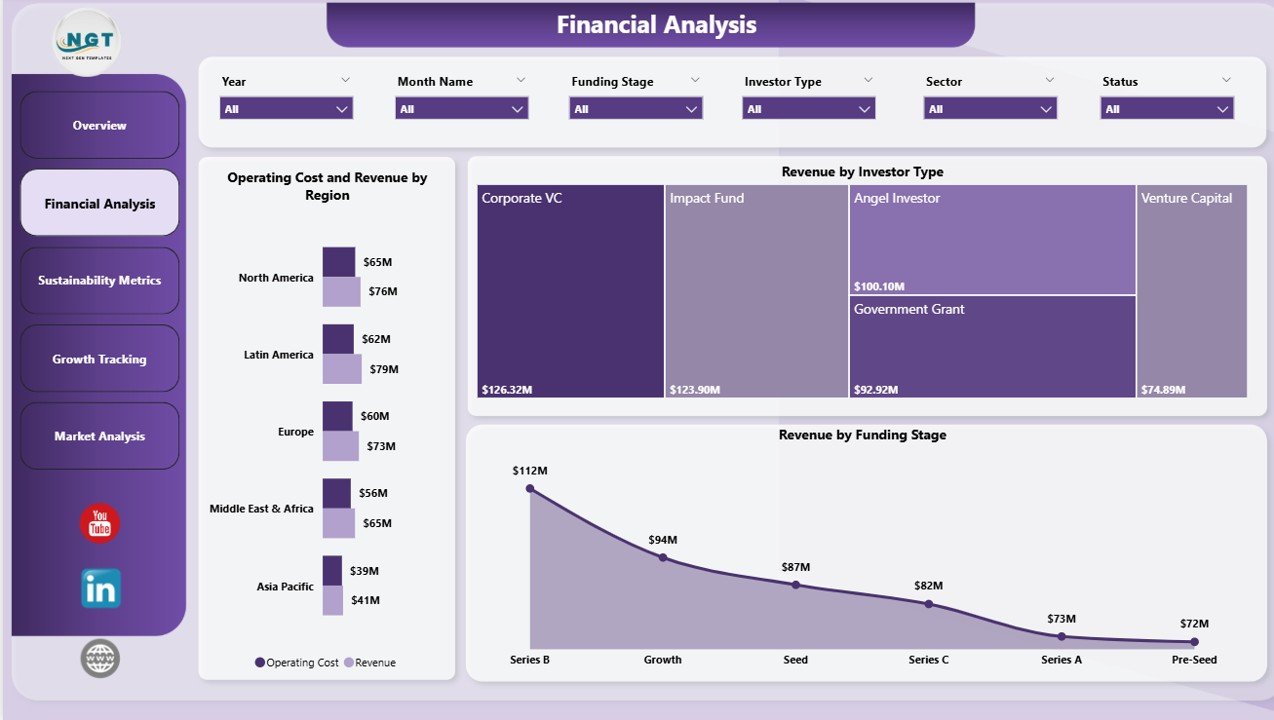
⚙️ 4 — Operational Efficiency Analysis — Monitor operational KPIs including production waste rates, supply chain circularity, product lifecycle metrics, and cost savings from circular practices.
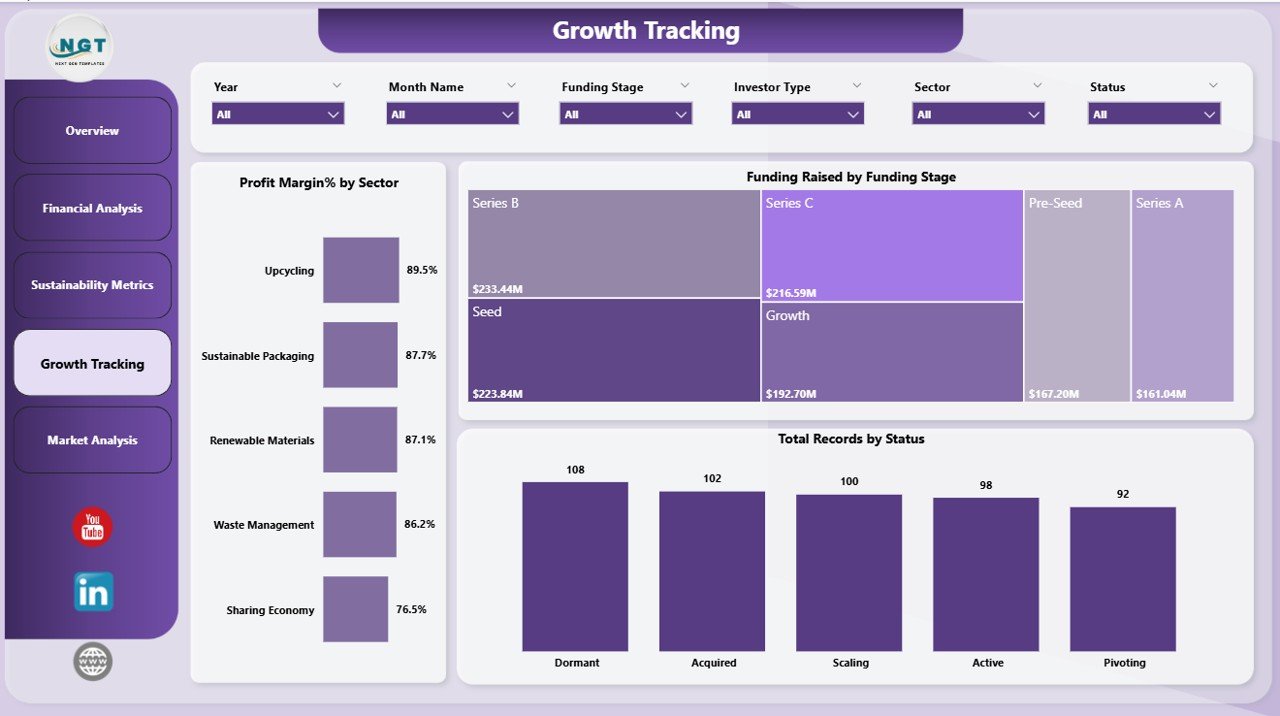
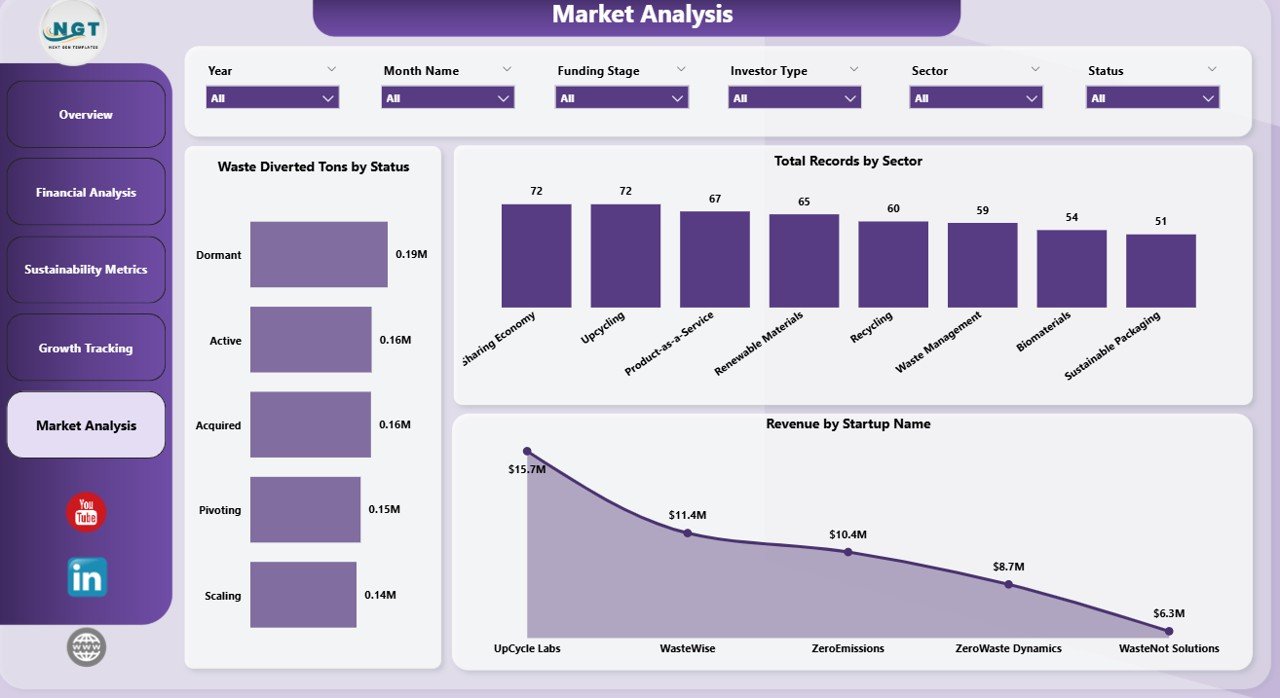
🌍 5 — Regional Performance Analysis — Geographic breakdown of startup performance showing sustainability metrics by location, market penetration, and regional circular economy adoption rates.
⚙️ How to Use the Circular Economy Startups Dashboard in Power BI
1️⃣ Download and open the .pbix file in Power BI Desktop
2️⃣ Navigate to the data model and replace the sample data with your actual startup performance data
3️⃣ Click Refresh to update all visuals and DAX calculations automatically
4️⃣ Navigate through the five dashboard pages to explore your analysis
5️⃣ Use the slicers on each page to filter data by startup, region, material category, or time period
6️⃣ Publish to Power BI Service for cloud access, team sharing, and scheduled data refreshes
👥 Who Can Benefit from This Circular Economy Startups Dashboard in Power BI
🌱 Circular Economy Startup Founders monitoring operational sustainability
📊 Sustainability Managers tracking environmental KPIs across startup portfolios
💼 Impact Investors evaluating startup sustainability performance
🏢 Incubators and Accelerators managing cohort-level circular economy metrics
🔬 ESG Analysts benchmarking startup environmental impact
📈 Business Consultants advising green startups on data-driven decisions
🎓 Academic Researchers studying circular economy business models
By combining powerful Power BI analytics with an intuitive multi-page design, the Circular Economy Startups Dashboard in Power BI empowers sustainability-driven organizations to track performance, identify improvement opportunities, and accelerate their transition to a fully circular business model — all within the world’s leading business intelligence platform.
📖 Click here to read the Detailed Blog Post
🎥 Visit our YouTube channel to learn step-by-step video tutorials
👉 YouTube.com/@NextGenTemplates


Reviews
There are no reviews yet.