


Telecommunications Dashboard in HTML is a powerful, interactive, and ready-to-use analytics solution built for telecom professionals who want to monitor ticket performance, analyze service quality, track regional trends, and evaluate technician productivity from a single centralized web-based interface. If you are managing telecom customer support using scattered spreadsheets and static reports, this dashboard transforms your approach completely by delivering real-time visual insights through a modern HTML interface.
Instead of switching between multiple tools and wasting hours on manual reporting, this HTML Dashboard brings all your critical telecommunications support data together in one professional, browser-based dashboard. With dynamic charts, interactive filters, and responsive KPI cards, you gain instant clarity on every aspect of your telecom operations.
 Telecommunications Dashboard Overview
🔑 Key Features of Telecommunications Dashboard in HTML
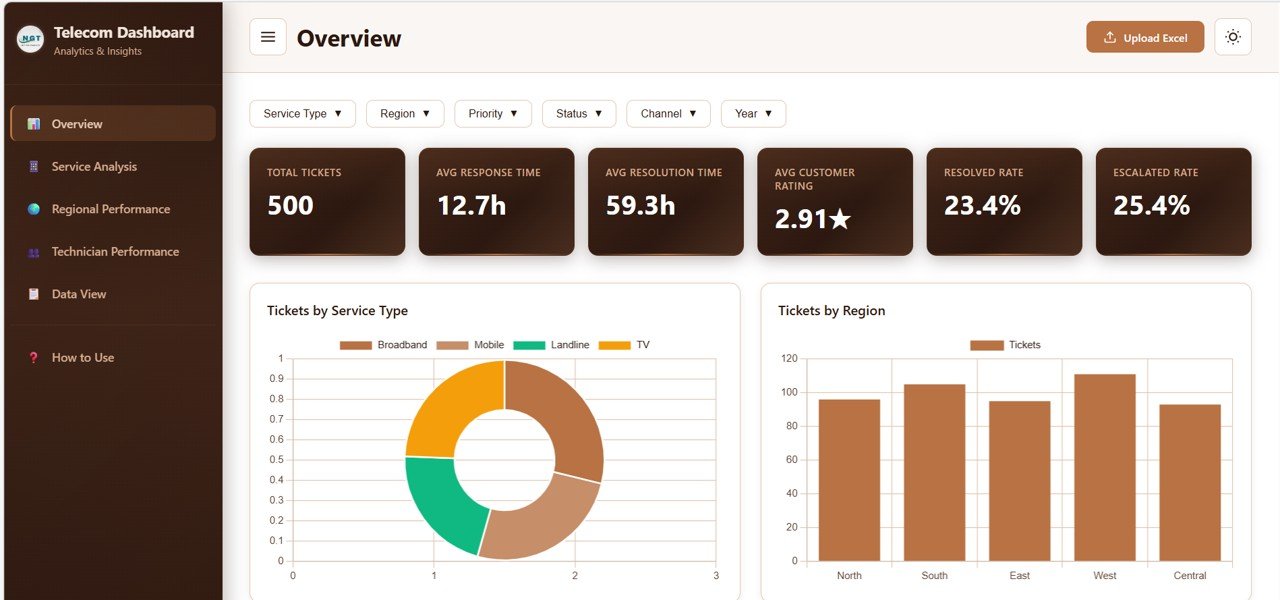
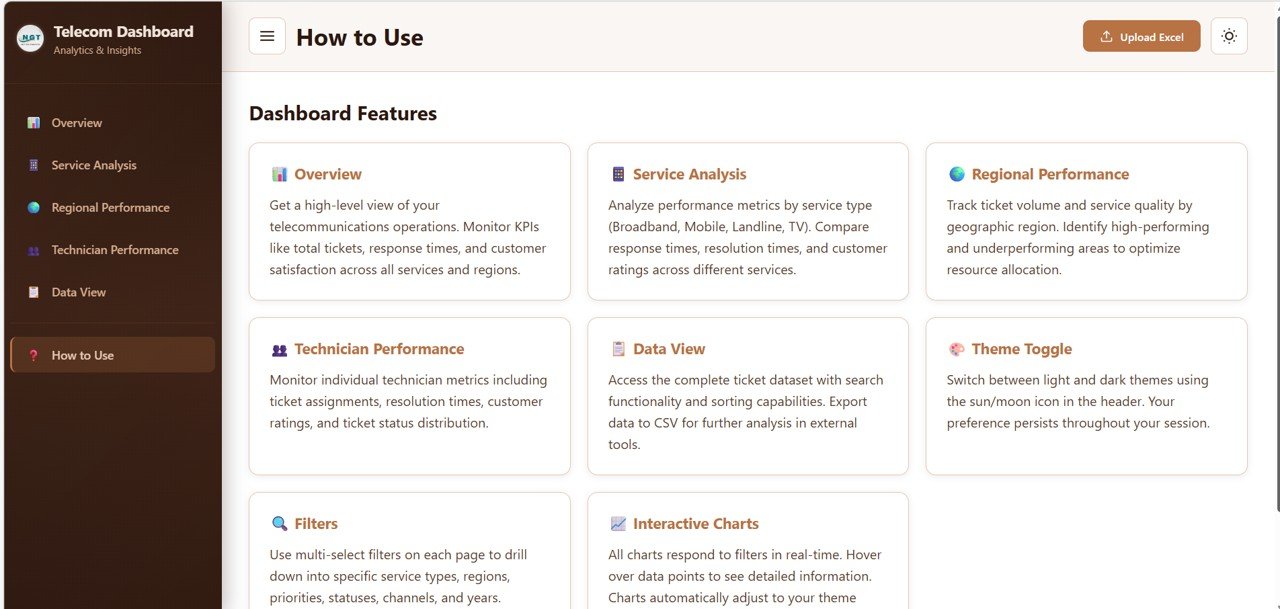
📡 Interactive Overview Dashboard – Get a complete snapshot of your telecom operations with high-level KPI cards including Total Tickets, Average Response Time, Average Resolution Time, Average Customer Rating, Resolved Rate, and Escalated Rate all in one view
📊 Service Analysis Page – Analyze response times, resolution times, customer ratings, and issue type breakdowns across different telecom service types using dynamic visual charts
🌍 Regional Performance Section – Compare ticket volumes, customer ratings, response times, and support channel distribution across all regions to identify geographic performance gaps
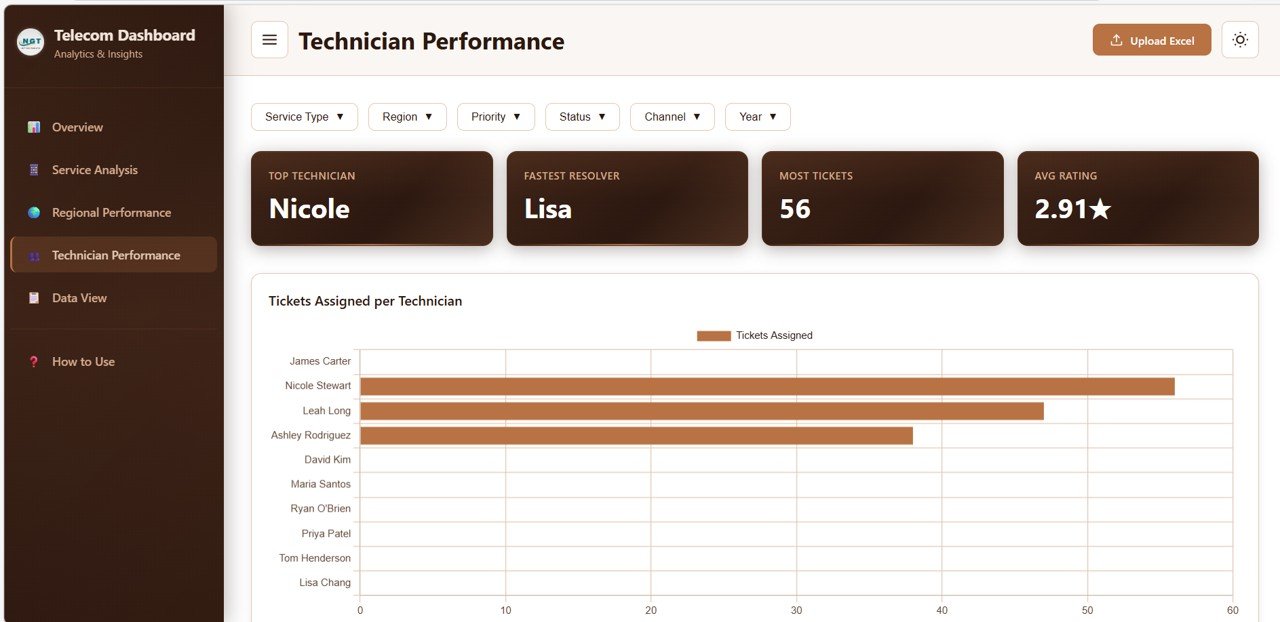
👨🔧 Technician Performance Tracking – Monitor individual technician workload, customer ratings, resolution speed, and ticket status distribution to optimize team efficiency
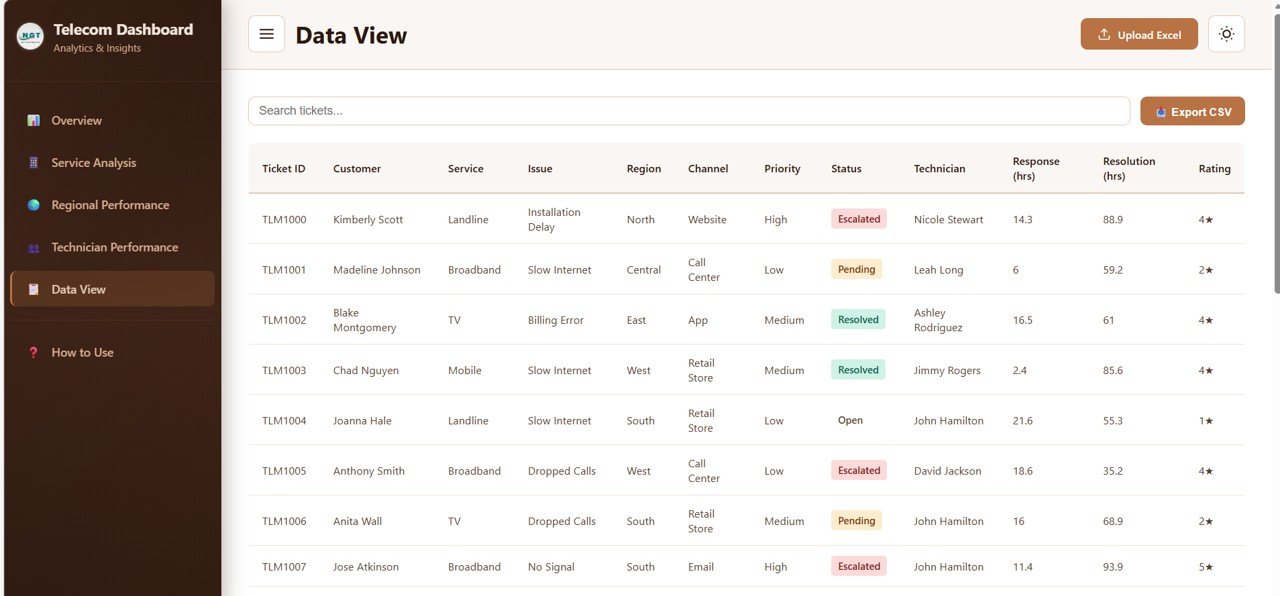
🔍 Data Explorer with Search and Export – Access a detailed data table with search functionality, sortable columns, pagination, and CSV export options for deeper analysis
⚡ Real-Time Filters and Slicers – Apply multiple slicers to filter the entire dashboard quickly by region, service type, priority, status, and time period
📈 Monthly Ticket Trend Charts – Visualize ticket volume trends over time to identify seasonal patterns and workload spikes
🌐 Modern Responsive Design – Clean, professional, and mobile-friendly interface that works seamlessly in any modern web browser
📦 What’s Inside the Telecommunications Dashboard in HTML
📁 Overview Section – High-level KPI cards showing Total Tickets, Average Response Time, Average Resolution Time, Average Customer Rating, Resolved Rate, and Escalated Rate. Charts include Tickets by Service Type, Tickets by Region, Tickets by Status, Tickets by Priority, and Monthly Ticket Trend for complete operational visibility
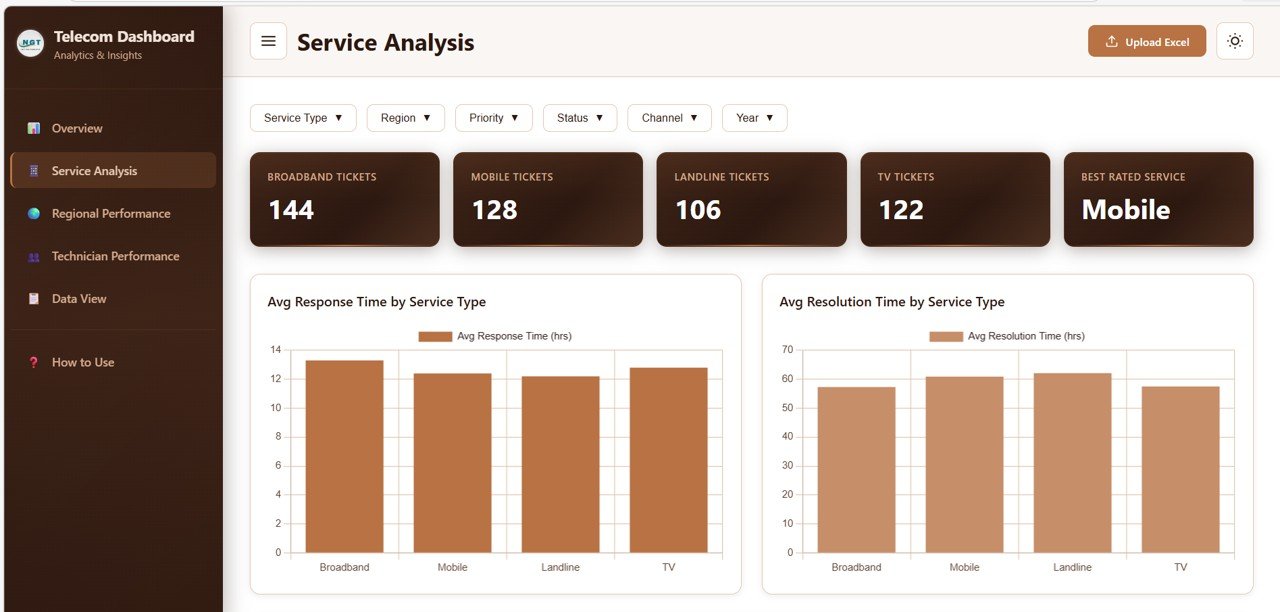 Service Analysis
📁 Service Analysis Section – Detailed analysis showing Average Response Time by Service Type, Average Resolution Time by Service Type, Customer Rating Distribution by Service Type, and Issue Type Breakdown by Service Type to help optimize service delivery
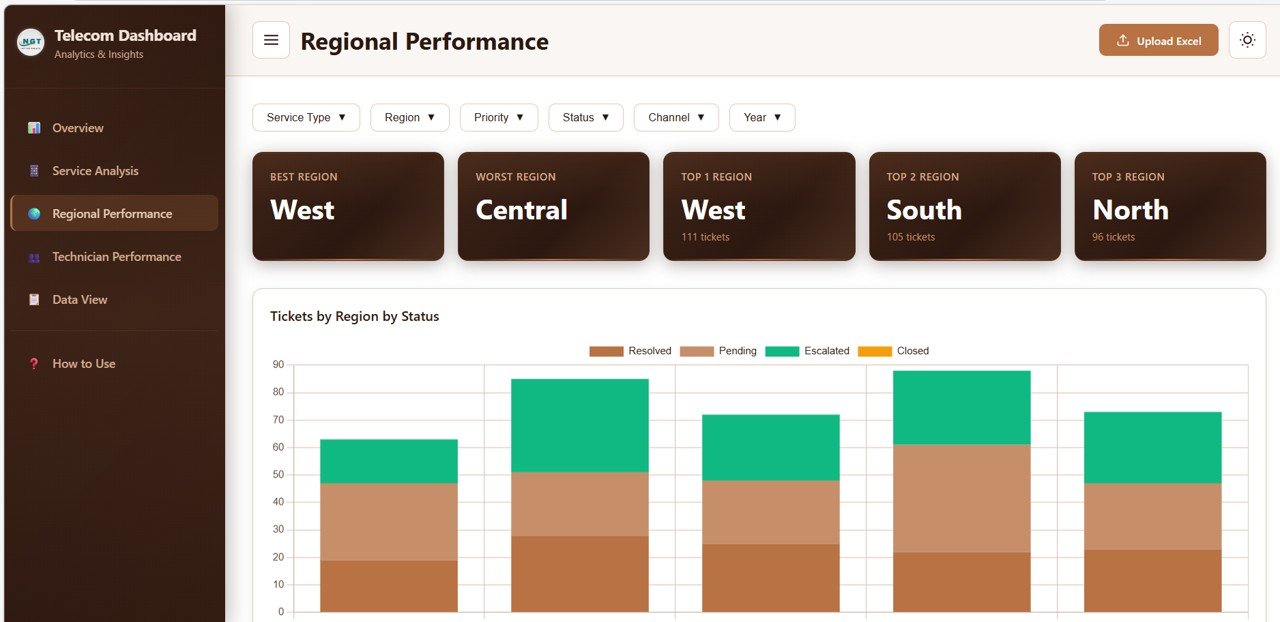 Regional Performance
📁 Regional Performance Section – Compare Tickets by Region by Status, Average Customer Rating by Region, Response Time by Region, and Channel Distribution by Region to understand geographic performance patterns
 Technician Performance
📁 Technician Performance Section – Track Tickets Assigned per Technician, Average Rating by Technician, Average Resolution Time by Technician, and Status Distribution by Technician for workforce optimization
 Data View
📁 Data View Section – Searchable and sortable detailed data table with pagination and CSV export for record-level analysis of all telecom tickets
 Telecommunications Dashboard in HTML
⚙️ How to Use the Telecommunications Dashboard in HTML
👉 Step 1: Upload or connect your telecom ticket dataset in the required format
👉 Step 2: Open the HTML dashboard file in any modern web browser
👉 Step 3: Use slicers to filter data by region, service type, priority, or status
👉 Step 4: Navigate through all five pages to analyze tickets, services, regions, technicians, and detailed records
👉 Step 5: Export detailed data from the Data View page for further reporting
💡 No complex setup or technical expertise required — just open, filter, and analyze!
👥 Who Can Benefit from This Telecommunications Dashboard in HTML
✔️ Telecom Operations Managers – Monitor ticket volumes, resolution rates, and escalation trends
✔️ Customer Service Leaders – Track response times, customer ratings, and complaint patterns
✔️ Regional Managers – Compare performance across different geographic locations
✔️ Technician Supervisors – Evaluate individual technician workload and efficiency
✔️ Business Analysts – Generate insights for strategic planning and service optimization
✔️ Telecom Consultants – Present professional analytics to clients instantly
Whether you manage mobile networks, broadband services, or enterprise telecom solutions, this Telecommunications Dashboard provides the visibility you need to make smarter, faster decisions.
📖 Click here to read the Detailed Blog Post
Watch the step-by-step video tutorial:


Reviews
There are no reviews yet.