Managing blood bank operations manually can quickly become overwhelming. From tracking inventory levels and storage duration to analyzing revenue and processing costs, handling everything in spreadsheets without structure leads to confusion and delays.
But what if you could monitor everything in one powerful and interactive dashboard?
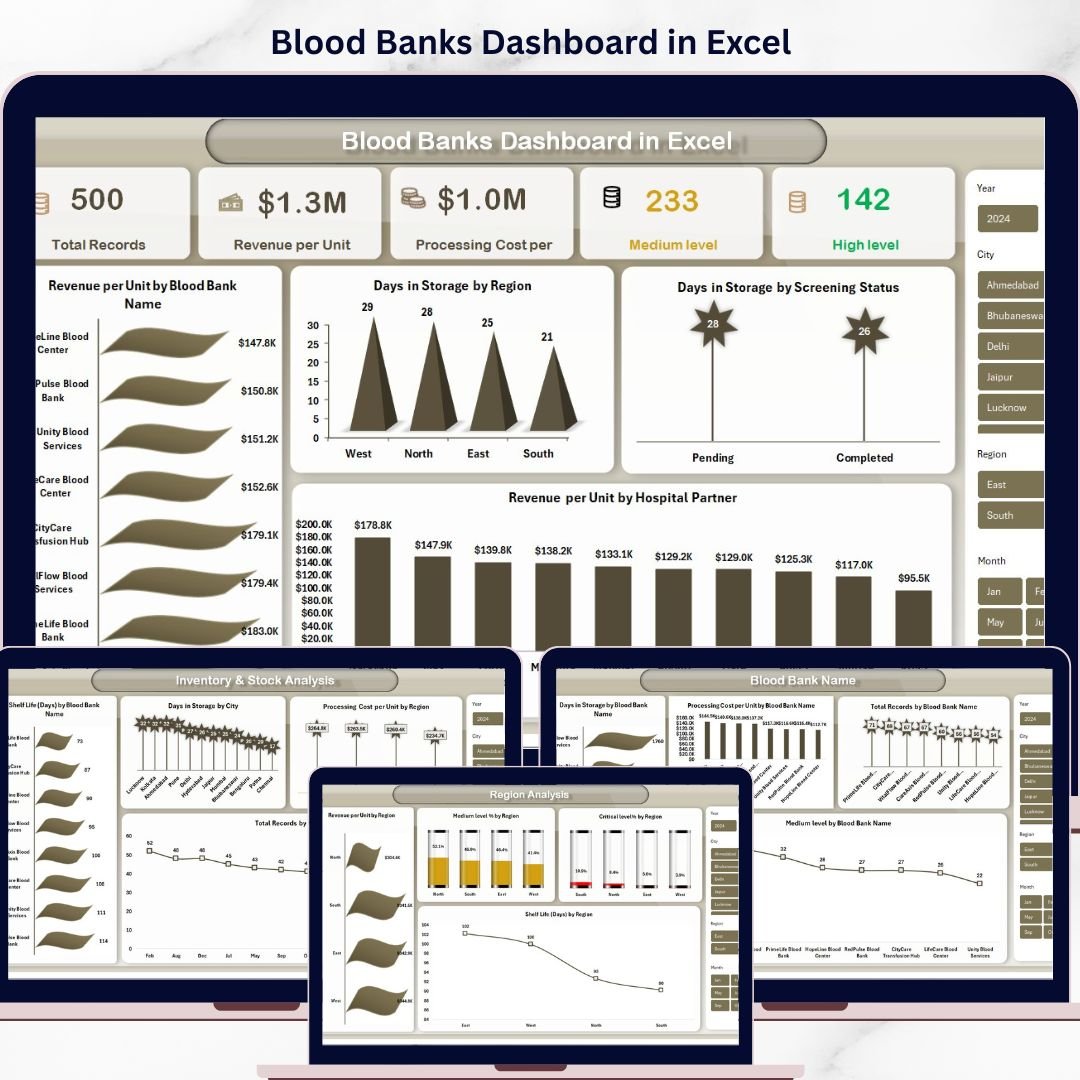
Introducing the Blood Banks Dashboard in Excel — a smart, ready-to-use solution designed to simplify blood bank data management and provide instant, actionable insights. 🚀
This dashboard transforms complex datasets into visually appealing reports. With just a simple data update and refresh, you can instantly analyze key performance metrics across blood banks, regions, and time periods. As a result, decision-making becomes faster, easier, and more accurate.
Whether you are managing a single blood bank or multiple locations, this dashboard helps you stay in control of your operations without the need for expensive software.
🚀 Key Features of Blood Banks Dashboard in Excel
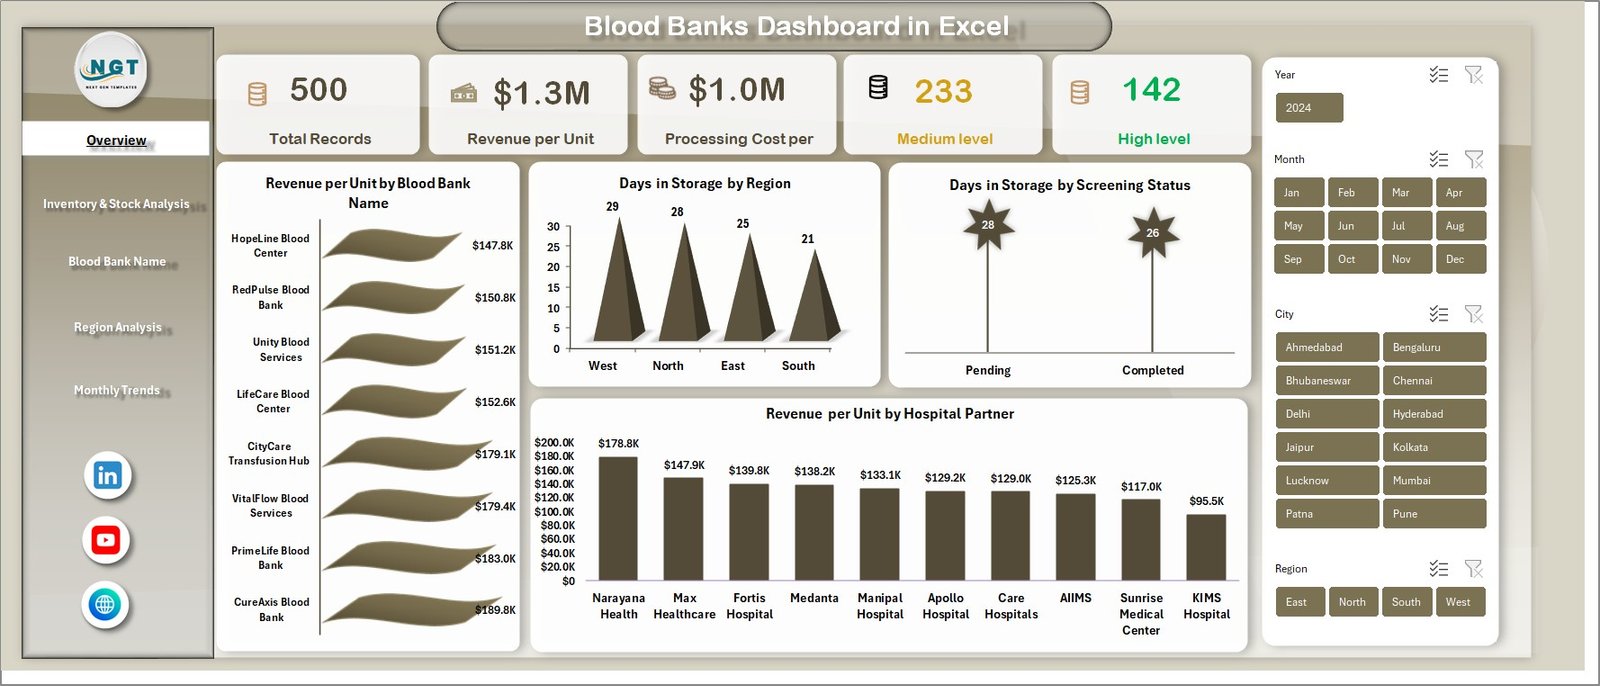
📊 Dynamic KPI Cards for Instant Insights
Track Total Records, Revenue per Unit, Processing Cost, and urgency levels at a glance.
📈 Interactive and Visual Charts
Analyze trends like storage duration, revenue distribution, and cost variations across regions and blood banks.
🎯 Advanced Filtering with Slicers
Quickly filter data by region, blood bank, screening status, or time period for deeper insights.
⚡ One-Click Data Refresh
Simply update the data sheet and hit refresh to instantly update all dashboard visuals.
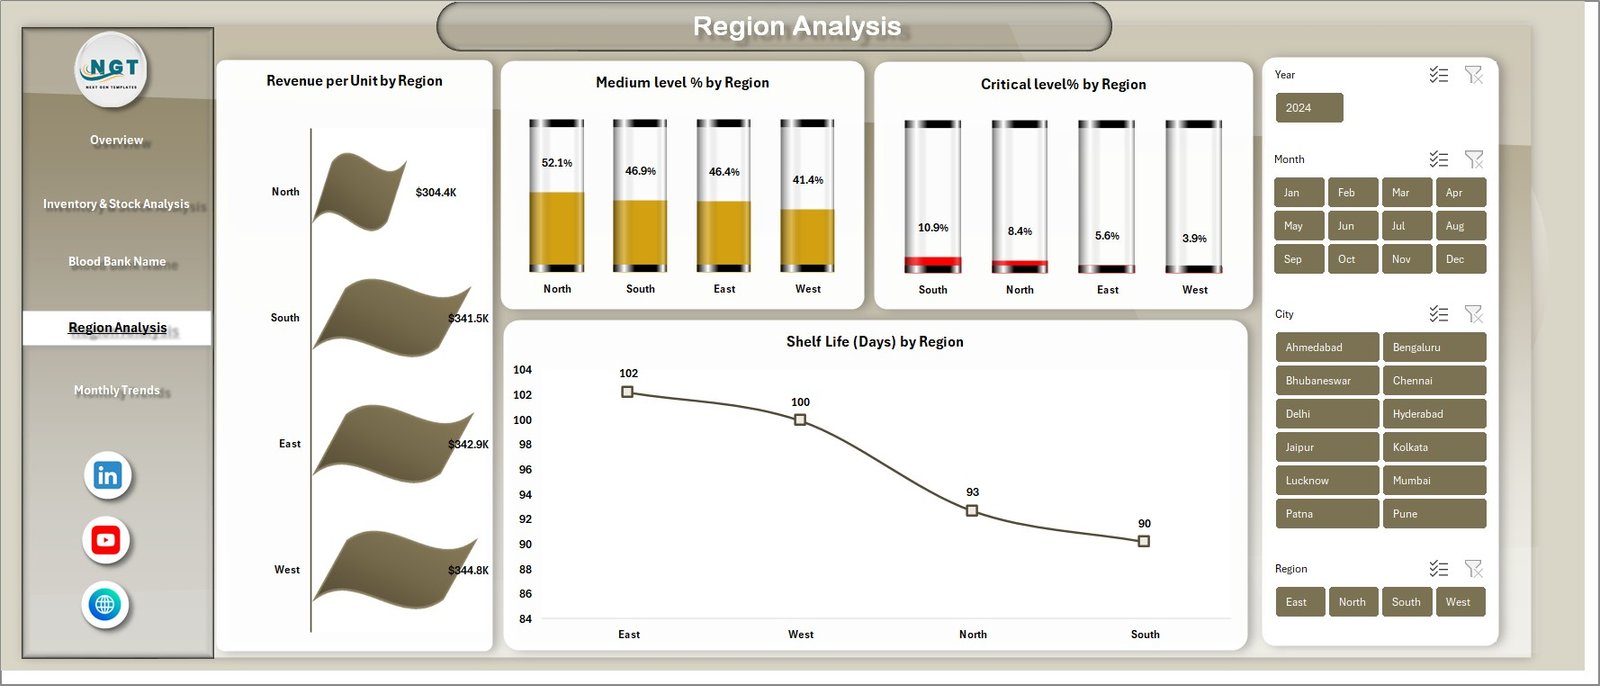
🧩 Multi-Page Analytical View
Includes Overview, Inventory Analysis, Region Analysis, Monthly Trends, and more.
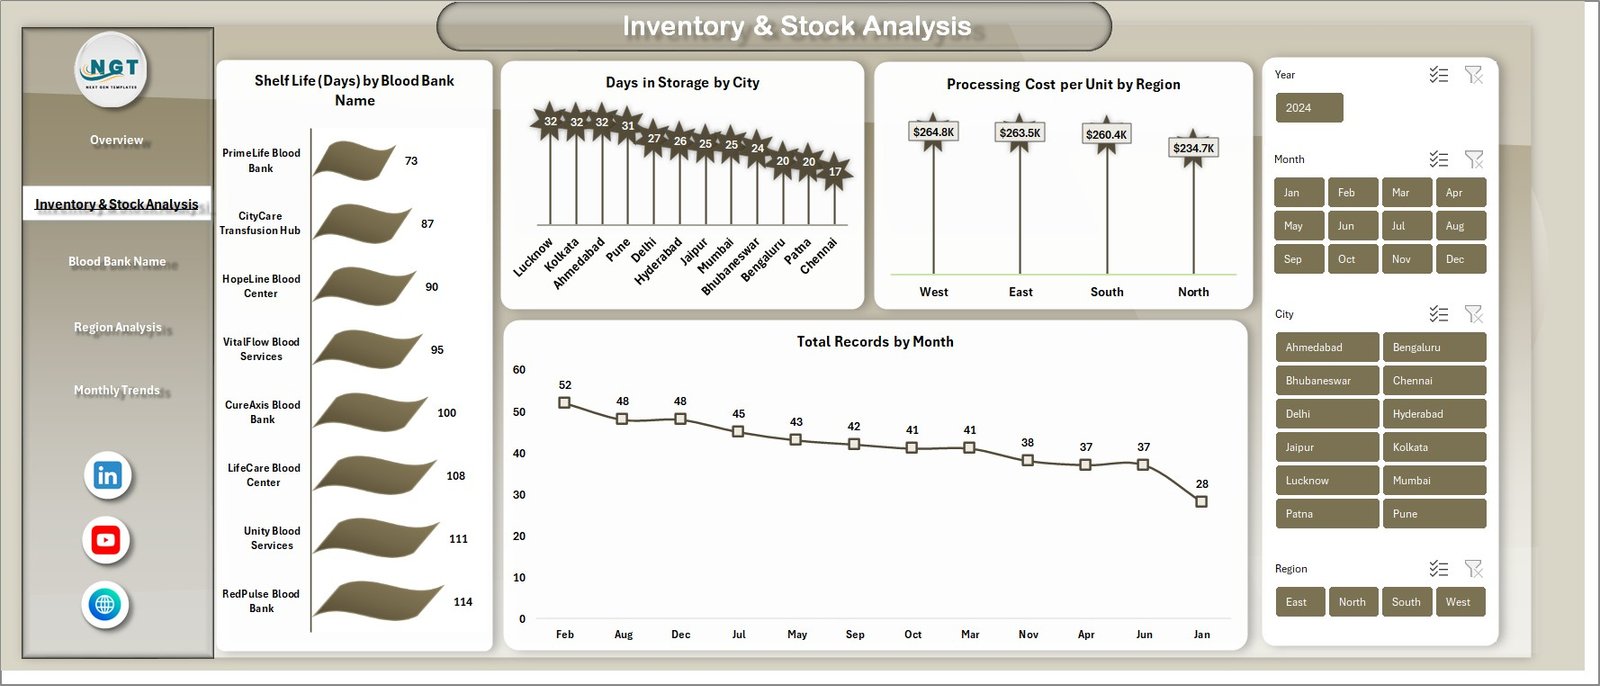
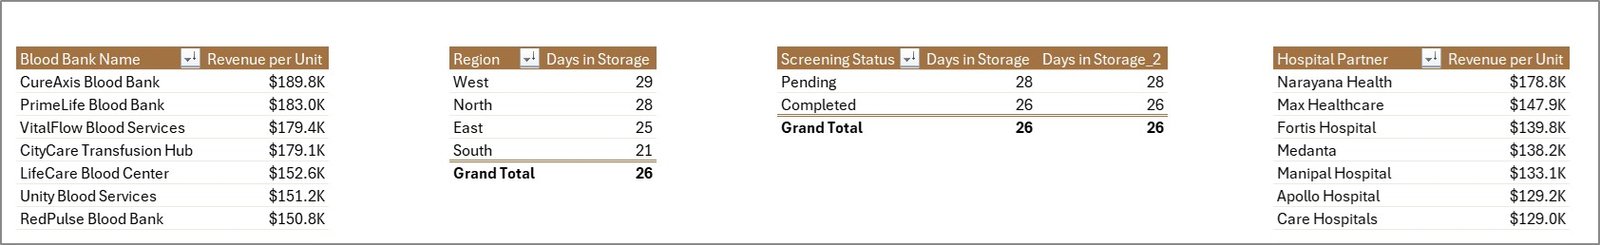
💡 Comprehensive Data Analysis
Understand performance across hospital partners, cities, and individual blood banks.
🔄 Fully Customizable Dashboard
Easily adapt the dashboard to match your specific operational or reporting needs.

📦 What’s Inside the Blood Banks Dashboard in Excel
📁 7 Structured Worksheets
Includes Overview, Inventory Analysis, Blood Bank Analysis, Region Analysis, Monthly Trends, Data Sheet, and Support Sheet.
📊 Pre-Built Pivot Tables & Charts
Ready-to-use visuals for quick and efficient analysis.
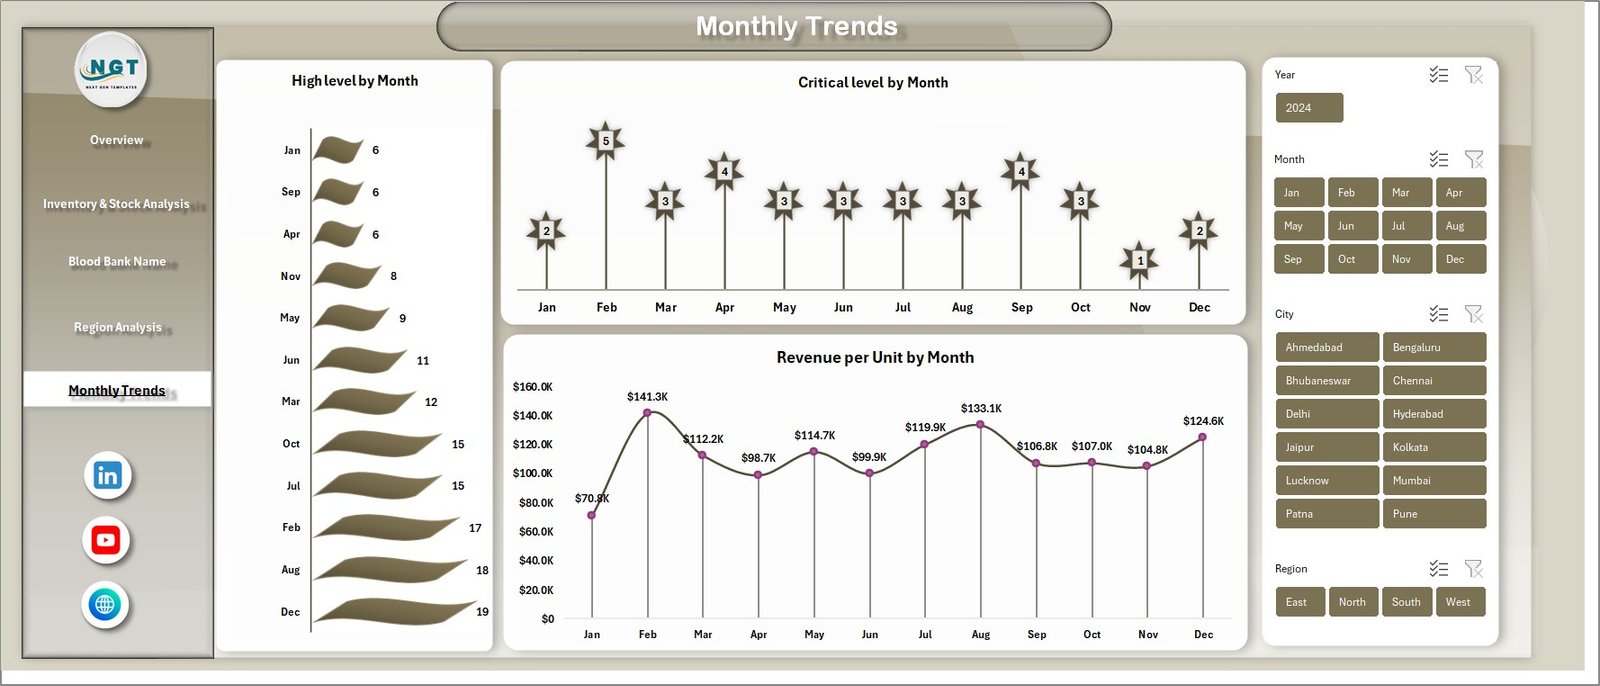
📅 Time-Based Trend Analysis
Track monthly performance, critical levels, and storage patterns.
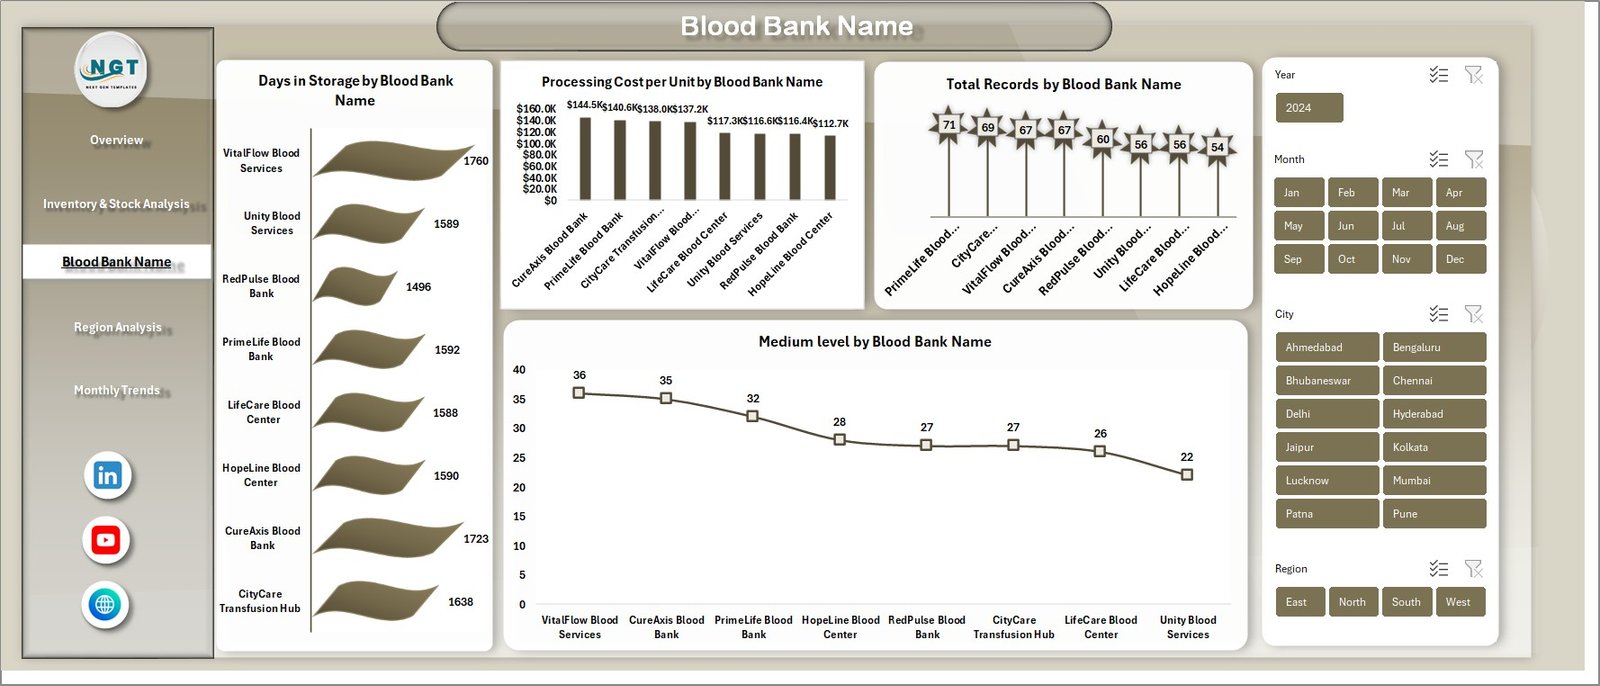
📍 Region & City-Level Insights
Identify regional trends and optimize operations accordingly.
🗂️ Backend Data Sheet
A structured data entry sheet where all inputs are managed.
⚙️ Support Sheet (Hidden)
Contains pivot tables powering the entire dashboard for seamless functionality.
🛠️ How to Use the Blood Banks Dashboard in Excel
1️⃣ Enter your data into the Data Sheet in the required format.
2️⃣ Go to the Excel ribbon and click on Data → Refresh All.
3️⃣ Watch the dashboard automatically update with the latest insights.
4️⃣ Use slicers and filters to drill down into specific data points.
5️⃣ Analyze trends and make informed decisions instantly.
No advanced Excel skills are required — everything is designed to be simple and user-friendly. 😊
👨⚕️ Who Can Benefit from This Blood Banks Dashboard in Excel
🏥 Blood Bank Managers looking to track inventory and performance
📊 Healthcare Analysts who need detailed operational insights
🏢 Hospital Administrators managing multiple blood bank partnerships
📈 Data Analysts working on healthcare datasets
🎓 Students & Professionals learning Excel dashboarding
💼 Organizations aiming to improve efficiency and decision-making
This dashboard is not just a reporting tool — it is a complete decision-making solution that helps you optimize inventory, reduce costs, and improve operational efficiency.
Stop wasting hours on manual reporting and start making smarter decisions with this powerful Excel dashboard. 💡
Click here to read the Detailed blog post
Watch the step-by-step video tutorial:
Visit our YouTube channel to learn step-by-step video tutorials


