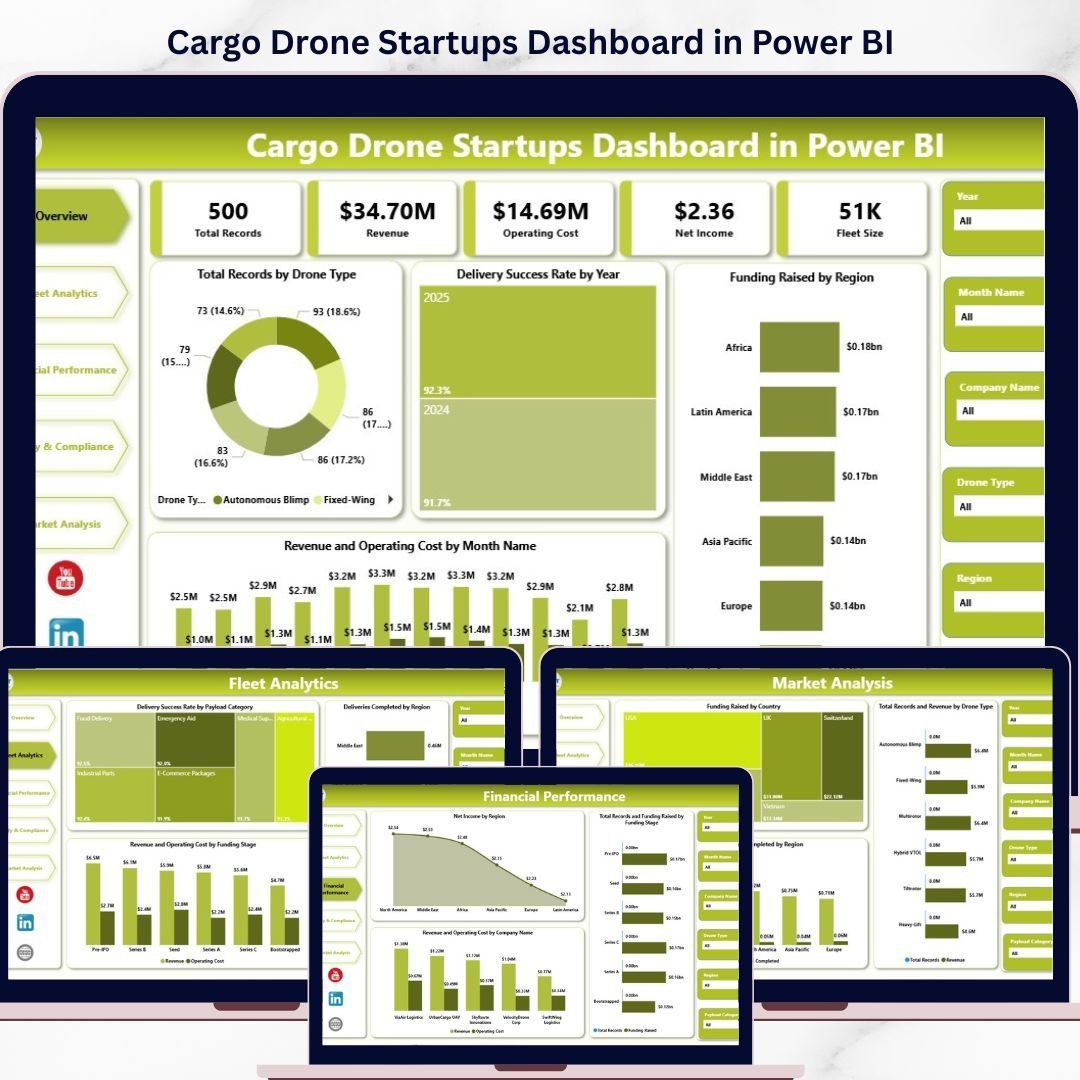


Key Features of Cargo Drone Startups Dashboard in Power BI
Elevate your cargo drone startup analytics with this Cargo Drone Startups Dashboard in Power BI, designed to provide actionable insights at a glance. This ready-to-use Power BI dashboard allows you to seamlessly update your data file and refresh the dashboard to instantly visualize the latest metrics. Experience a comprehensive view of your startup’s performance through multiple interactive pages, each tailored to critical aspects of your business.
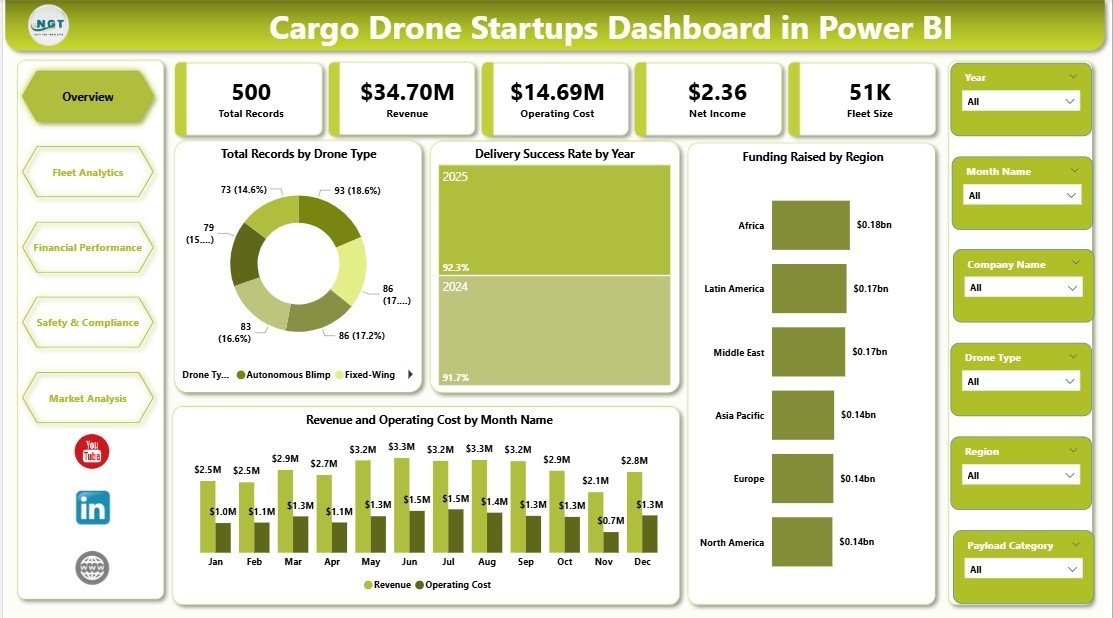
On the Overview Page, you will find essential cards displaying Total Records, Revenue, Operating Cost, Net Income, and Fleet Size, giving you a high-level snapshot of your operations. Interactive charts include Total Records by Drone Type, Delivery Success Rate by Year, Funding Raised by Region, and Revenue & Operating Cost by Month, all equipped with slicers for quick filtering and personalized data views.
The Fleet Analytics sheet dives deeper into operational efficiency, highlighting Delivery Success Rate by Payload Category, Deliveries Completed by Region, and Revenue & Operating Cost by Funding Stage. These insights empower you to optimize fleet performance and identify growth opportunities.
Financial Performance analysis covers Net Income by Region, Total Records and Funding Raised by Funding Stage, and Revenue & Operating Cost by Company Name. This page is essential for investors and management to assess financial health and funding impact.
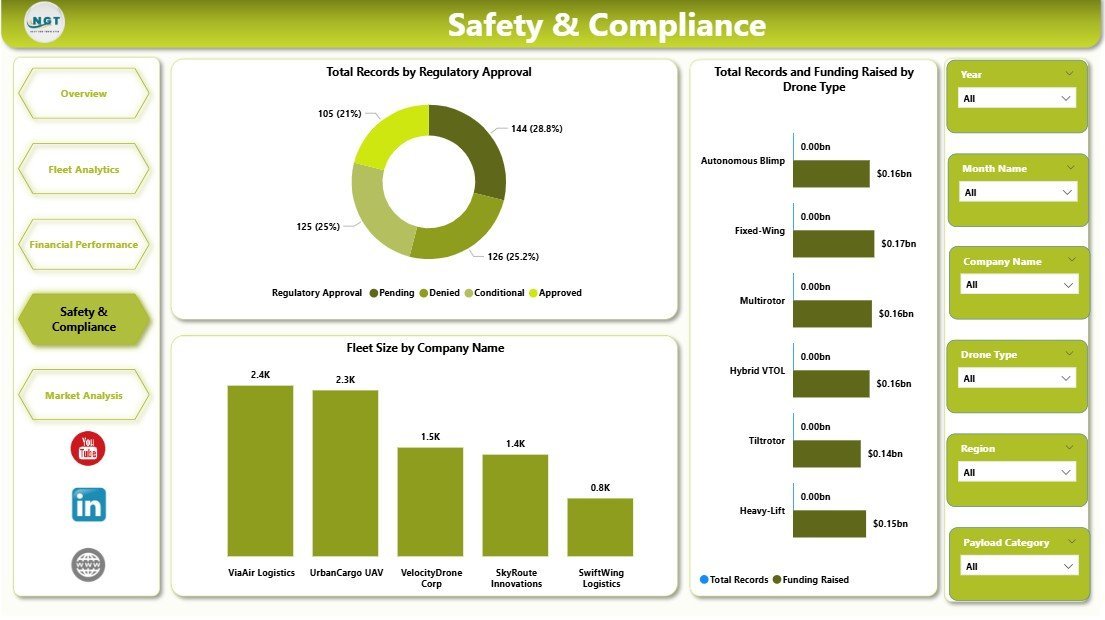
Safety and Compliance focuses on regulatory aspects, with charts showcasing Total Records by Regulatory Approval, Total Records & Funding Raised by Drone Type, and Fleet Size by Company Name, ensuring your startup remains compliant and ready for scaling.
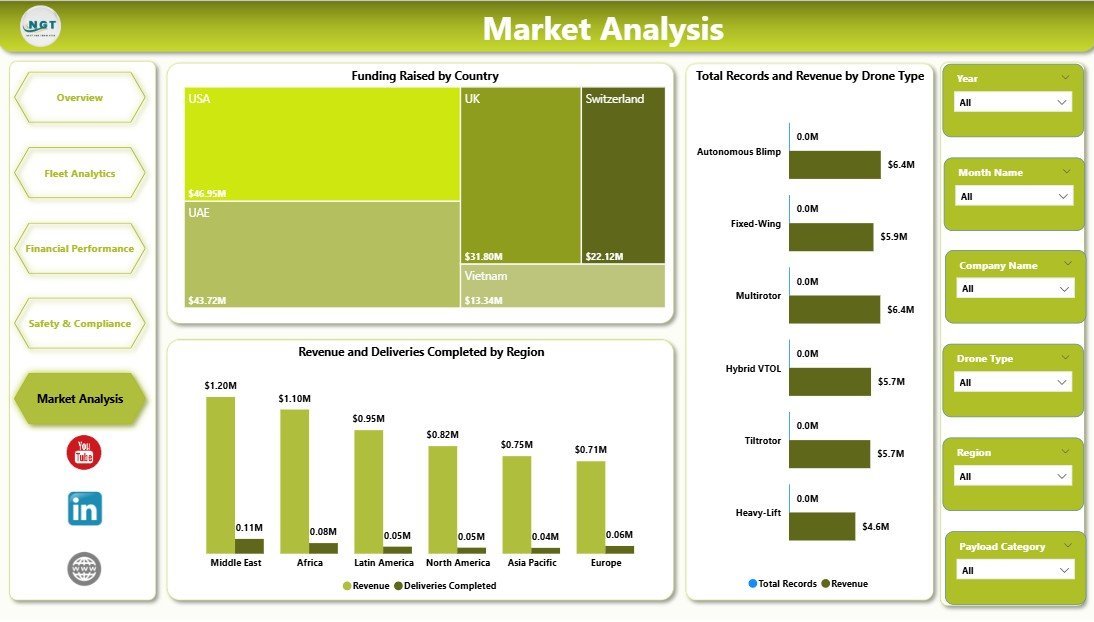
The Market Analysis page provides a competitive edge through Funding Raised by Country, Total Records & Revenue by Drone Type, and Revenue & Deliveries Completed by Region, enabling strategic market positioning and expansion planning.
What’s Inside the Cargo Drone Startups Dashboard in Power BI
This digital product includes a fully interactive Power BI (.pbix) dashboard file along with a data source file. The dashboard encompasses five dynamic pages – Overview, Fleet Analytics, Financial Performance, Safety and Compliance, and Market Analysis – each crafted to present vital metrics and trends through visually appealing charts and cards. With multiple slicers and filters, you can quickly customize your views to focus on specific timeframes, regions, drone types, or funding stages. The dashboard supports easy data updates: simply replace the data file and refresh the Power BI report to keep your insights current.

Cargo Drone Startups Dashboard in Power BI
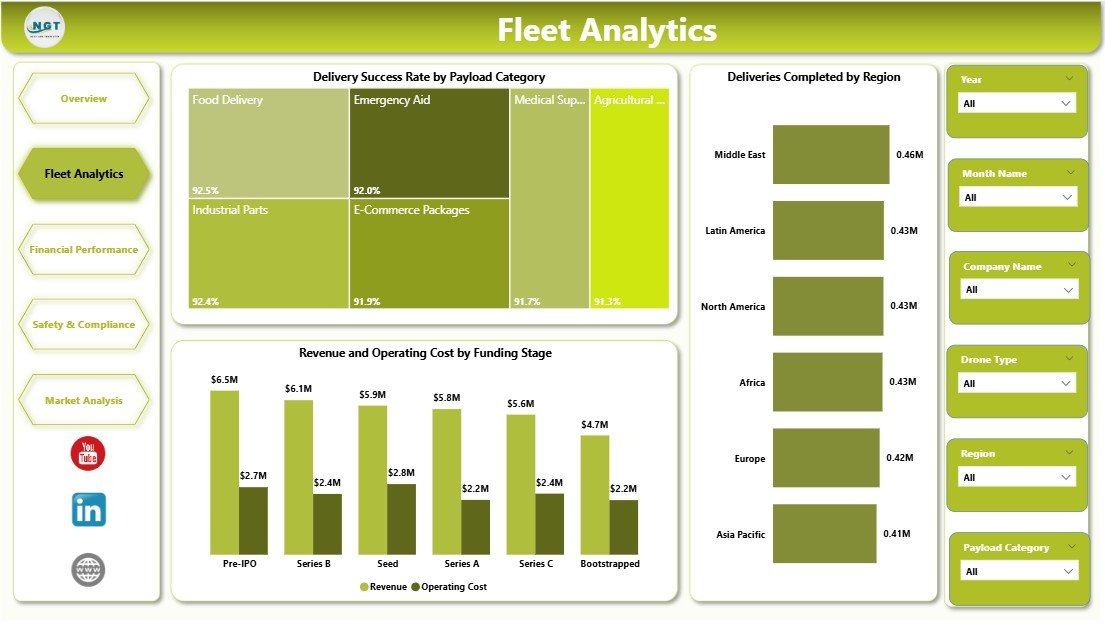
Fleet Analytics in Cargo Drone Startups Dashboard
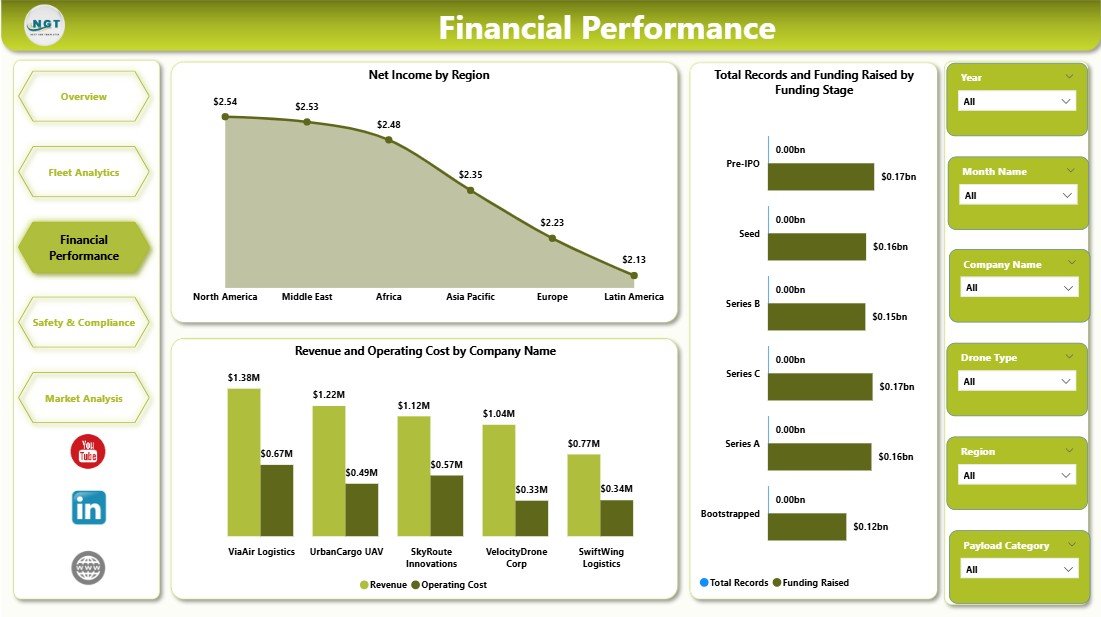
Financial Performance in Cargo Drone Startups Dashboard

Safety and Compliance in Cargo Drone Startups Dashboard

Market Analysis in Cargo Drone Startups Dashboard
How to Use the Cargo Drone Startups Dashboard in Power BI
Using this dashboard is straightforward and efficient, designed for users of all skill levels. Start by updating the provided data file with your latest records, revenues, costs, and other key metrics. Then, connect the updated data file to the Power BI dashboard and simply click the Refresh button from the Home tab within Power BI. Your dashboard will instantly update with fresh insights. Navigate through the different tabs to explore various aspects of your cargo drone startup, such as fleet analytics, financial performance, and market trends. Use the intuitive slicers and filters to drill down into specific time periods, regions, or drone types for customized analysis. This hands-on approach allows you to quickly identify strengths, weaknesses, and opportunities in your business.
Who Can Benefit from This Cargo Drone Startups Dashboard in Power BI
This dashboard is an invaluable tool for a variety of stakeholders in the cargo drone industry, including:
🚀 Startup Founders & CEOs: Gain a comprehensive overview of operational and financial metrics to make data-driven strategic decisions.
📊 Data Analysts & Business Intelligence Teams: Leverage the detailed analytics and customizable filters to generate insightful reports.
💼 Investors & Venture Capitalists: Quickly assess funding impact, revenue trends, and growth potential across regions and funding stages.
🚁 Fleet Managers: Monitor delivery success rates, payload categories, and fleet size to optimize operational efficiency.
⚖️ Compliance Officers: Track regulatory approvals and ensure your startup meets all safety and legal requirements.
🌍 Market Strategists: Analyze market penetration and funding by country to identify expansion opportunities.
Whether you’re launching a new cargo drone startup or scaling an existing business, this Power BI dashboard offers the insights needed to drive success in a competitive market.
Click here to read the Detailed blog post.
Visit our YouTube channel to learn step-by-step video tutorials.


Reviews
There are no reviews yet.