The renewable energy sector moves fast, and performance matters more than ever. Whether you manage solar farms, wind energy projects, hydroelectric plants, or other clean energy operations, you need a reliable way to measure results, control inefficiencies, and stay aligned with sustainability goals. However, when KPI data is spread across multiple files and manual reports, it becomes difficult to identify issues quickly. As a result, performance gaps remain hidden, reporting takes longer, and decision-making becomes less effective. That is why the Renewable Energy KPI Scorecard in Google Sheets is such a smart and practical solution.
This ready-to-use scorecard helps renewable energy companies track, analyze, and improve performance in one centralized Google Sheets dashboard. Instead of spending hours compiling reports, you can monitor monthly and yearly KPI performance, compare actual results against targets, review trends, and highlight areas that need attention. Moreover, this scorecard transforms raw operational data into clear visual insights using traffic light indicators, trend arrows, and dynamic comparisons. If you want a simple yet powerful way to improve energy performance, strengthen reporting, and support smarter decisions, this scorecard is the perfect fit for your business.
Key Feature of Renewable Energy KPI Scorecard in Google Sheets
🌱 Interactive KPI Scorecard for Renewable Energy Operations
This scorecard is designed to help renewable energy organizations monitor critical KPIs related to production, efficiency, and sustainability in a structured format.
📅 Dynamic Monthly Selection
At the top of the scorecard, users can select any month from a dropdown. Once selected, the entire dashboard updates automatically, making monthly analysis faster and easier.
📊 MTD and YTD Performance Analysis
Track both MTD (Month-to-Date) and YTD (Year-to-Date) KPI values so you can evaluate short-term progress and long-term annual performance together.
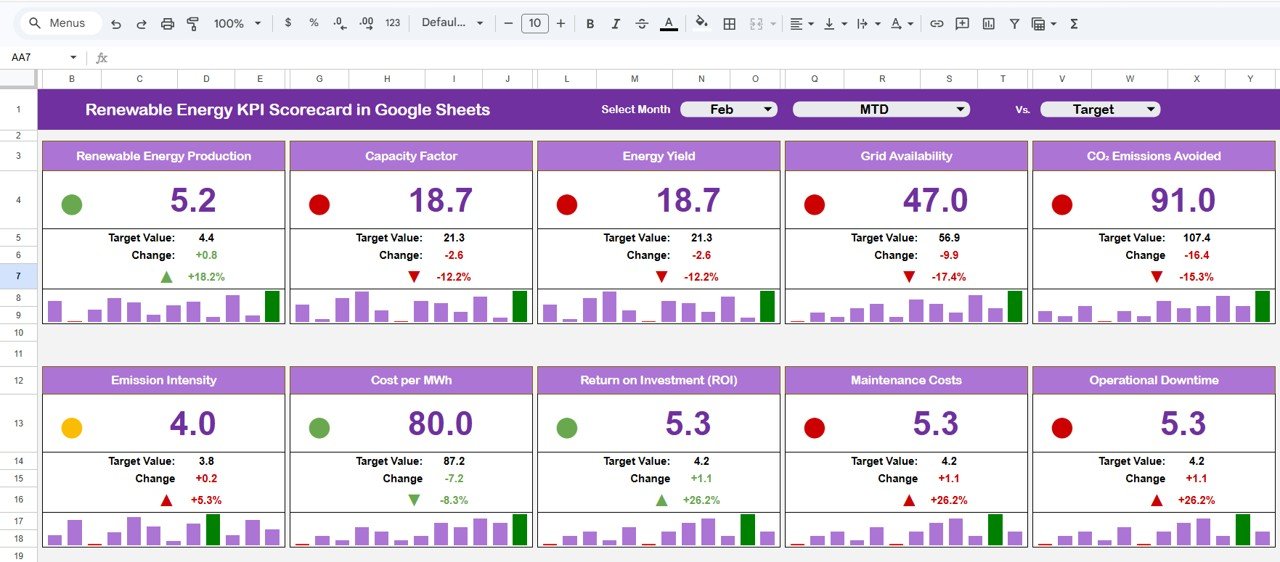
🚦 Traffic Light Performance Indicators
The dashboard uses intuitive color-coded indicators to show KPI status clearly:
🟢 Green for target achieved
🟡 Yellow for near target
🔴 Red for target missed
📈 Up and Down Trend Arrows
Quickly identify whether performance is improving or declining with trend indicators:
▲ Up Arrow for improvement
▼ Down Arrow for decline
📉 Dedicated KPI Trend Sheet
The scorecard includes a KPI Trend Sheet with a dropdown in Cell C3 that allows you to select and analyze individual KPIs in more detail.
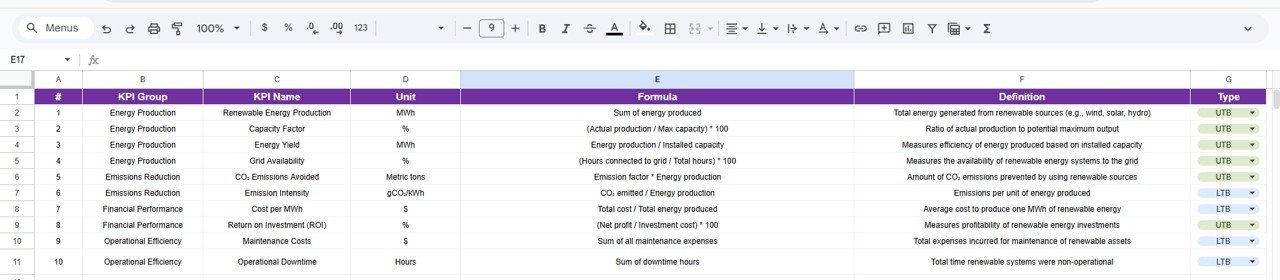
📘 Detailed KPI Definition Sheet
All KPIs are clearly documented with KPI name, group, unit, formula, and definition so users can understand exactly what each metric means.
📊 Easy Data Input Sheet
A dedicated data input sheet allows users to enter raw KPI values in a simple structure. As a result, updates become faster, and reporting errors reduce significantly.
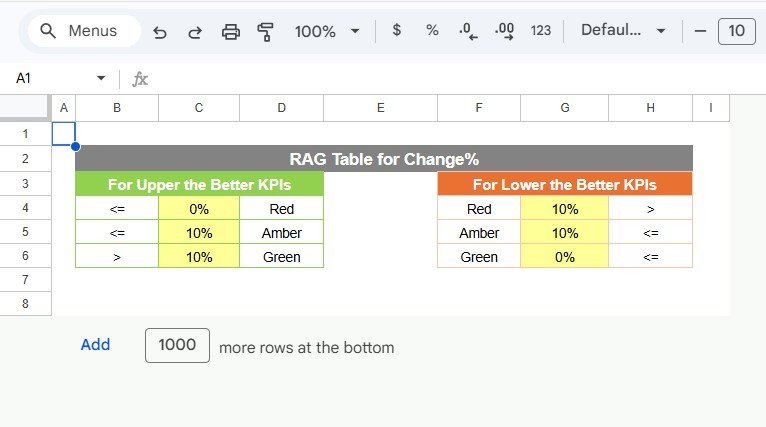
🎨 Customizable Color Settings
You can adjust color indicators based on performance thresholds, making the scorecard more flexible for different renewable energy business needs.
☁️ Google Sheets Based for Team Collaboration
Because it is built in Google Sheets, multiple team members can update and review data in real time from anywhere.
What’s Inside the Renewable Energy KPI Scorecard in Google Sheets
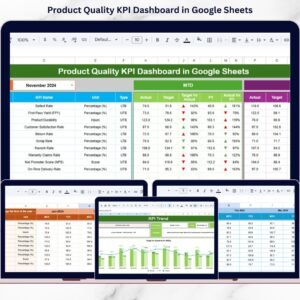
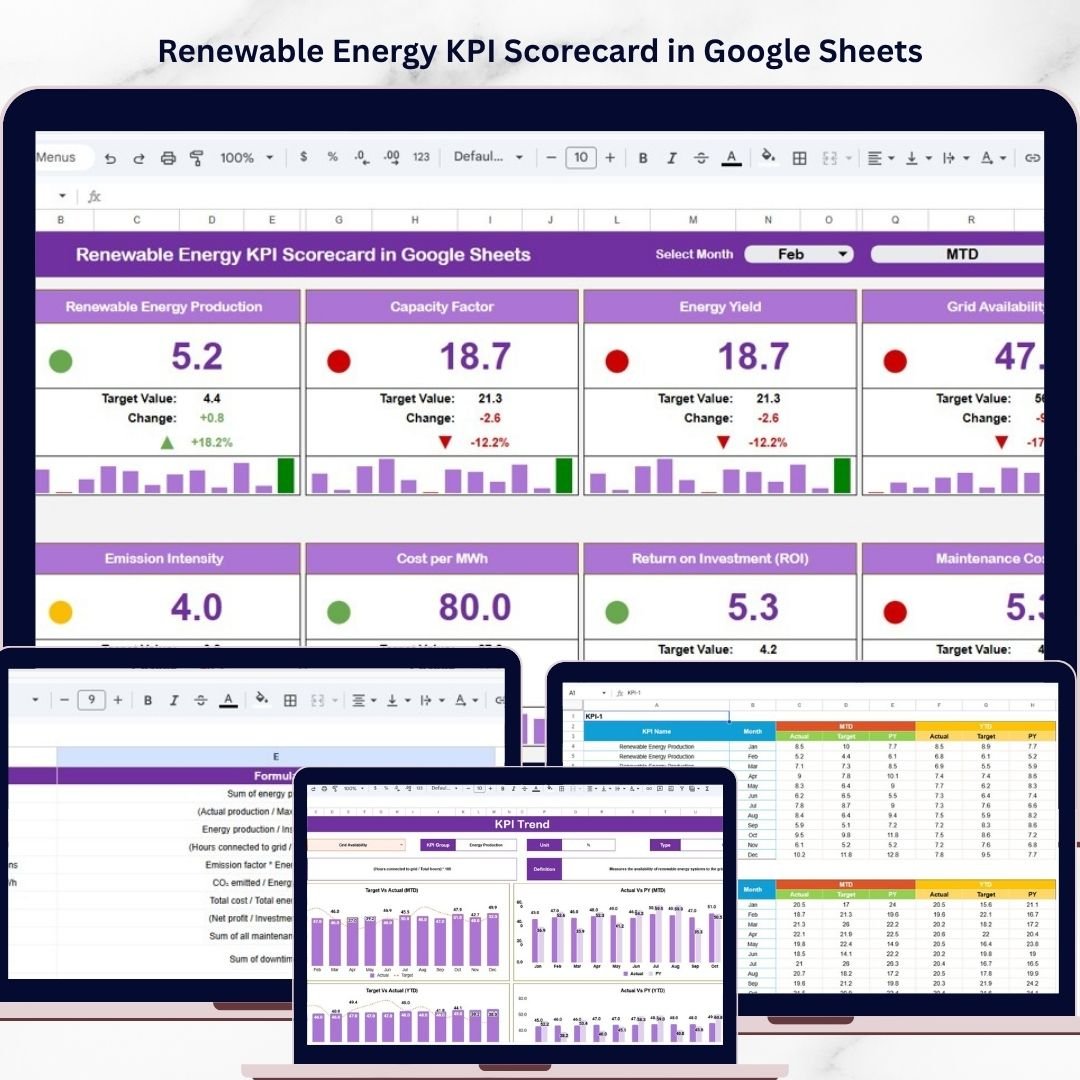
📌 Main KPI Scorecard Dashboard
This is the central page where users can review selected month performance, compare actual vs target values, and monitor KPI status using traffic lights and trend arrows.
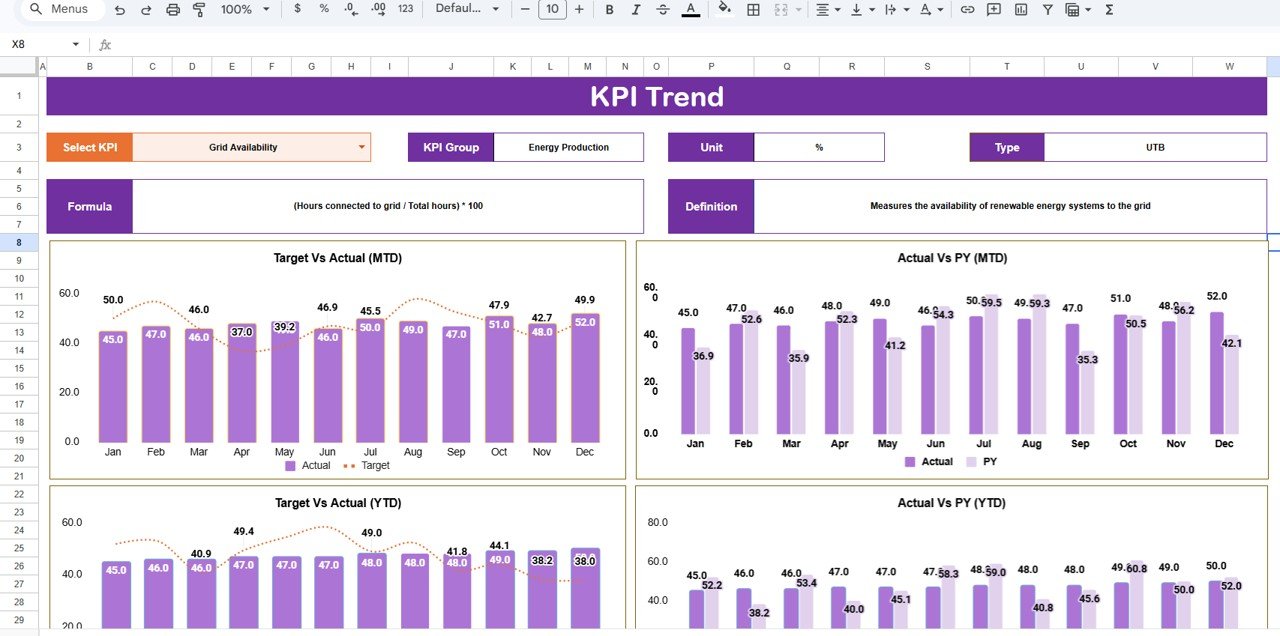
📈 KPI Trend Sheet
This sheet gives users deeper analysis of individual KPIs. It includes KPI selection, KPI group, category, unit, and KPI type such as lower the better or higher the better.
📘 KPI Definition Sheet
This sheet contains the master KPI reference with KPI names, groups, units, formulas, and definitions for better understanding and consistency.
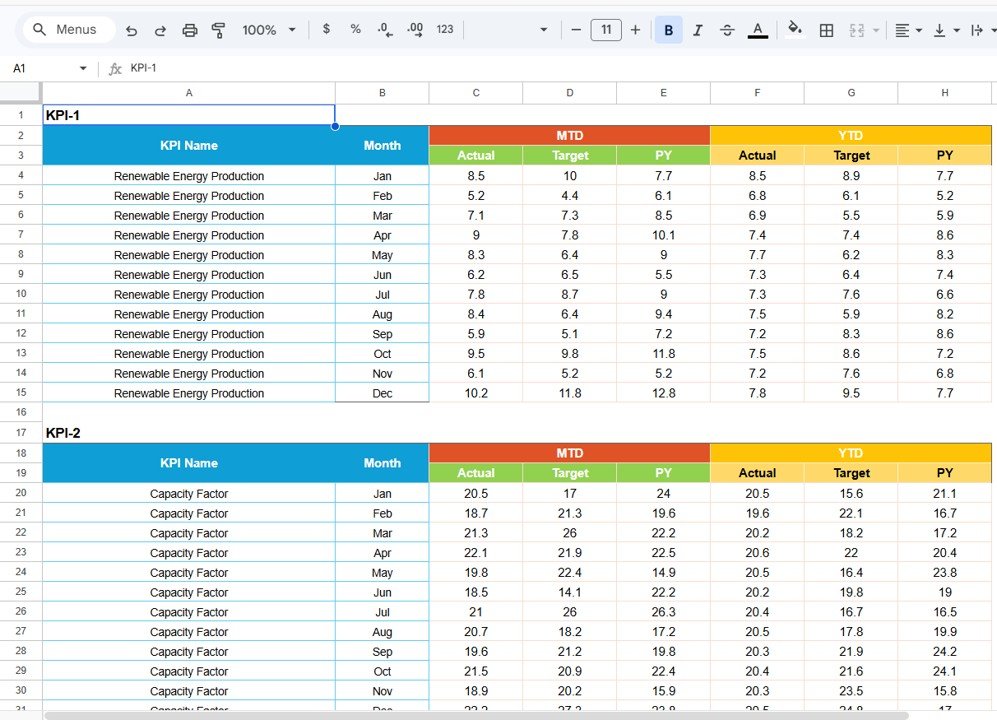
📊 Data Input Sheet
This sheet stores raw performance data and feeds the scorecard automatically, making updates simple and organized.
🎨 Color Settings Area
Users can define and manage performance color thresholds to match internal reporting standards.
How to Use the Renewable Energy KPI Scorecard in Google Sheets
✅ Enter performance data in the Data Input Sheet
✅ Maintain KPI names, groups, formulas, and definitions in the KPI Definition Sheet
✅ Select the desired month from the dropdown at the top of the scorecard
✅ Review MTD and YTD performance instantly
✅ Compare actual vs target values to measure achievement
✅ Use traffic lights and trend arrows to identify strong and weak areas quickly
✅ Open the KPI Trend Sheet for deeper metric analysis
✅ Use the insights to improve production efficiency, reduce losses, and support sustainability goals
This structured workflow makes performance monitoring easier for both daily review and long-term planning.
Who Can Benefit from This Renewable Energy KPI Scorecard in Google Sheets
⚡ Renewable Energy Companies that want better control over operational performance
☀️ Solar Farm Managers who need to monitor output and efficiency
🌬️ Wind Energy Teams who want to track project performance more effectively
💧 Hydroelectric Plant Operators who need structured KPI reporting
📊 Business Analysts who want visual and organized performance tracking
👨💼 Management Teams who need quick insights for faster decision-making
🌍 Sustainability Teams who want to measure performance against environmental goals
This scorecard is ideal for organizations that want to improve renewable energy performance with a simple, collaborative, and cost-effective tool.
Click hare to read the Detailed blog post
Read the detailed blog post to explore the full scorecard structure, key features, business benefits, and best practices in depth.
Visit our YouTube channel to learn step-by-step video tutorials
Watch step-by-step tutorials, dashboard walkthroughs, and practical reporting ideas to get more value from your Google Sheets dashboards.