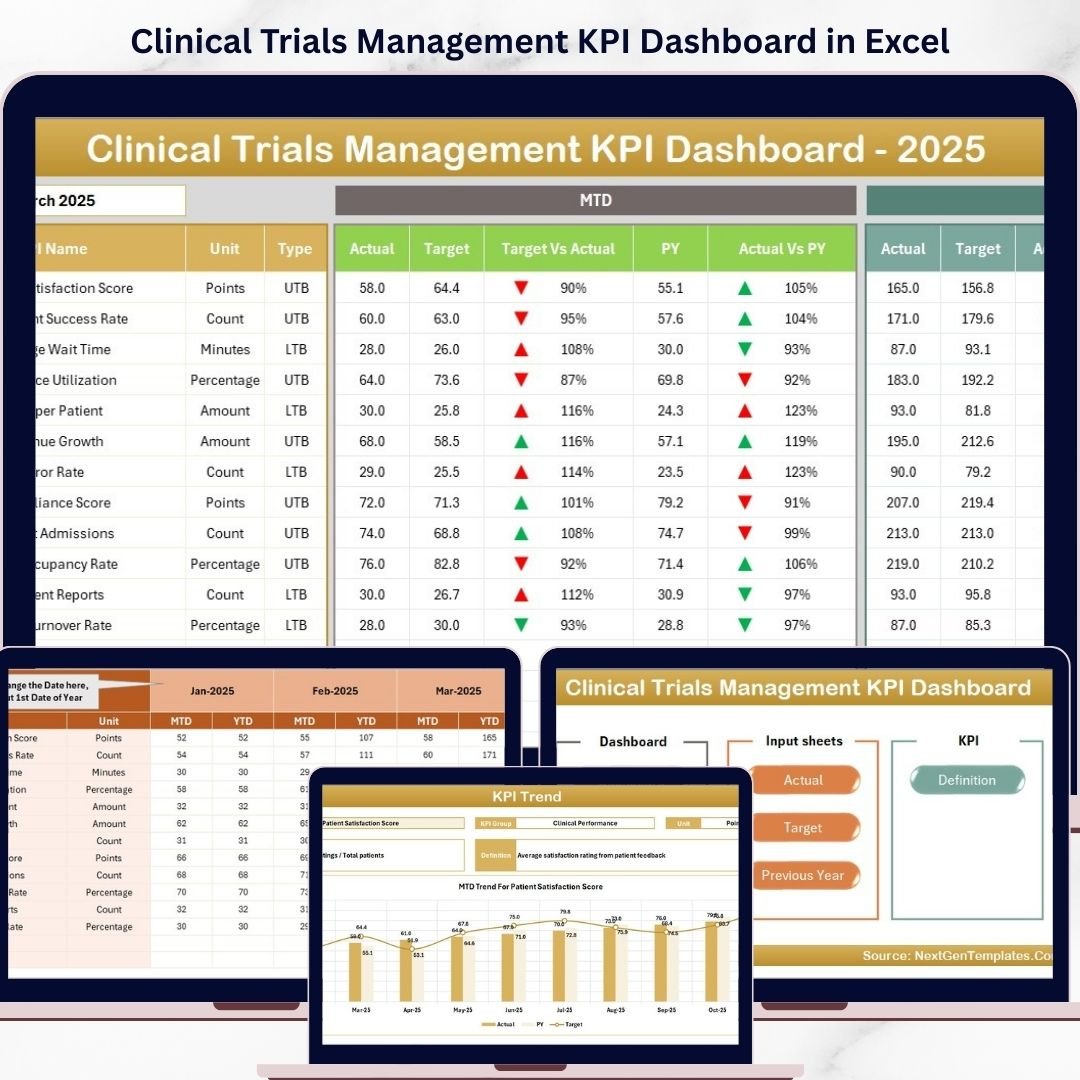
Key Features of Clinical Trials Management KPI Dashboard
Unlock the power of data-driven decision-making with our Clinical Trials Management KPI Dashboard, specifically designed to streamline and optimize your clinical trial operations. This comprehensive digital tool offers seven meticulously crafted worksheets that cover everything from data input to detailed KPI analysis, giving you full control and oversight of your clinical trial metrics.
✨ Home Sheet: The user-friendly index page with 6 intuitive navigation buttons to seamlessly access all sections of the dashboard. It’s your central hub for quick and efficient management.
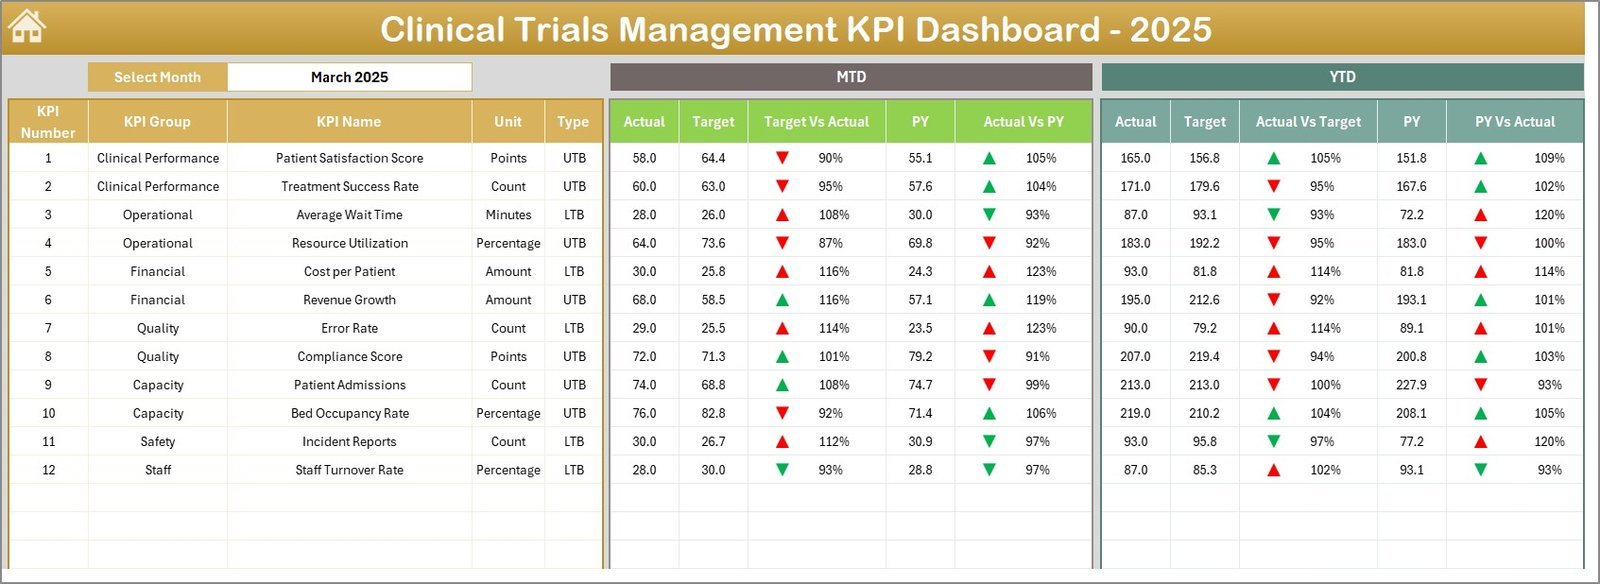
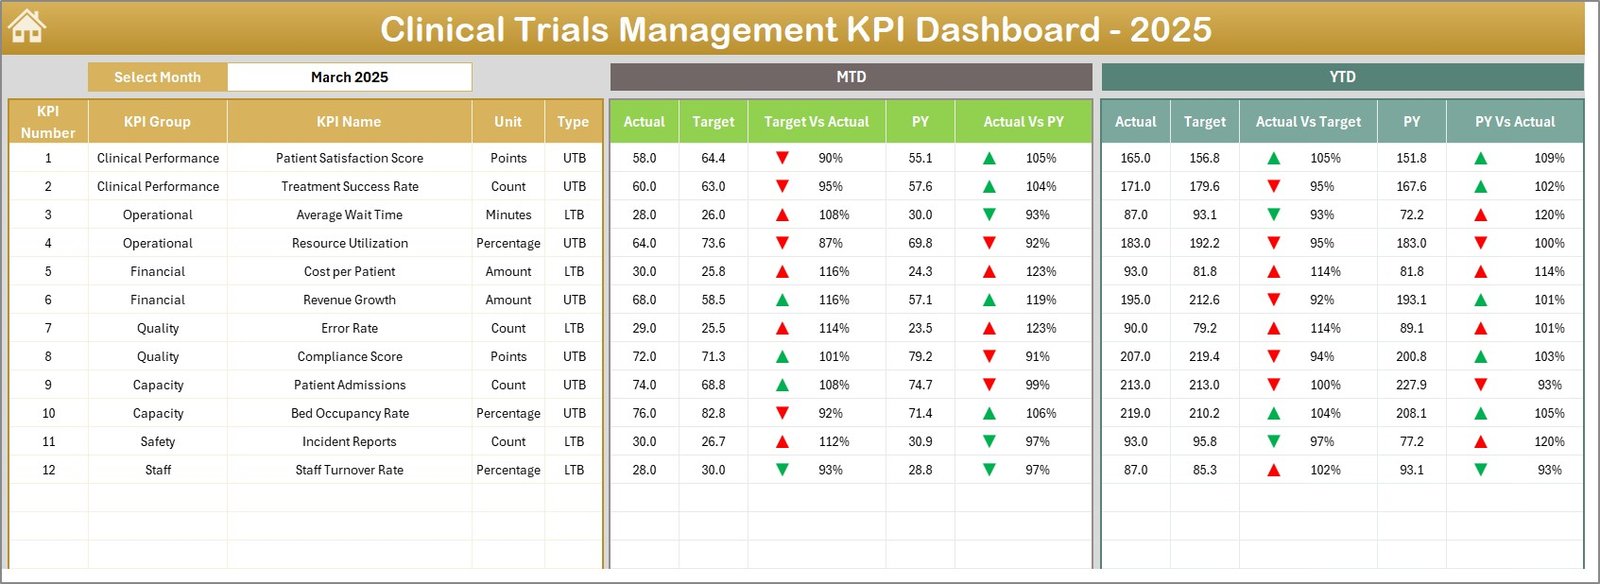
📊 Dashboard Sheet: The heart of the tool where all KPIs come to life. Easily select the month using the dropdown in cell D3 to instantly update all Key Performance Indicators (KPIs) including MTD Actual, Target, Previous Year data, and dynamic comparisons with conditional formatting arrows for quick insights.
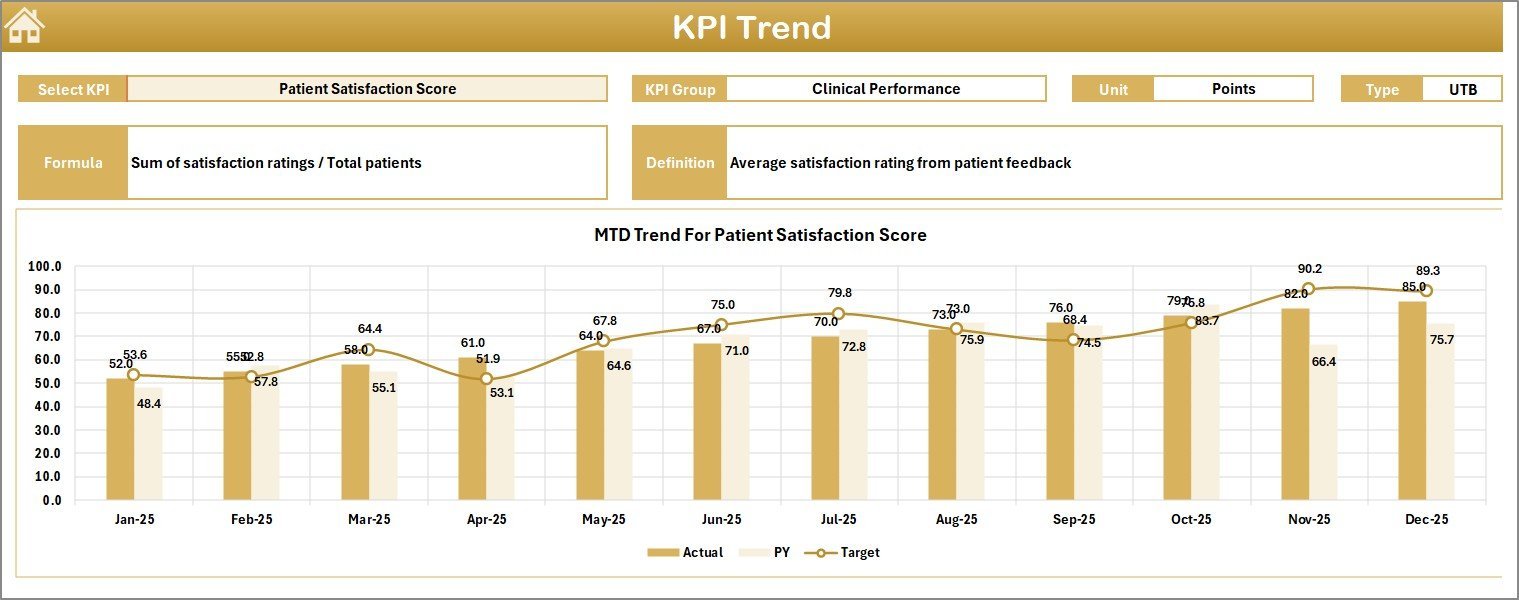
📈 KPI Trend Sheet: Deep dive into individual KPI trends with dropdown selection. View detailed KPI groups, units, types (Lower the Better or Upper the Better), formulas, definitions, and interactive charts showing MTD and YTD trends for Actual, Target, and Previous Year values.
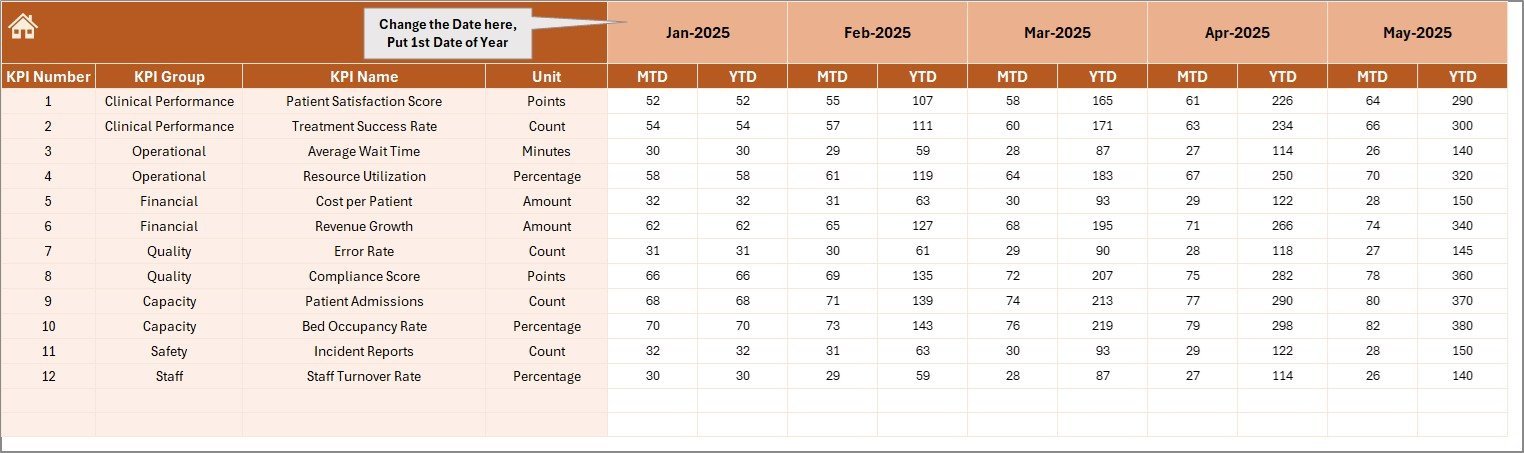
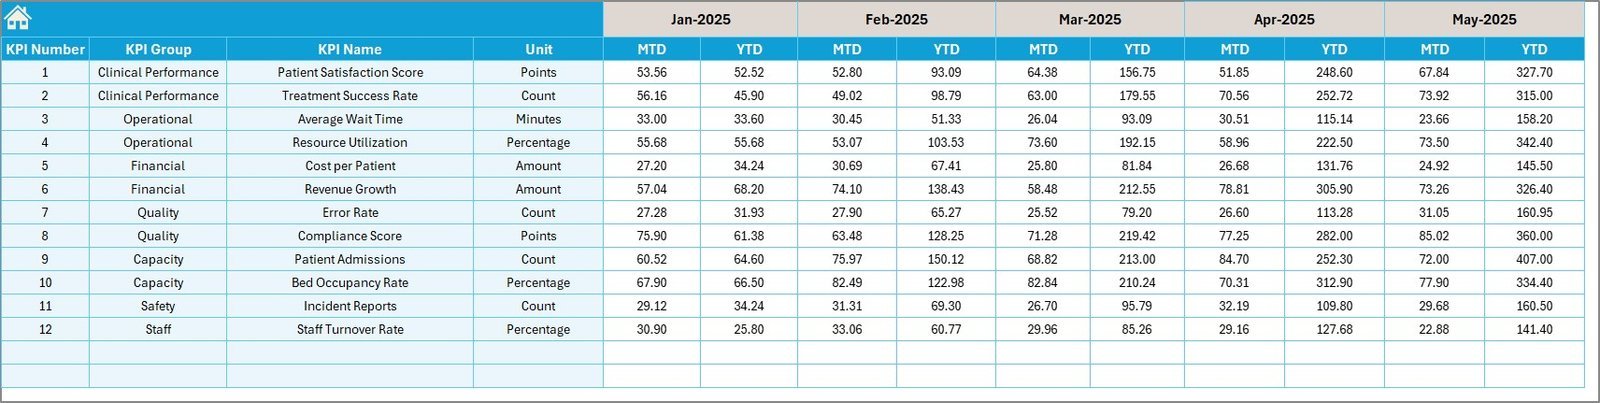
📝 Actual Numbers Input Sheet: Effortlessly input your monthly actual values for both MTD and YTD. Simply set the starting month in cell E1, and track your progress accurately throughout the year.
🎯 Target Number Input Sheet: Input and adjust your monthly KPI targets for MTD and YTD to align your team’s goals with real-time performance metrics.
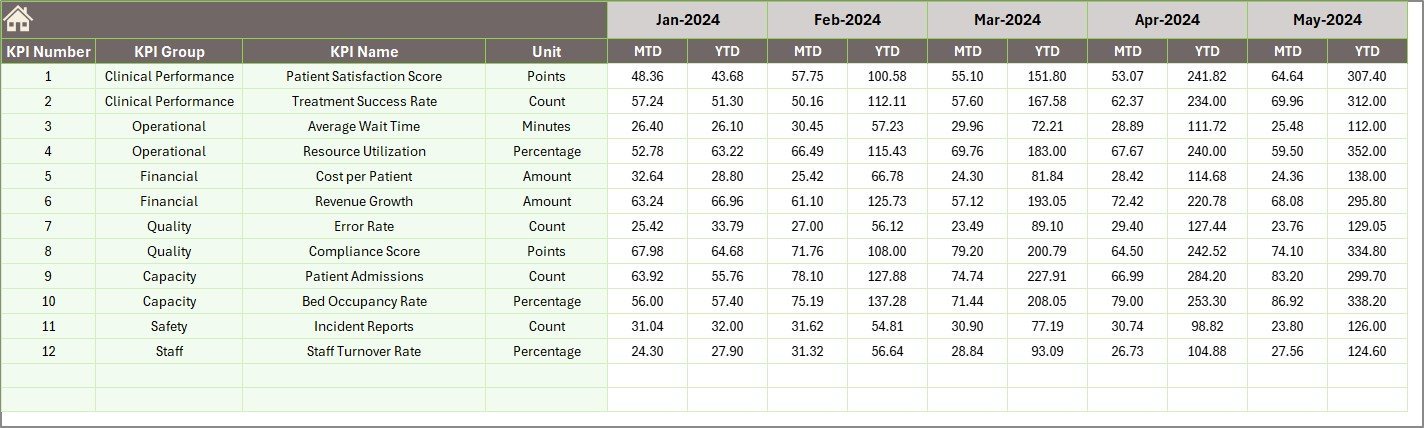
📅 Previous Year Number Sheet: Enter last year’s KPI numbers for benchmarking and comparative analysis to understand growth and areas needing improvement.
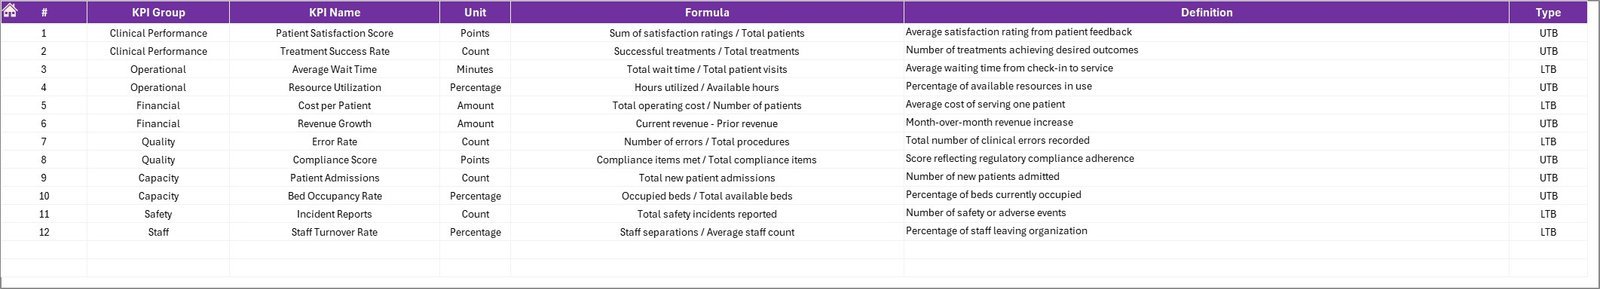
📚 KPI Definition Sheet: Maintain clarity with detailed KPI names, groups, units, formulas, and definitions. Specify KPI types as Lower the Better (LTB) or Upper the Better (UTB) to customize your performance targets.
What’s Inside the Clinical Trials Management KPI Dashboard
This digital product is a fully integrated Excel-based dashboard designed for clinical trial managers, analysts, and stakeholders needing a dynamic and interactive solution for KPI tracking. Inside, you get:
🌟 Seven fully functional and linked worksheet tabs providing comprehensive data input and visualization.
🌟 Interactive dropdowns for month and KPI selection enabling real-time data filtering and analysis.
🌟 Conditional formatting with intuitive up/down arrows for instant visual cues on KPI performance.
🌟 Trend charts that map MTD and YTD performance against targets and previous years to help identify patterns and actionable insights.
🌟 Clear KPI definitions to ensure everyone understands what metrics are being measured and how.
🌟 Easy to use input sheets for actual, target, and previous year data to keep your dashboard always up to date.
How to Use the Clinical Trials Management KPI Dashboard
Using this dashboard is straightforward and designed to save you time while maximizing insights.
🔹 Begin at the Home Sheet to navigate quickly to any section using the buttons provided.
🔹 Use the Actual Numbers Input Sheet to enter your current month’s actual clinical trial data. Set the starting month in cell E1 to align the timeline.
🔹 Enter your Target Numbers in the respective sheet to define your goals for each KPI, both MTD and YTD.
🔹 Input last year’s data in the Previous Year Number Sheet to benchmark current performance.
🔹 Visit the KPI Definition Sheet to verify or update KPI details and clarify the measurement criteria.
🔹 Return to the Dashboard Sheet to view all KPIs at a glance, filtered by month using the dropdown in cell D3, with visual indicators showing how well you’re tracking against your goals.
🔹 Explore the KPI Trend Sheet to analyze individual KPI performance trends and make informed decisions for improvement.
Who Can Benefit from This Clinical Trials Management KPI Dashboard
Whether you’re a clinical trial manager, data analyst, or executive overseeing clinical operations, this dashboard is tailored for you:
🧑⚕️ Clinical Trial Managers: Gain real-time visibility into trial performance metrics and streamline reporting.
📊 Data Analysts: Efficiently input, track, and analyze KPI data with dynamic visual tools.
🏥 Pharmaceutical Companies: Monitor critical trial KPIs to maintain timelines and budgets.
⚙️ Project Coordinators: Use clear dashboards to communicate progress and flag potential issues early.
📈 Executives & Stakeholders: Get concise, actionable insights through easy-to-understand dashboards.
Click here to read the Detailed blog post.
Visit our YouTube channel to learn step-by-step video tutorials and master your Clinical Trials Management KPI Dashboard.


Reviews
There are no reviews yet.