In today’s competitive art industry, relying only on creativity is no longer enough. You need data-driven insights to understand what sells, who buys, and how your gallery performs. That’s exactly why the Art Galleries Dashboard in Excel is a must-have tool for modern art professionals.
This ready-to-use, interactive Excel dashboard helps you track sales, profit, buyer trends, and exhibition performance—all in one place. Instead of juggling multiple spreadsheets, you get a centralized system that transforms raw data into meaningful insights.
Whether you are a gallery owner, curator, or art investor, this dashboard empowers you to make smarter decisions, faster actions, and higher profits 🚀
✨ Key Features of Art Galleries Dashboard in Excel
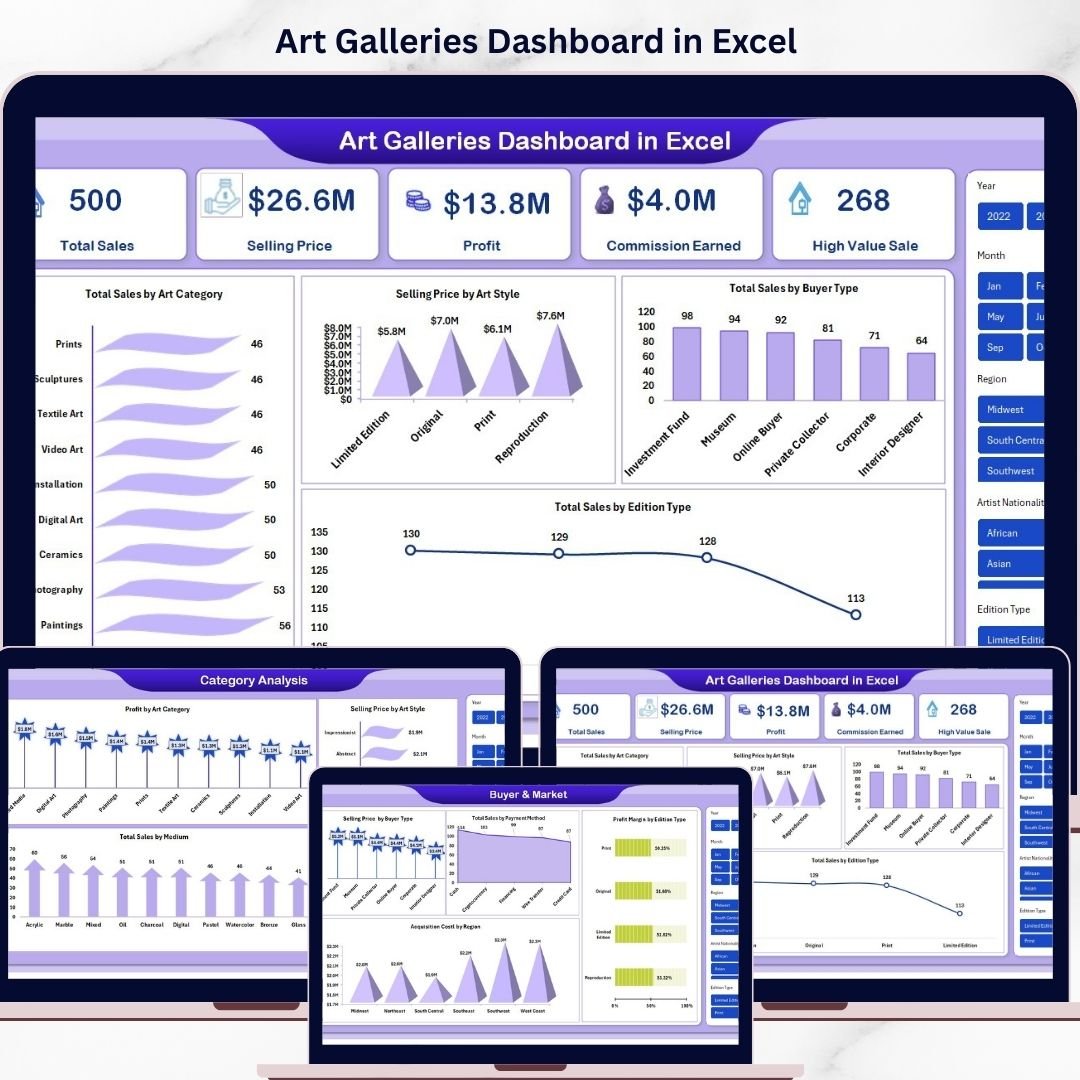
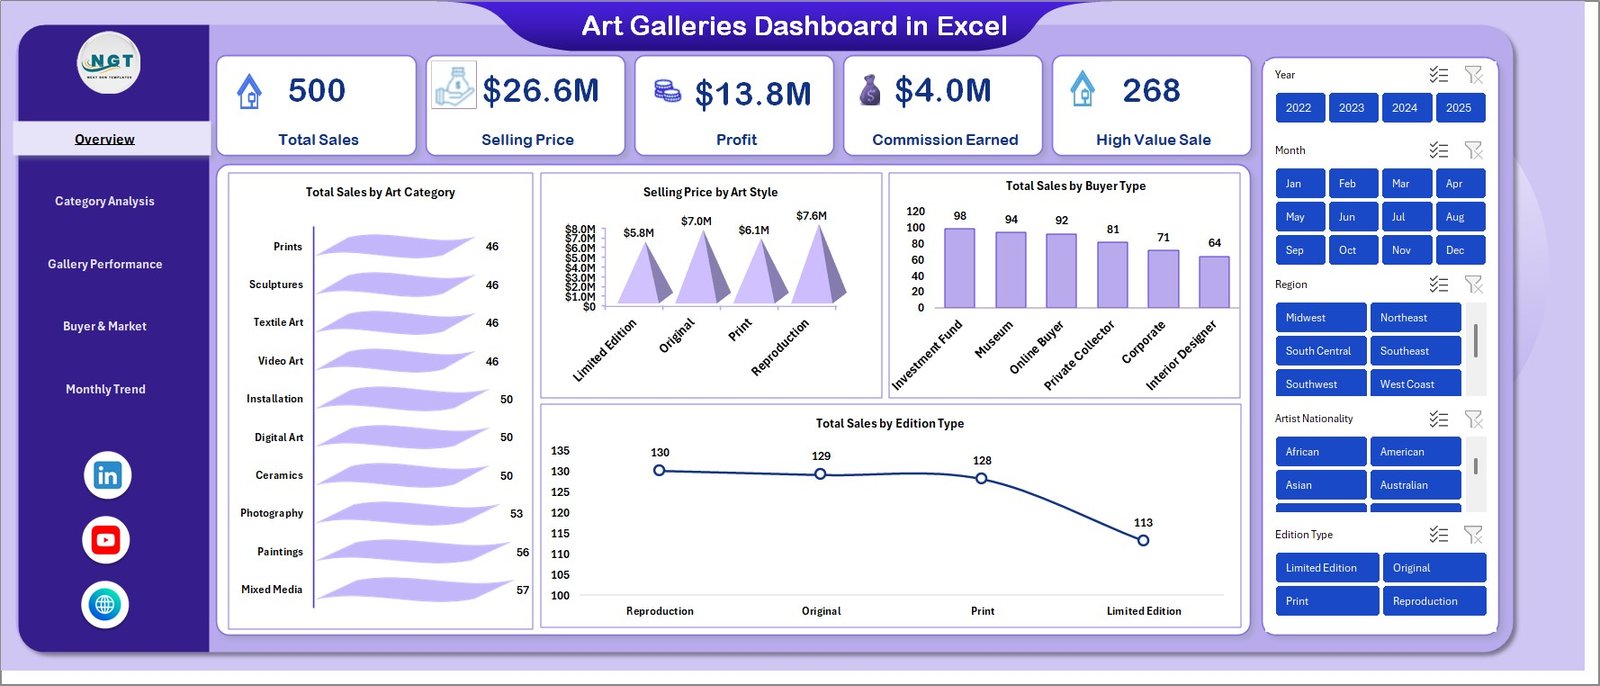
📊 All-in-One Overview Dashboard – Instantly view Total Sales, Selling Price, Profit, Commission Earned, and High Value Sales in one screen.
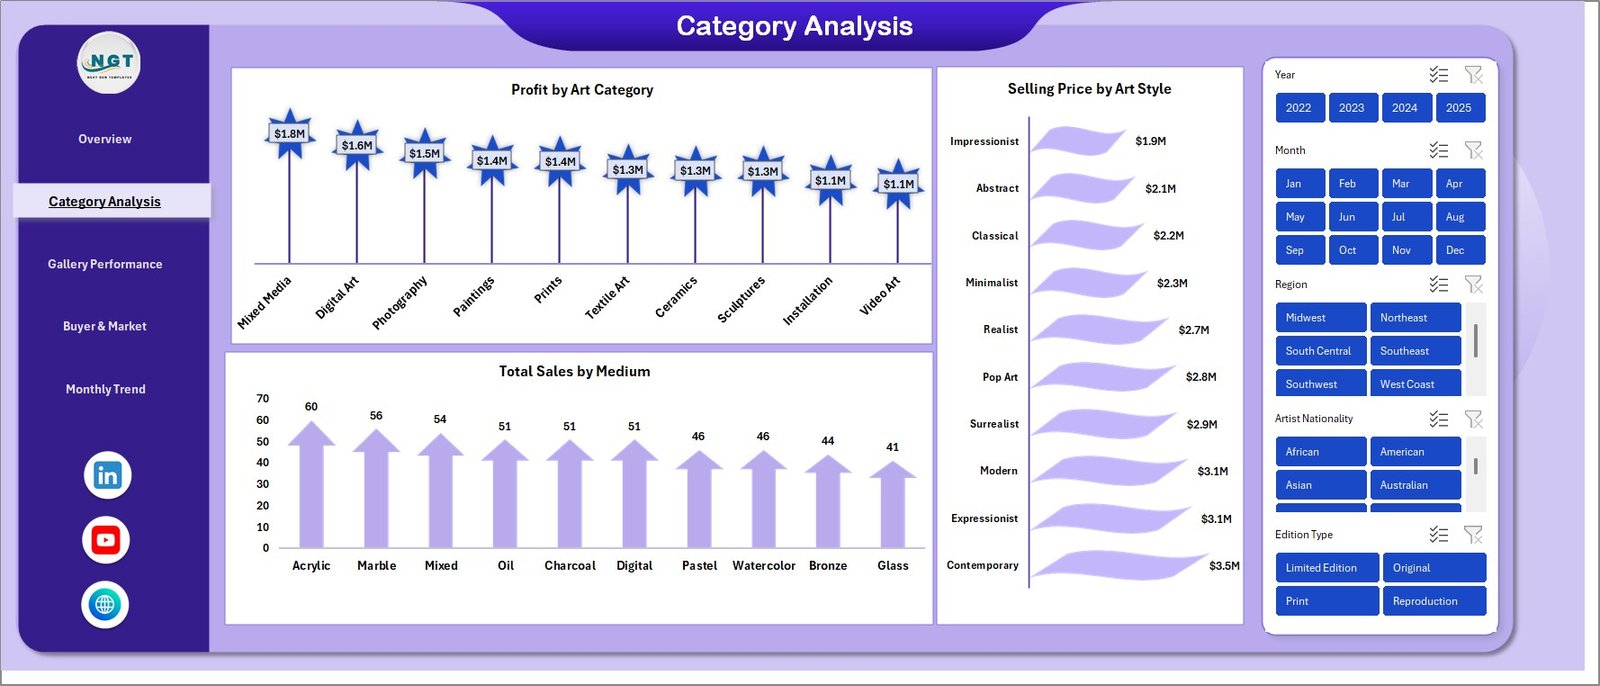
🎨 Art Category Insights – Analyze which art categories, styles, and mediums generate the most revenue and profit.
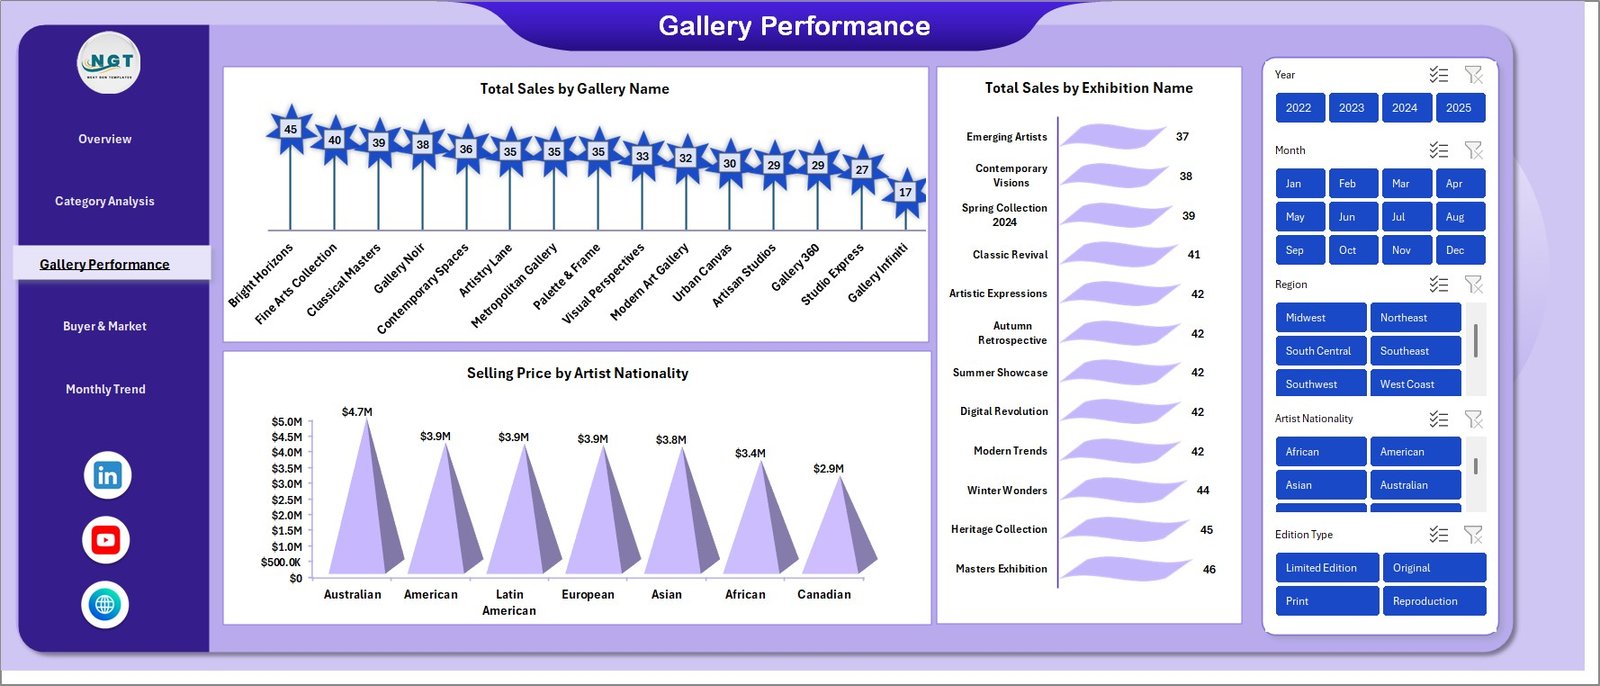
🏛️ Gallery & Exhibition Performance – Track sales by gallery and exhibition to identify top-performing events.
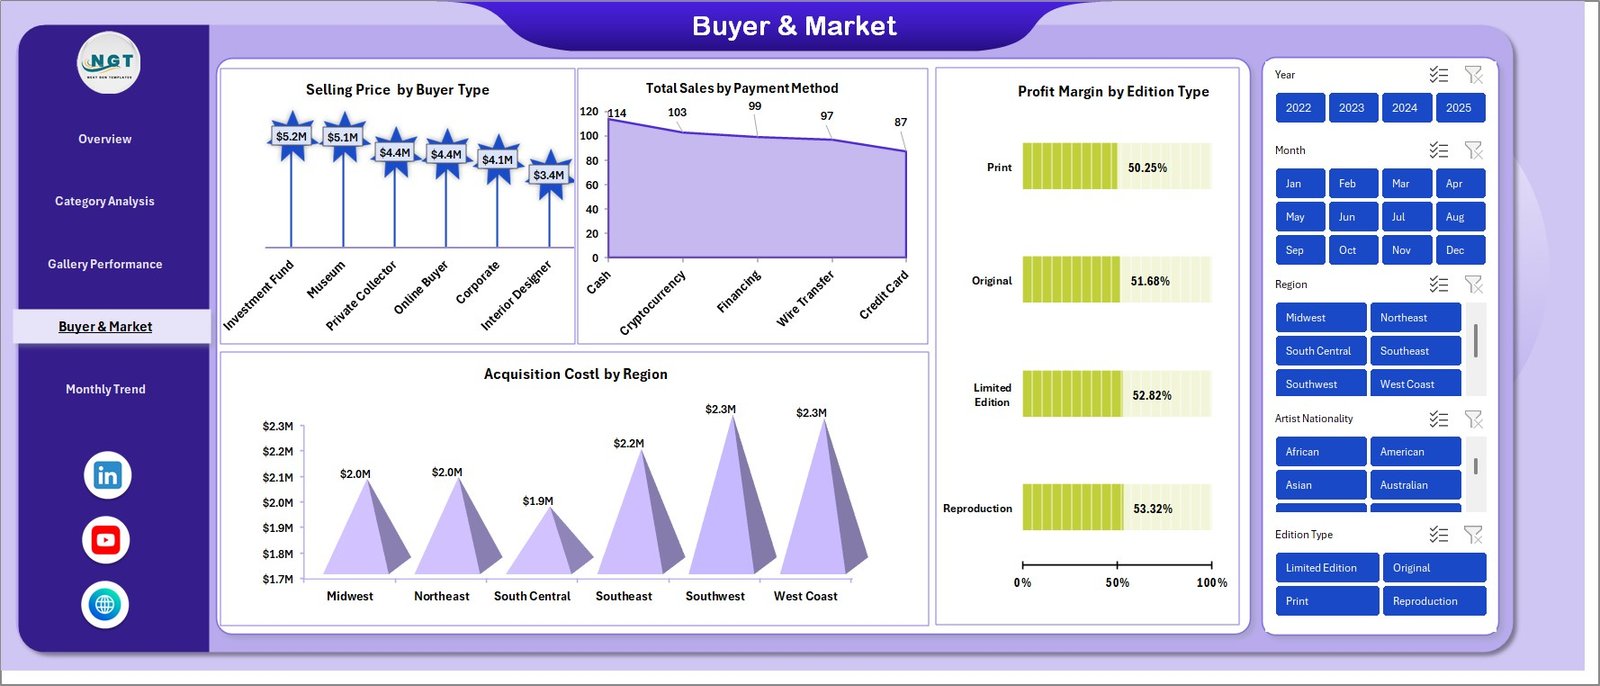
👥 Buyer & Market Intelligence – Understand buyer types, payment methods, and regional acquisition costs.
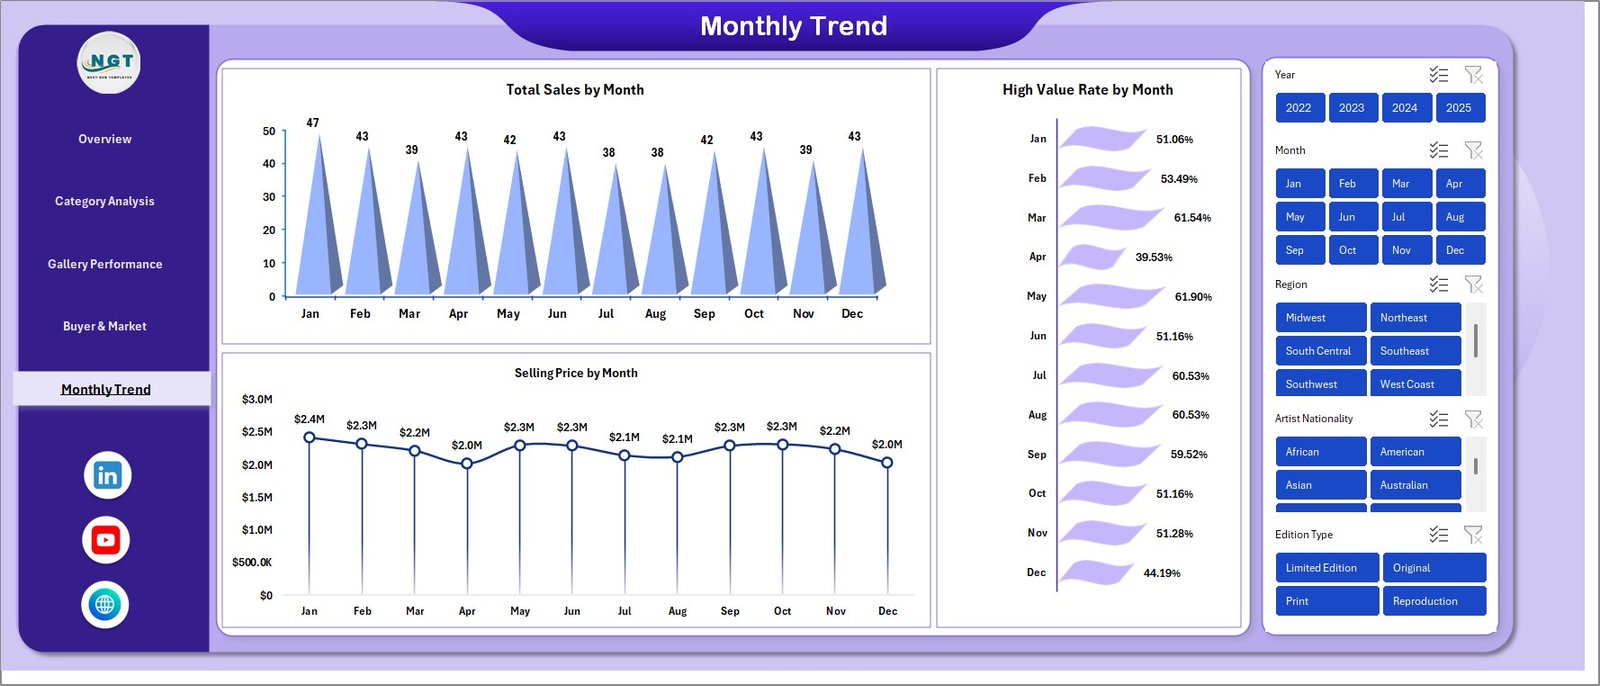
📅 Monthly Trend Analysis – Monitor performance over time with monthly sales, pricing, and high-value trends.
⚡ Dynamic & Interactive Charts – All visuals update automatically when data changes.
🔍 Smart Filtering Options – Slice and analyze data by category, buyer type, or time period.
💼 Business-Focused KPIs – Focus on metrics that truly impact your art business growth.
📦 What’s Inside the Art Galleries Dashboard in Excel
📁 Overview Sheet – Complete snapshot with KPI cards and category-based charts.
📊 Category Analysis Sheet – Deep insights into art types, styles, and mediums.
🏢 Gallery Performance Sheet – Track exhibition and gallery-level performance.
🌍 Buyer & Market Analysis Sheet – Understand customer behavior and regional trends.
📈 Monthly Trends Sheet – Identify seasonal performance and growth patterns.
🧾 Data Input Sheet – Simple and structured data entry for easy updates.
🎯 Pre-built Charts & KPIs – Ready-to-use visuals with no setup required.
⚙️ How to Use the Art Galleries Dashboard in Excel
1️⃣ Enter Your Data – Input sales, buyer, and exhibition data into the data sheet.
2️⃣ Automatic Processing – Excel formulas instantly process and organize your data.
3️⃣ View Dashboard Insights – KPIs and charts update automatically.
4️⃣ Apply Filters – Drill down into specific categories, galleries, or time periods.
5️⃣ Make Better Decisions – Use insights to optimize pricing, exhibitions, and strategies.
💡 No advanced Excel skills required—just input your data and let the dashboard do the work!
👥 Who Can Benefit from This Art Galleries Dashboard in Excel
🎨 Art Gallery Owners – Track performance and increase profitability.
🖼️ Curators – Plan better exhibitions using data insights.
💼 Art Dealers – Identify high-demand art styles and categories.
📊 Art Investors – Make smarter investment decisions based on trends.
🏛️ Museum Managers – Monitor exhibitions and audience engagement.
🚀 Why This Dashboard is a Game-Changer
✔️ Save hours of manual reporting
✔️ Get instant insights with dynamic visuals
✔️ Improve pricing and sales strategies
✔️ Understand buyer behavior deeply
✔️ Make faster, data-driven decisions
Click here to read the Detailed blog post
Watch the step-by-step video tutorial:
Visit our YouTube channel to learn step-by-step video tutorials
👉 https://www.youtube.com/@PKAnExcelExpert