In today’s fast-moving digital environment, organizations must deliver software faster, maintain system stability, and ensure seamless collaboration between development and operations teams. However, managing DevOps performance without a structured system often leads to delays, inefficiencies, and missed insights.
That’s where the DevOps KPI Dashboard in Google Sheets becomes a game-changing solution. 🚀
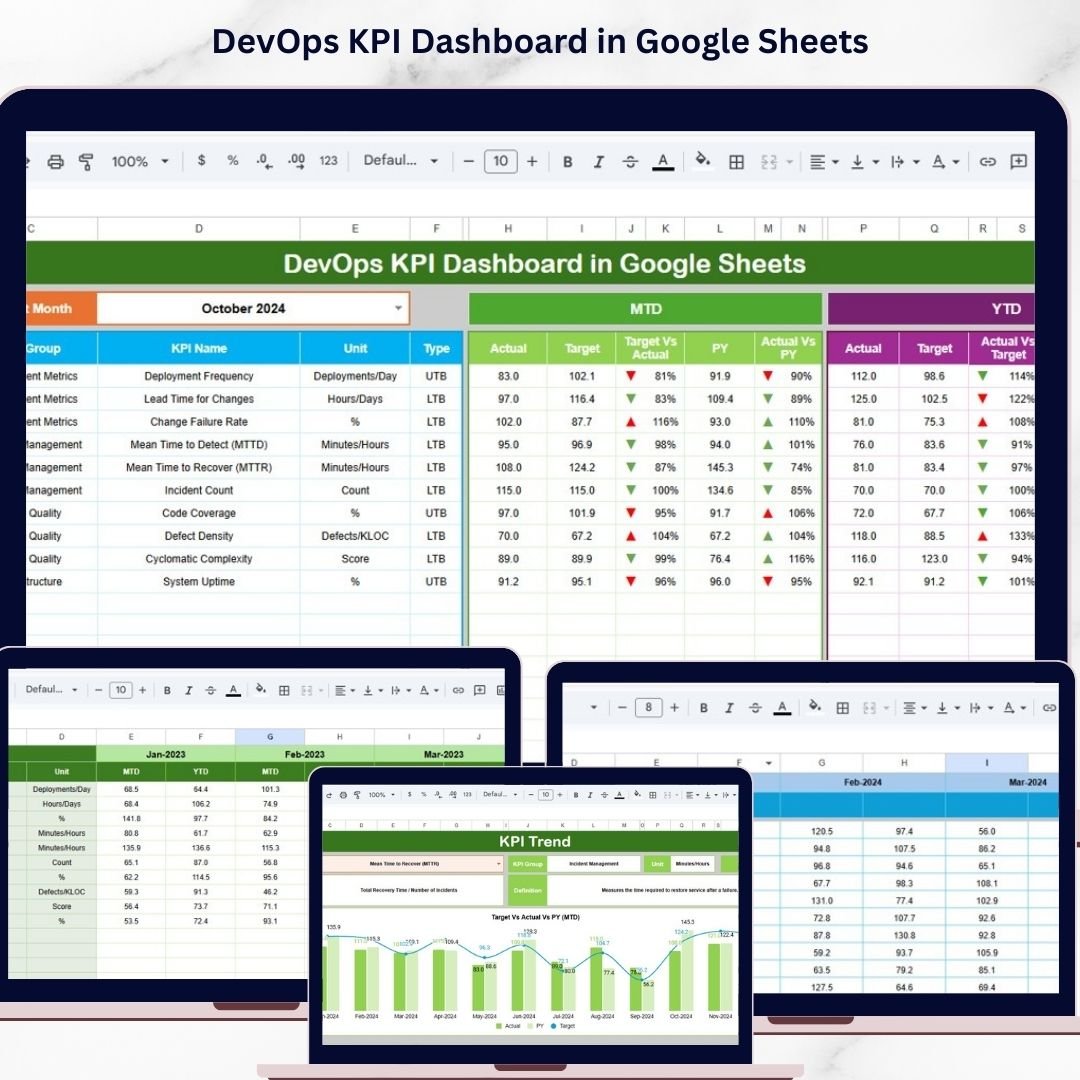
This ready-to-use dashboard helps you track critical DevOps metrics like deployment frequency, system uptime, failure rate, and lead time—all in one centralized and interactive platform. Instead of juggling multiple spreadsheets or tools, you get a clear and real-time view of your DevOps performance.
Because this dashboard is built in Google Sheets, your entire team can collaborate, update data, and monitor performance from anywhere. With dynamic charts, KPI cards, and performance indicators, decision-making becomes faster, smarter, and more data-driven.
Whether you’re managing CI/CD pipelines, tracking incidents, or improving delivery speed, this dashboard empowers your team with actionable insights to optimize operations and boost efficiency.
🚀 Key Feature of DevOps KPI Dashboard in Google Sheets
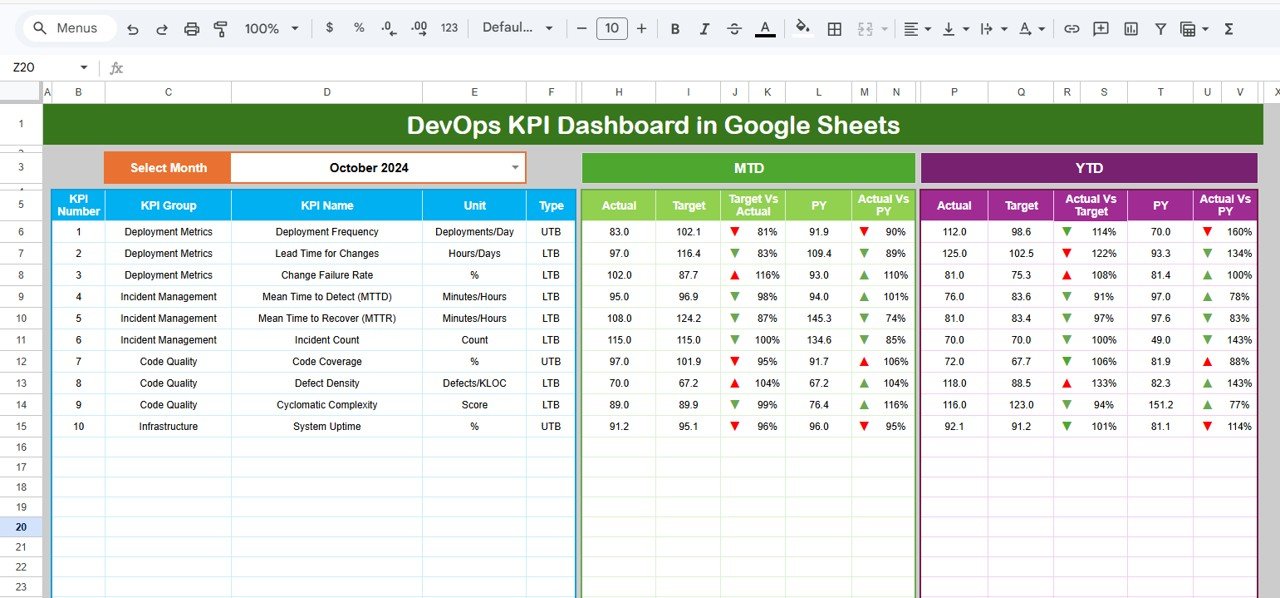
📊 Interactive Dashboard View
Get a complete overview of DevOps performance with dynamic charts, KPI cards, and visual indicators.
📅 Month Selection Control
Analyze data month-wise using a dropdown selection for better tracking and comparison.
🎯 Target vs Actual Comparison
Instantly evaluate performance with automatic calculations and comparison metrics.
📈 MTD & YTD Tracking
Track both Month-To-Date and Year-To-Date performance to monitor progress effectively.
📉 Performance Indicators with Arrows
Quickly identify success or failure using conditional formatting with up/down arrows.
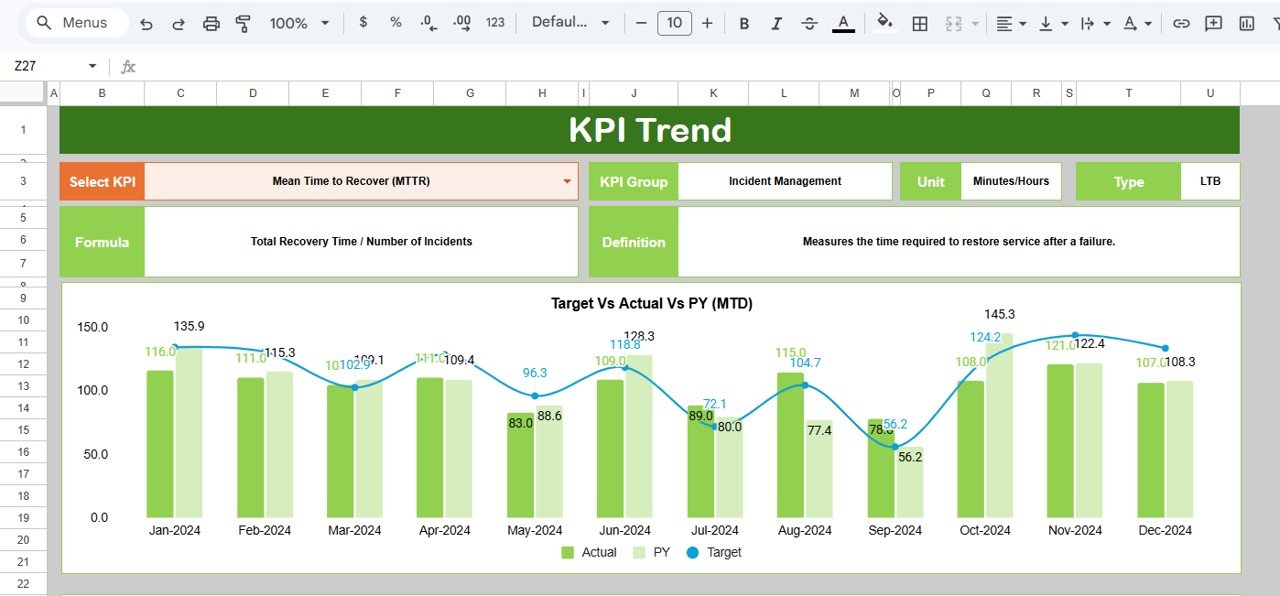
📊 KPI Trend Analysis Sheet
Deep dive into individual KPI performance and trends over time.
📚 KPI Definition & Documentation
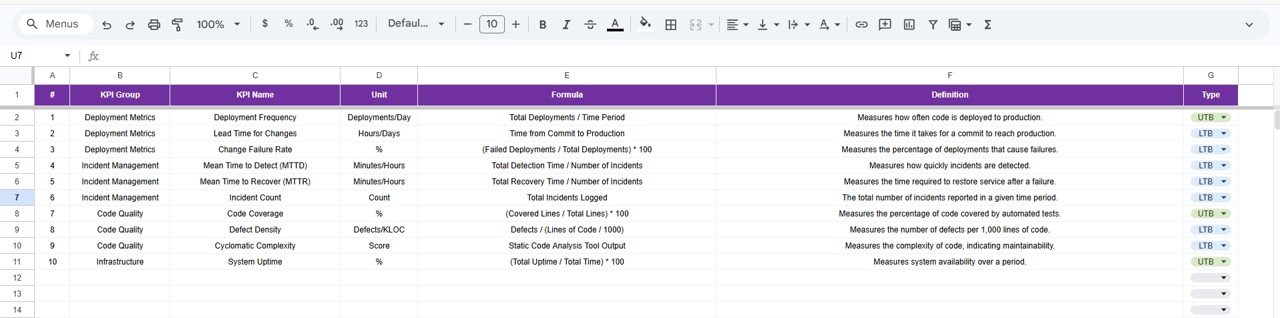
Understand KPI logic with built-in definitions, formulas, and classifications.
🔄 Real-Time Collaboration
Access and update the dashboard from anywhere with Google Sheets.
💡 Easy Customization
Modify KPIs, formulas, and charts according to your business needs.
📦 What’s Inside the DevOps KPI Dashboard in Google Sheets
This template is designed with a structured and user-friendly layout.
✔ 6 Fully Functional Worksheets
1️⃣ Dashboard Sheet – Displays KPI cards, charts, and performance comparisons.
2️⃣ KPI Trend Sheet – Provides detailed KPI insights and trend analysis.
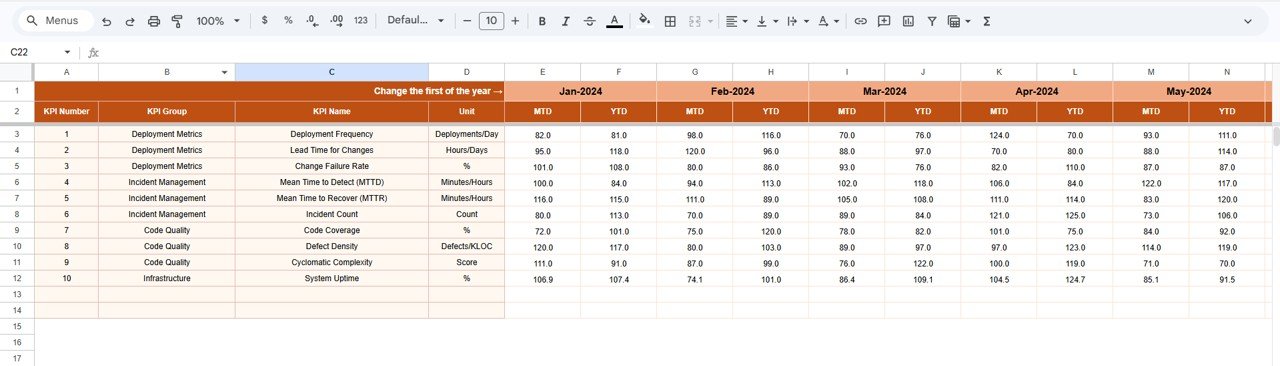
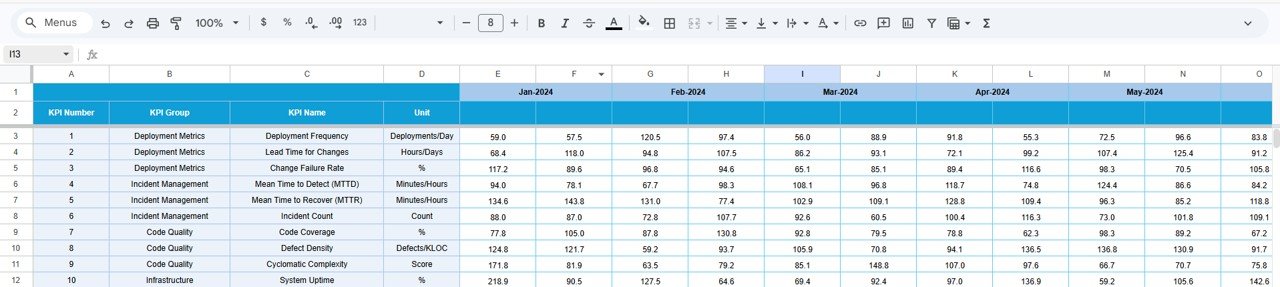
3️⃣ Actual Number Sheet – Stores real DevOps performance data.
4️⃣ Target Sheet – Contains KPI targets for performance evaluation.
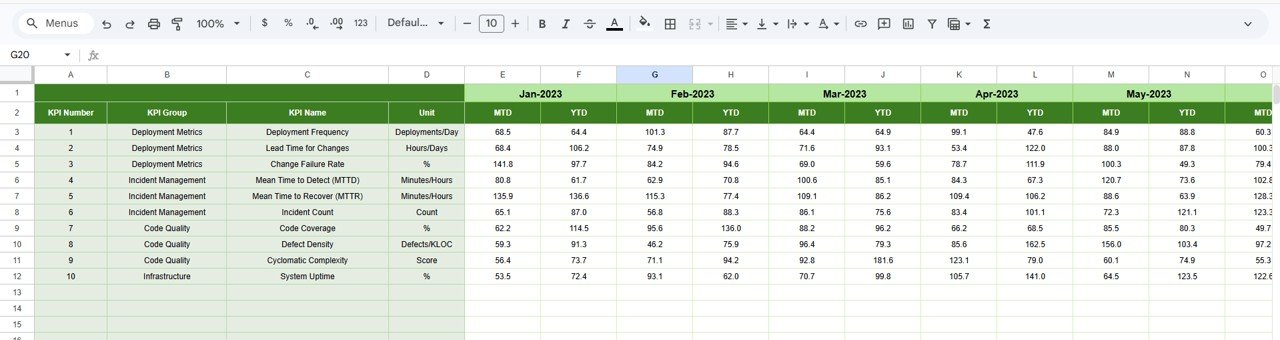
5️⃣ Previous Year Sheet – Helps compare current vs historical performance.
6️⃣ KPI Definition Sheet – Includes KPI formulas, definitions, and types.
✔ Dynamic Metrics Included
-
Deployment Frequency
-
Lead Time for Changes
-
Change Failure Rate
-
Mean Time to Recovery (MTTR)
-
System Uptime
-
Incident Resolution Time
Because everything is structured and automated, you can start analyzing immediately without building anything from scratch.
⚙️ How to Use the DevOps KPI Dashboard in Google Sheets
Using this dashboard is simple and efficient.
1️⃣ Enter Data in Sheets
Add actual values, targets, and previous year data.
2️⃣ Select Month from Dropdown
Choose the reporting month from the dashboard.
3️⃣ Monitor KPI Performance
Analyze KPI cards, charts, and comparisons.
4️⃣ Review Trends
Use the KPI Trend sheet to analyze performance over time.
5️⃣ Understand KPI Logic
Refer to the KPI Definition sheet for detailed explanations.
Within minutes, you’ll have a complete view of your DevOps performance.
👥 Who Can Benefit from This DevOps KPI Dashboard in Google Sheets
👨💻 DevOps Teams – Track deployments, incidents, and performance metrics.
🏢 IT Managers – Monitor system performance and team productivity.
🚀 Software Development Teams – Improve delivery speed and reduce failures.
📊 Operations Teams – Ensure system uptime and operational efficiency.
💼 Organizations of All Sizes – Gain insights without expensive tools.
This dashboard is perfect for any team aiming to improve DevOps performance and efficiency.
### Click here to read the Detailed blog post
Visit our YouTube channel to learn step-by-step video tutorials
https://youtube.com/@NeotechNavigators