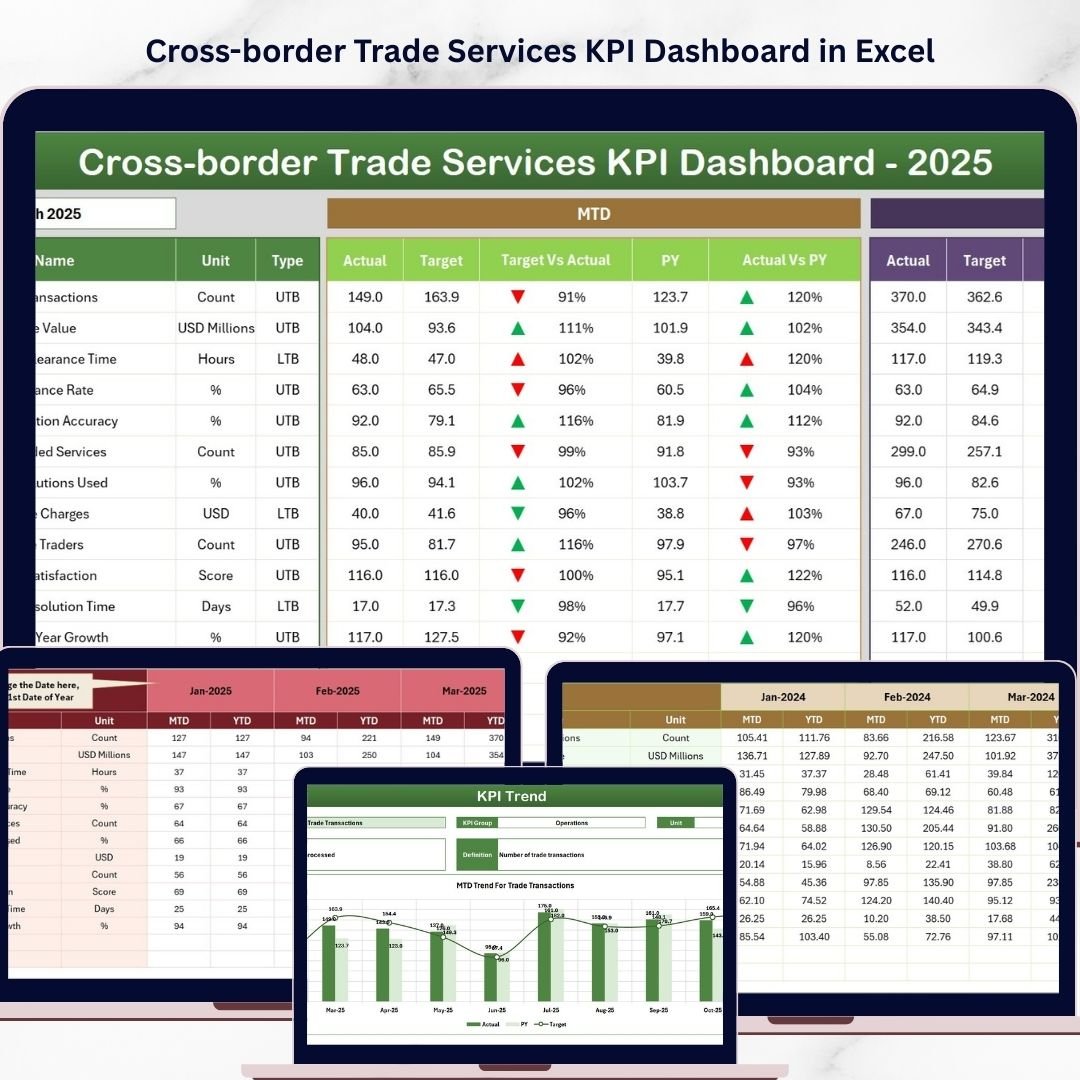
Key Features of Cross-border Trade Services KPI Dashboard
Unlock the power of insightful analytics with our Cross-border Trade Services KPI Dashboard, designed specifically to streamline and enhance your international trade performance tracking. This comprehensive digital dashboard offers 7 meticulously crafted worksheets that bring clarity and precision to your KPI management.
- 🗂️ Home Sheet: An intuitive index page featuring six easy-to-navigate buttons to jump between sheets, making your workflow seamless and efficient.
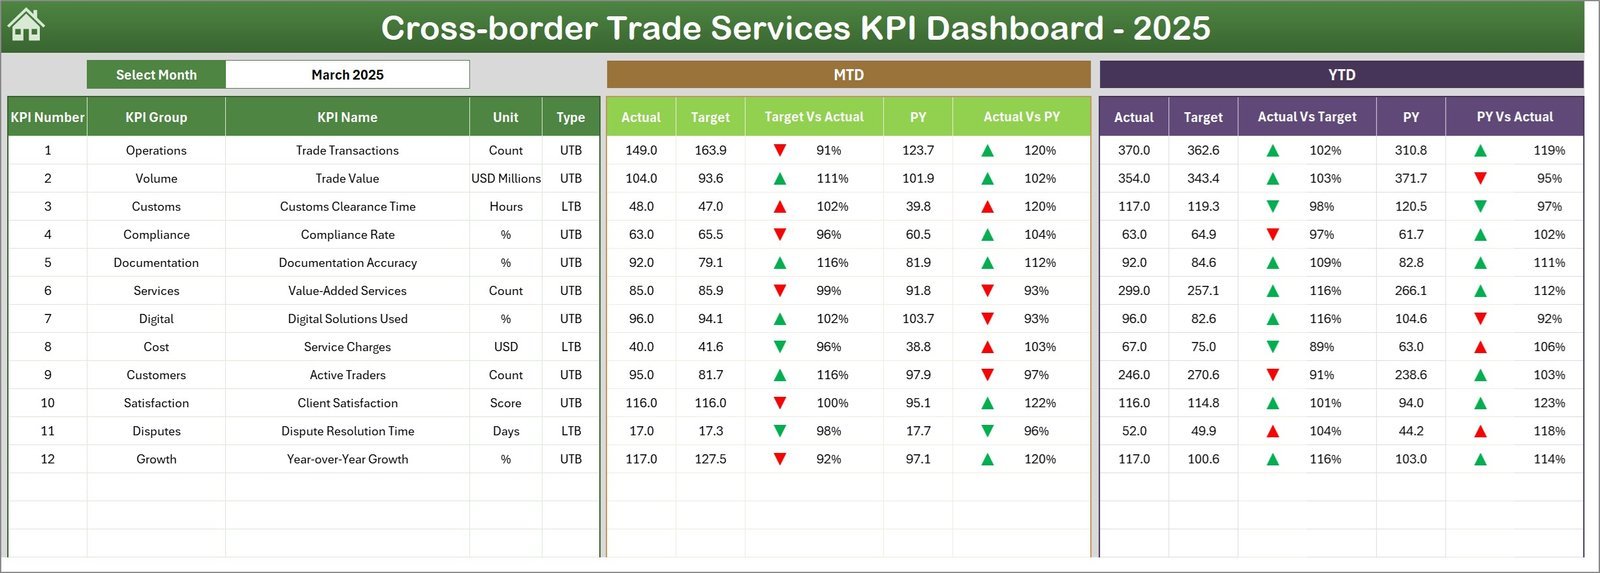
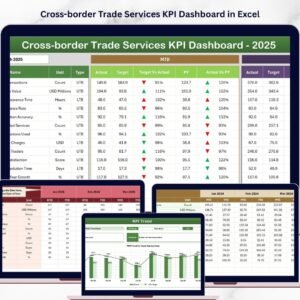
- 📊 Dashboard Sheet Tab: The heart of the dashboard, displaying all KPIs with dynamic monthly selection via a drop-down. Visualize MTD Actual, Target, and Previous Year data alongside YTD values, all enhanced with conditional formatting and up/down arrows for quick performance insights.
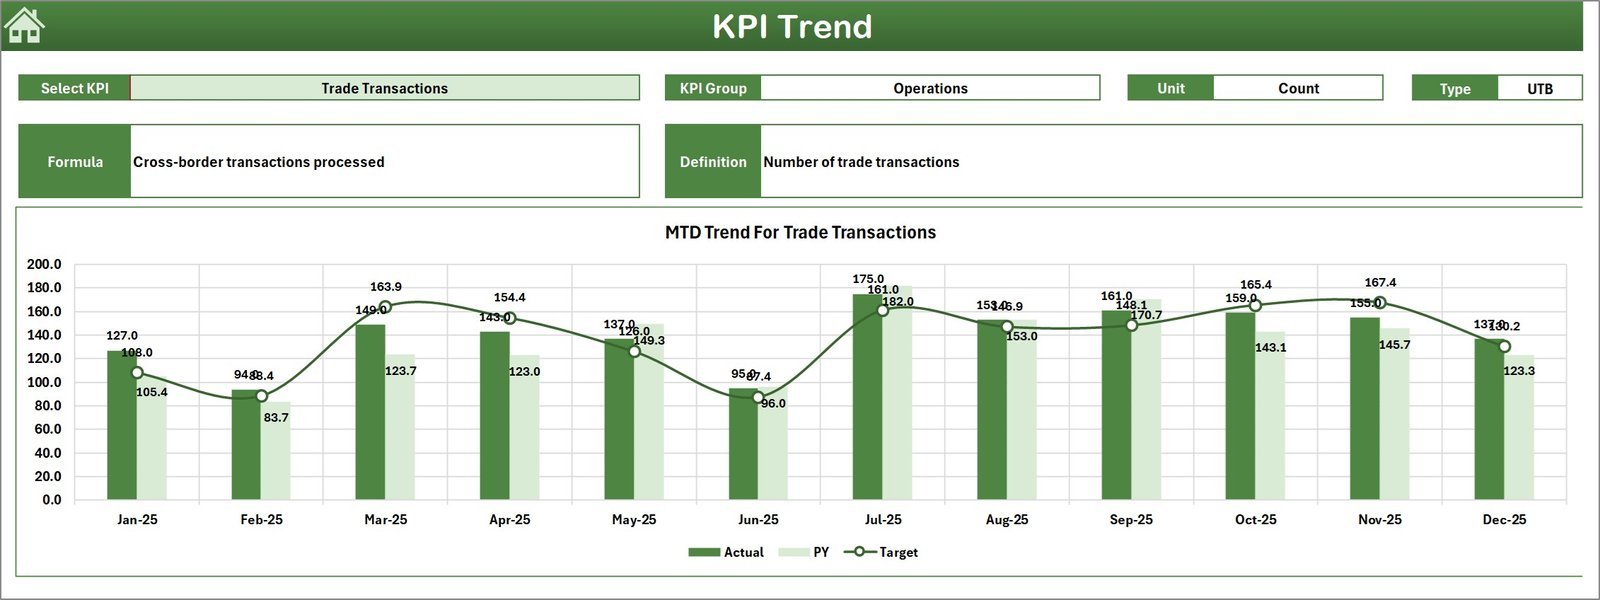
- 📈 KPI Trend Sheet Tab: Select any KPI from a drop-down to view detailed KPI Group, Unit, Type (Lower the Better or Upper the Better), Formula, and Definition. Monitor MTD and YTD trends with easy-to-read charts comparing Actual, Target, and Previous Year figures.
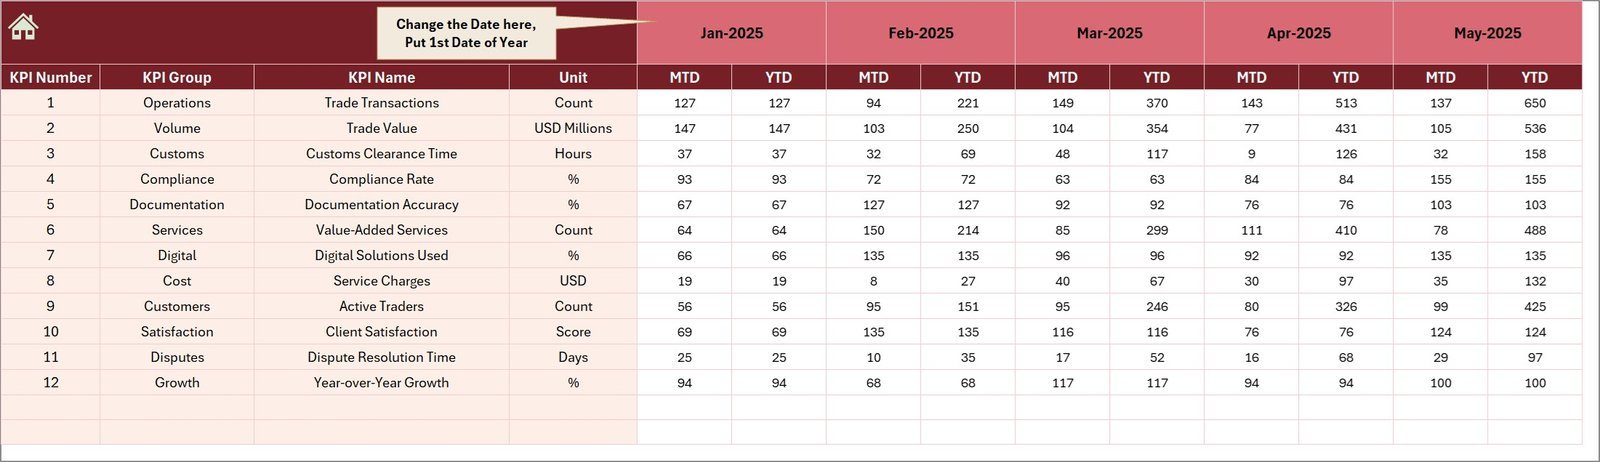
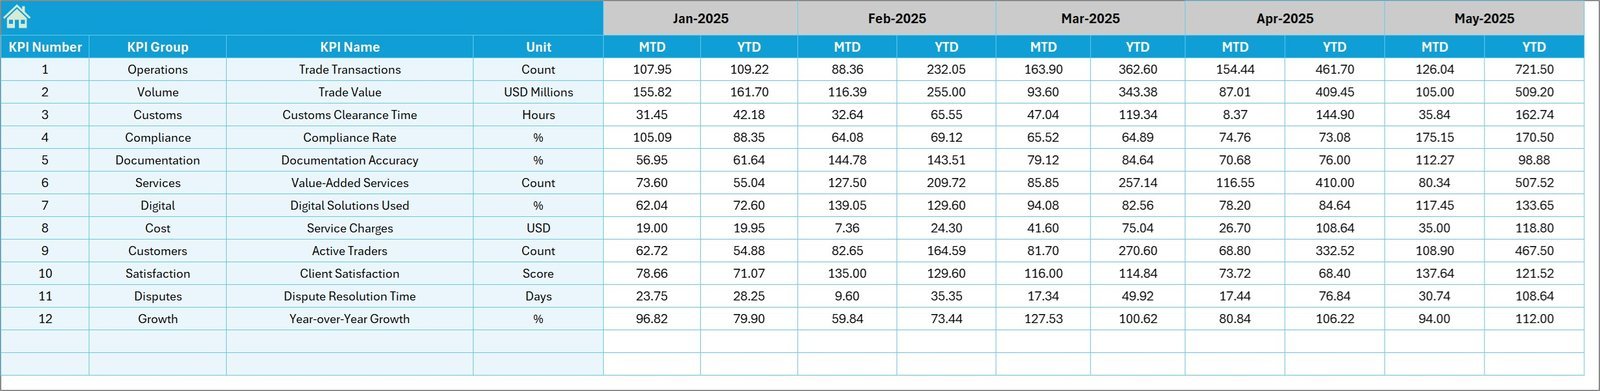
- ✍️ Actual Numbers Input Sheet: Enter your monthly actual numbers for MTD and YTD effortlessly, with a flexible month-selection feature to customize your data entry.
- 🎯 Target Number Input Sheet: Define your monthly targets for each KPI to keep your goals aligned and measurable, covering both MTD and YTD data.
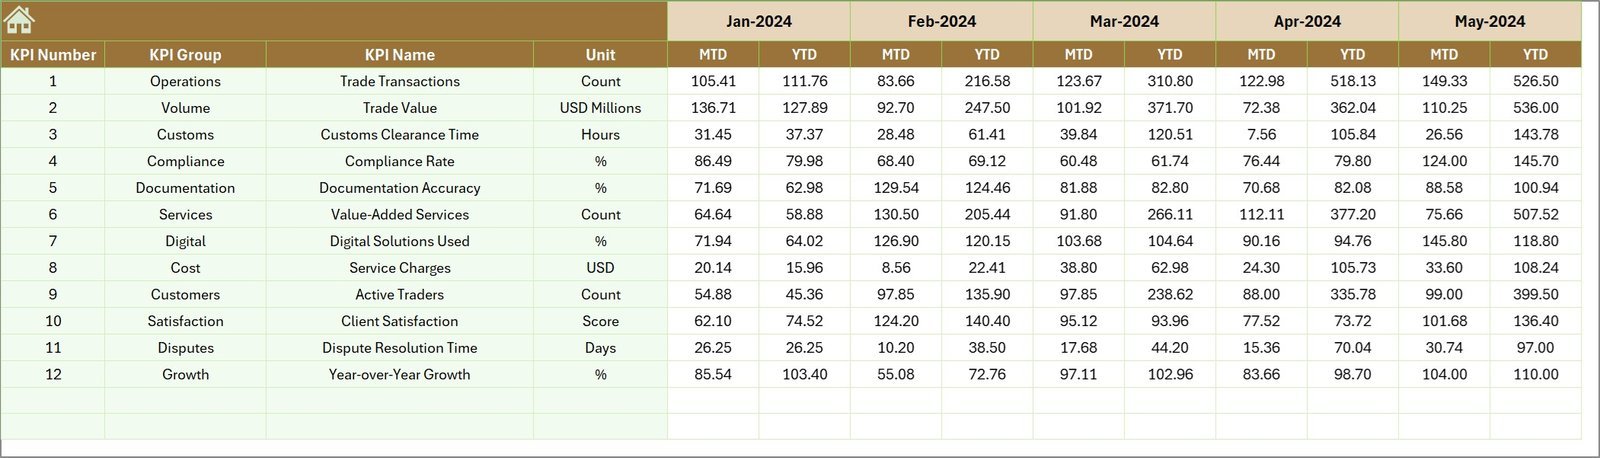
- 📅 Previous Year Number Sheet Tab: Input last year’s data to enable meaningful year-over-year comparisons and performance evaluations.
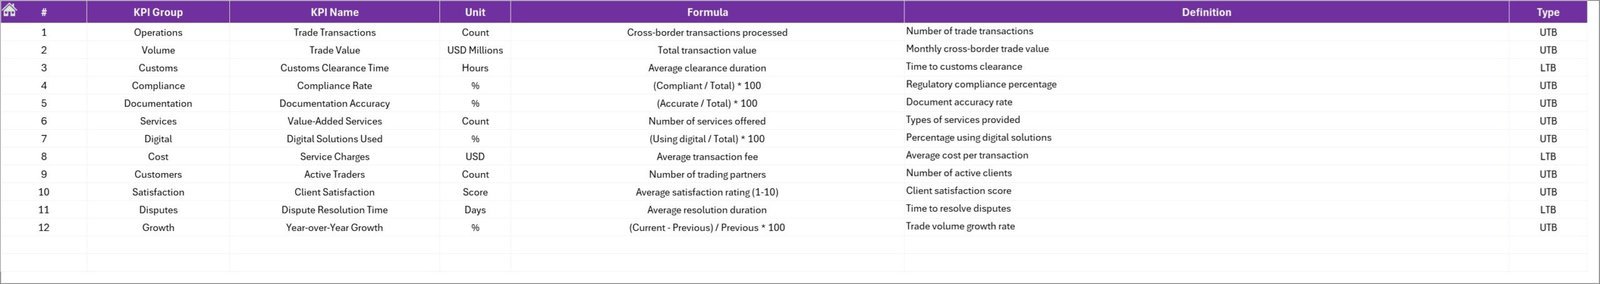
- 📚 KPI Definition Sheet Tab: Maintain clarity by defining each KPI’s name, group, unit, formula, and type (Lower the Better or Upper the Better) for comprehensive understanding across your team.
What’s Inside the Cross-border Trade Services KPI Dashboard
This dashboard is a complete digital solution built to help businesses track, analyze, and optimize their cross-border trade KPIs. Inside, you will find:
- 🖥️ Seven fully interactive worksheets for data input, visualization, and KPI management
- 📅 Dynamic monthly and yearly data selection and comparison capabilities
- 📉 Conditional formatting and visual cues to quickly identify KPI performance trends
- 📊 Trend charts illustrating actual vs target vs previous year for informed decision-making
- 📥 Easy-to-use input sheets for actual, target, and previous year data entry
- 📖 Clear KPI definitions and formulas ensuring consistent understanding within your team
How to Use the Cross-border Trade Services
Getting started with this dashboard is straightforward and user-friendly. Follow these simple steps:
- 🔍 Begin at the Home Sheet to navigate quickly across different sections.
- 📅 Use the Dashboard Sheet to select the month you want to analyze through the drop-down in cell D3; all KPI data will update accordingly.
- ✏️ Enter your actual numbers in the Actual Numbers Input sheet, adjusting the starting month as needed.
- 🎯 Input your monthly and yearly targets in the Target Number Input sheet to set measurable goals.
- 📊 Fill in last year’s data in the Previous Year Number sheet for accurate comparisons.
- 📈 Select any KPI from the KPI Trend Sheet to view detailed trend charts and performance insights.
- 📚 Use the KPI Definition sheet to understand each KPI’s purpose, formula, and performance type.
- ✅ Monitor your KPIs regularly to identify trends, gaps, and opportunities for improvement in your cross-border trade operations.
Who Can Benefit from This Cross-border Trade Services KPI Dashboard
This KPI dashboard is perfect for a wide range of professionals and organizations involved in international trade and logistics:
- 🌍 Trade Managers: Track key performance indicators efficiently to optimize global trade processes.
- 📦 Supply Chain Professionals: Gain visibility into cross-border logistics performance and identify bottlenecks.
- 📈 Business Analysts: Analyze trends and generate actionable insights for strategic decision-making.
- 👥 Executives and Stakeholders: Monitor company-wide performance at a glance with clear visual dashboards.
- 💼 Consultants: Provide clients with powerful tools to measure and improve cross-border trade KPIs.
- 🏢 International Trade Firms: Manage and report KPIs across different regions and timelines effortlessly.
- 📊 Finance Teams: Align financial targets with operational KPIs to ensure consistent performance tracking.
Whether you are a small business expanding overseas or a large corporation managing multiple trade lanes, this dashboard is designed to elevate your KPI tracking and drive measurable business growth.


Reviews
There are no reviews yet.