Retail businesses generate massive amounts of data every day. Every sale, product movement, discount, customer purchase, and store transaction creates valuable information. However, when this data is scattered across spreadsheets or static reports, it becomes difficult for managers to analyze performance and make timely decisions.
This is where the Retail Dashboard in HTML becomes extremely powerful.
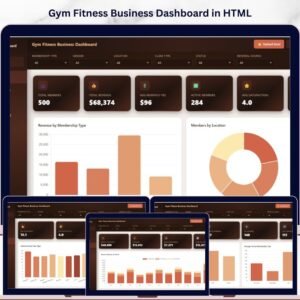
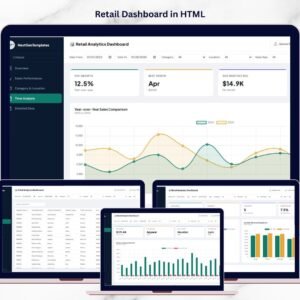
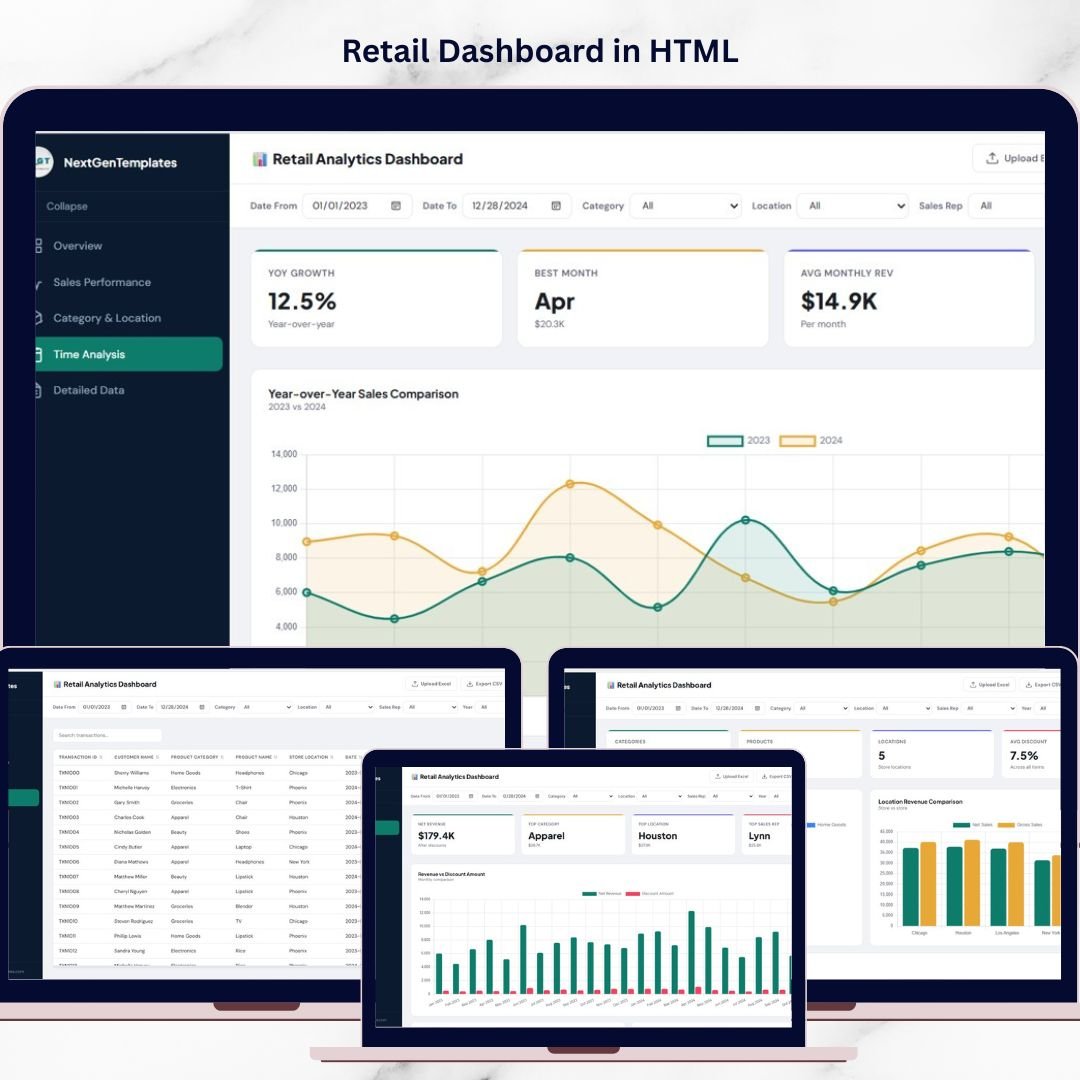
The Retail Dashboard in HTML is a modern, browser-based analytics dashboard designed to transform raw retail data into clear, interactive insights. Instead of working with multiple spreadsheets, users can monitor sales performance, product categories, store activity, and time-based trends within a single professional dashboard interface.
Built using HTML, CSS, and JavaScript, this dashboard runs directly in a web browser and delivers a clean SaaS-style user experience. Users can navigate between pages, apply global filters, upload Excel files, explore charts, analyze detailed transaction data, and export results instantly.
This makes the dashboard ideal not only for internal retail analysis but also for client presentations, digital product marketplaces, and professional reporting tools.
The uploaded dashboard template includes powerful features such as sidebar navigation, KPI cards, multi-page analytics, global filters, a searchable data table, Excel upload support, CSV export, theme toggle, and responsive design. Together, these features create a professional analytics environment that feels like a modern SaaS application rather than a simple spreadsheet report.
Whether you are a retailer, analyst, consultant, or digital template seller, this dashboard provides a powerful solution for retail performance analysis.

🚀 Key Feature of Retail Dashboard in HTML
The Retail Dashboard in HTML offers a modern interface and powerful analytics features that help businesses analyze retail performance quickly.
📊 Modern SaaS-Style Interface
The dashboard includes a collapsible sidebar, sticky topbar, KPI cards, chart sections, and responsive layout, creating a premium user experience.
📈 Interactive KPI Cards
Top-level KPI cards display important retail metrics such as sales performance, revenue trends, and transaction summaries.
🔎 Global Filter Bar
Users can filter retail data using multiple dimensions including Date Range, Category, Location, Sales Representative, and Year.
📊 Multi-Page Analytics Navigation
The dashboard includes dedicated pages for Overview, Sales Performance, Category & Location, Time Analysis, Detailed Data, and How to Use.
📂 Excel File Upload Support
Users can upload their own .xlsx or .xls files using a drag-and-drop upload interface.
📋 Detailed Data Table
A powerful transaction table includes search, sorting, pagination, and scrollable records for detailed analysis.
📤 CSV Export Functionality
Users can export filtered datasets for further analysis in Excel or other tools.
🌙 Light & Dark Theme Toggle
The dashboard supports both light and dark mode, enhancing the visual experience for different environments.
📱 Responsive Design
The layout automatically adapts to smaller screens and mobile devices.
🔐 Secure Local Data Processing
All data processing occurs directly in the browser, ensuring user privacy and data security.
📦 What’s Inside the Retail Dashboard in HTML
This digital product includes several powerful components that create a complete retail analytics system.
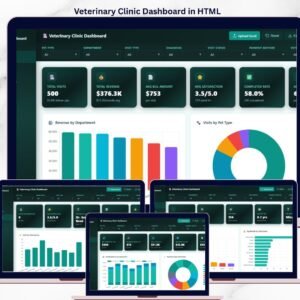
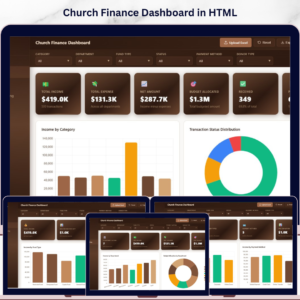
📊 Overview Page – Retail Performance Summary
Displays KPI cards and key charts such as Monthly Sales Trends to provide a high-level view of business performance.
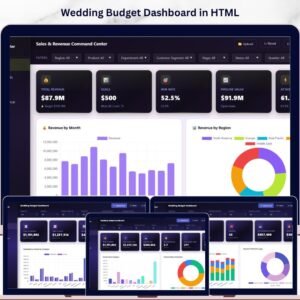
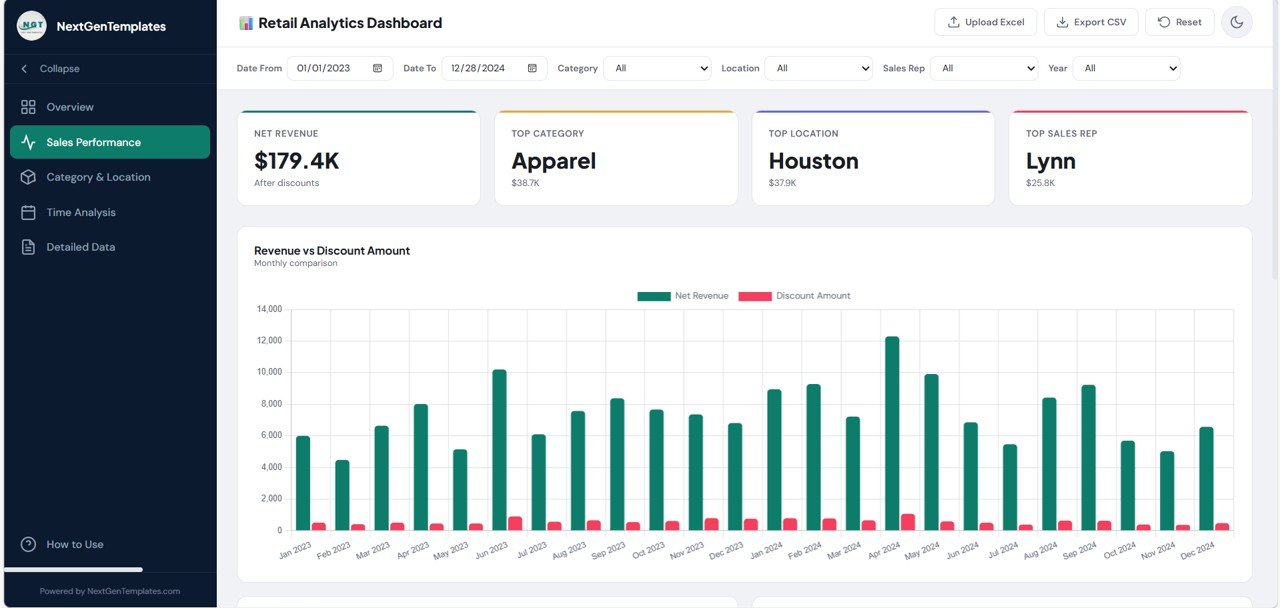
📈 Sales Performance Page
Focuses on revenue performance and transaction trends, helping users analyze overall sales output.
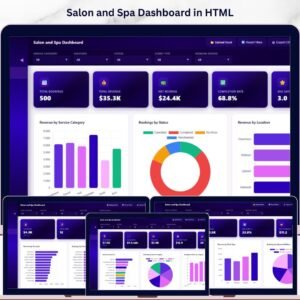
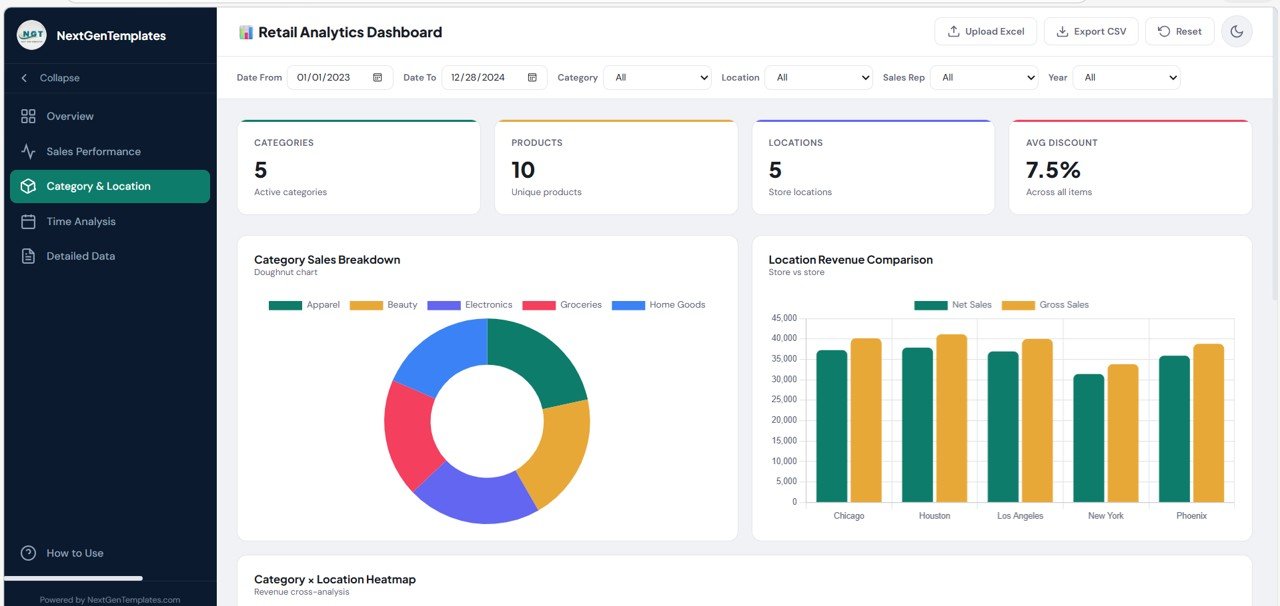
🏬 Category & Location Analysis Page
Helps identify top product categories and best-performing store locations.
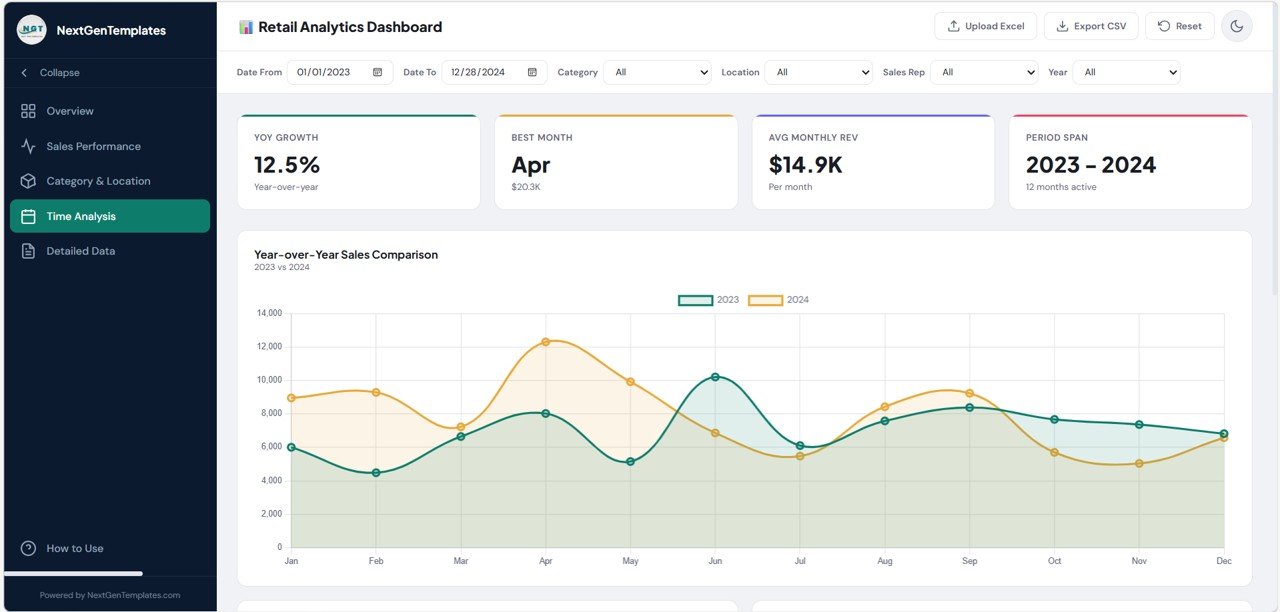
📅 Time Analysis Page
Provides insights into daily and monthly sales patterns, helping retailers understand seasonality and sales cycles.
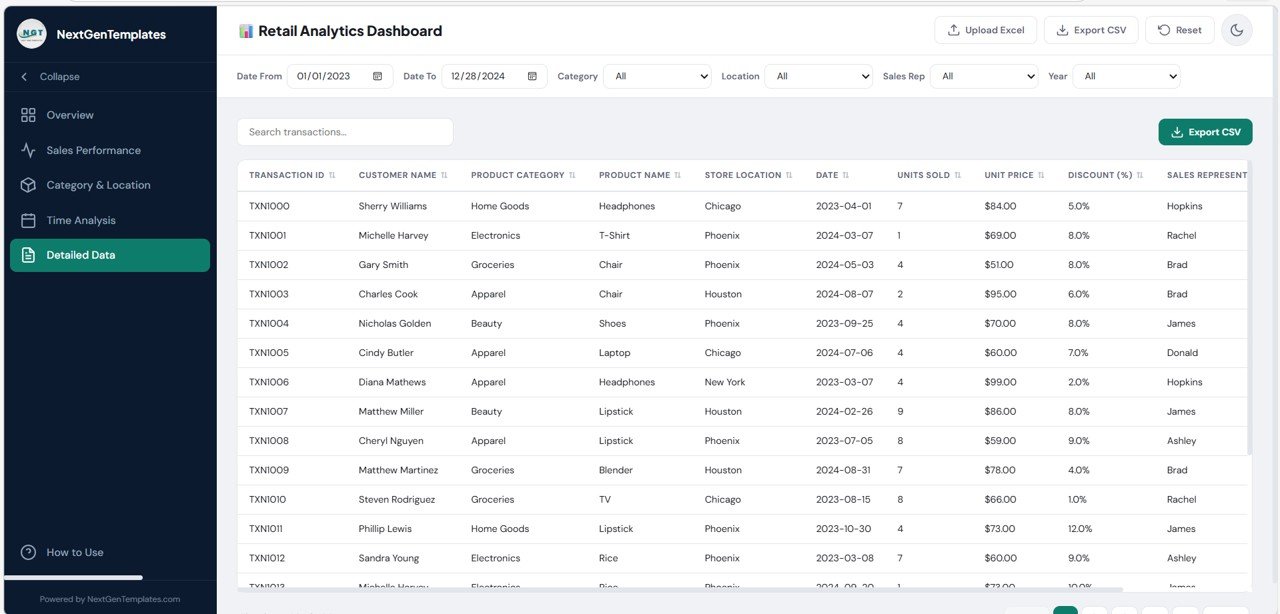
📋 Detailed Data Page
Includes a powerful transaction-level table with search, sorting, export, and pagination features.
📘 How to Use Page
Provides step-by-step instructions explaining file uploads, filters, dashboard navigation, and supported dataset structure.
These components combine to create a complete browser-based retail analytics solution.
⚙️ How to Use the Retail Dashboard in HTML
Using this dashboard is simple and requires no advanced technical knowledge.
Step 1 – Open the Dashboard in a Browser
Launch the HTML file to access the dashboard interface.
Step 2 – Upload Your Retail Dataset
Use the upload modal to import your Excel file containing retail transaction data.
Step 3 – Apply Global Filters
Filter data using date ranges, categories, store locations, or sales representatives.
Step 4 – Explore Charts and KPIs
Navigate through different pages to analyze sales trends and performance indicators.
Step 5 – Review Detailed Transactions
Use the data table to search and analyze individual transaction records.
By following these steps, businesses can quickly build a modern retail analytics experience directly in a web browser.
👥 Who Can Benefit from This Retail Dashboard in HTML
This dashboard is useful for many professionals involved in retail and analytics.
🛍️ Retail Store Owners – Monitor store performance and sales trends.
🏬 Retail Chain Managers – Compare performance across multiple store locations.
📊 Sales Analysts – Analyze product categories, transactions, and sales patterns.
💼 Business Consultants – Present retail insights to clients in a professional dashboard format.
📈 E-commerce Sellers – Track product performance and sales activity.
🧑💻 Digital Template Sellers – Sell modern dashboard templates in online marketplaces.
Anyone looking for a modern browser-based retail analytics solution can benefit from this dashboard.
### Click hare to read the Detailed blog post
Watch the step-by-step video tutorial: