Recycling infrastructure plays a crucial role in building a sustainable and environmentally responsible future. Cities, municipalities, and waste management organizations constantly work to improve recycling efficiency, reduce landfill waste, and maximize resource recovery. However, managing recycling operations becomes extremely challenging when organizations rely on scattered spreadsheets or disconnected reports.
Without proper analytics, managers struggle to monitor recycling performance, evaluate operational efficiency, and track sustainability targets.
This is where the Recycling Infrastructure KPI Dashboard in Power BI becomes an extremely valuable solution.
The Recycling Infrastructure KPI Dashboard in Power BI is a ready-to-use analytics tool designed to track recycling performance indicators, monitor operational efficiency, and compare targets with actual results. By transforming raw recycling data into powerful visual insights, this dashboard helps organizations make faster and smarter decisions.
Because Power BI provides interactive visuals, dynamic filters, and advanced data modeling capabilities, users can easily analyze recycling trends, compare performance across months, and evaluate sustainability progress.
Whether you manage a waste management company, municipal recycling program, environmental agency, or recycling processing facility, this dashboard provides the insights needed to optimize recycling operations.
♻️ Key Feature of Recycling Infrastructure KPI Dashboard in Power BI
This dashboard includes powerful analytical features that help organizations monitor recycling performance effectively.
📊 Centralized Recycling KPI Monitoring – Track recycling performance indicators in one interactive dashboard.
📈 Monthly and Yearly Performance Analysis – Monitor both MTD (Month-To-Date) and YTD (Year-To-Date) recycling performance.
📉 Actual vs Target Performance Comparison – Evaluate operational performance against predefined targets.
📊 Historical Performance Benchmarking – Compare current recycling metrics with previous year data.
📅 Dynamic Month Selection Filters – Analyze recycling performance for any selected month.
🔎 KPI Group Filtering – Filter KPIs by categories such as operations, sustainability, and cost.
📊 KPI Trend Visualization – Analyze performance trends using dynamic charts.
📉 Performance Status Indicators – Visual icons highlight whether KPIs meet or miss targets.
📚 Detailed KPI Definitions – Drill-through pages provide formulas and explanations for each KPI.
⚡ Interactive Power BI Analytics – Explore recycling data using dynamic filters and slicers.
Because of these features, recycling managers gain complete visibility into operational performance and sustainability metrics.
📦 What’s Inside the Recycling Infrastructure KPI Dashboard in Power BI
This Power BI dashboard contains three analytical pages designed to analyze recycling operations from different perspectives.
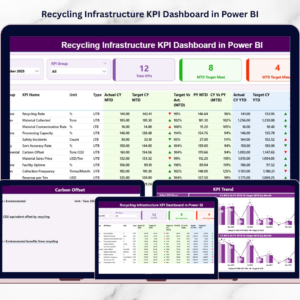
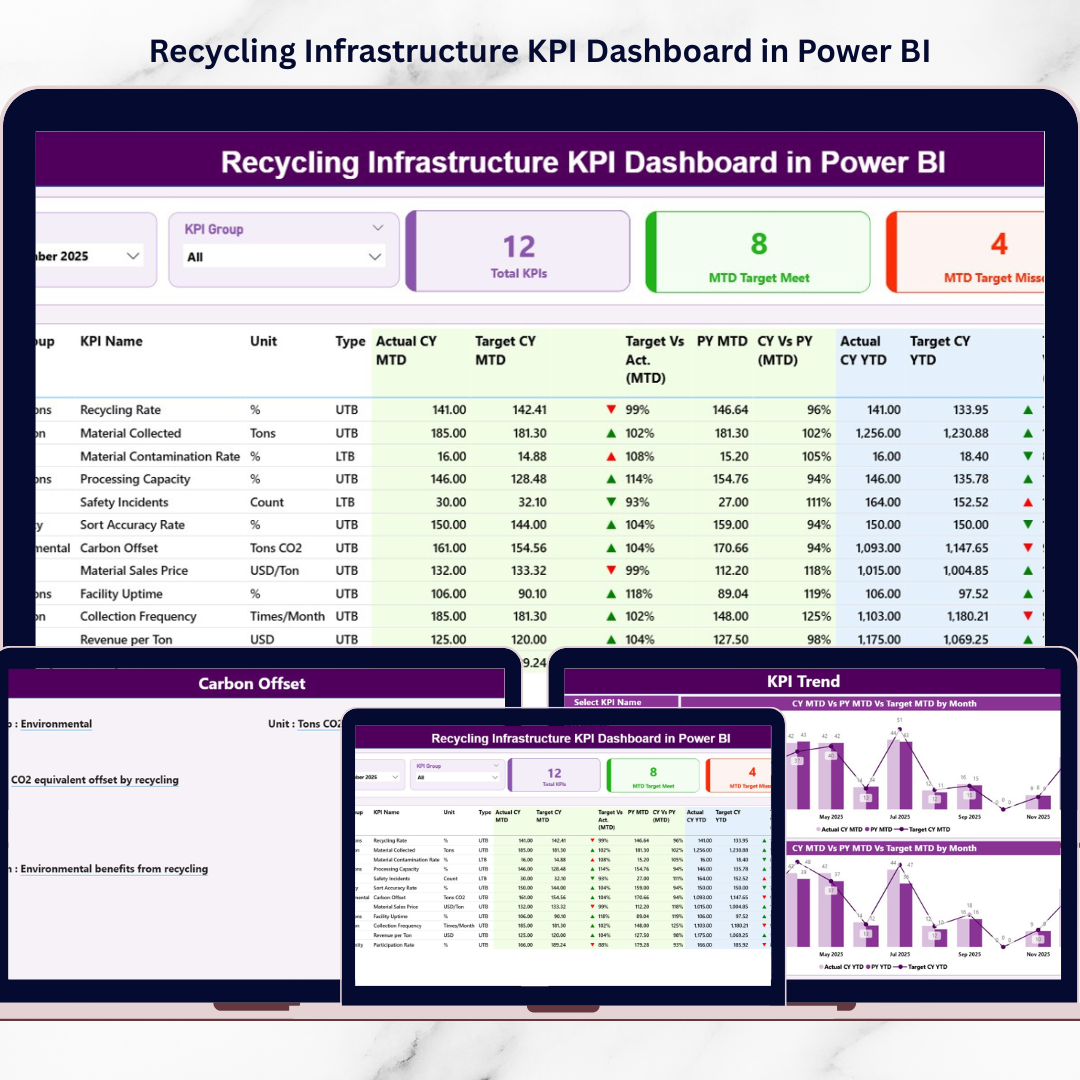
Summary Page
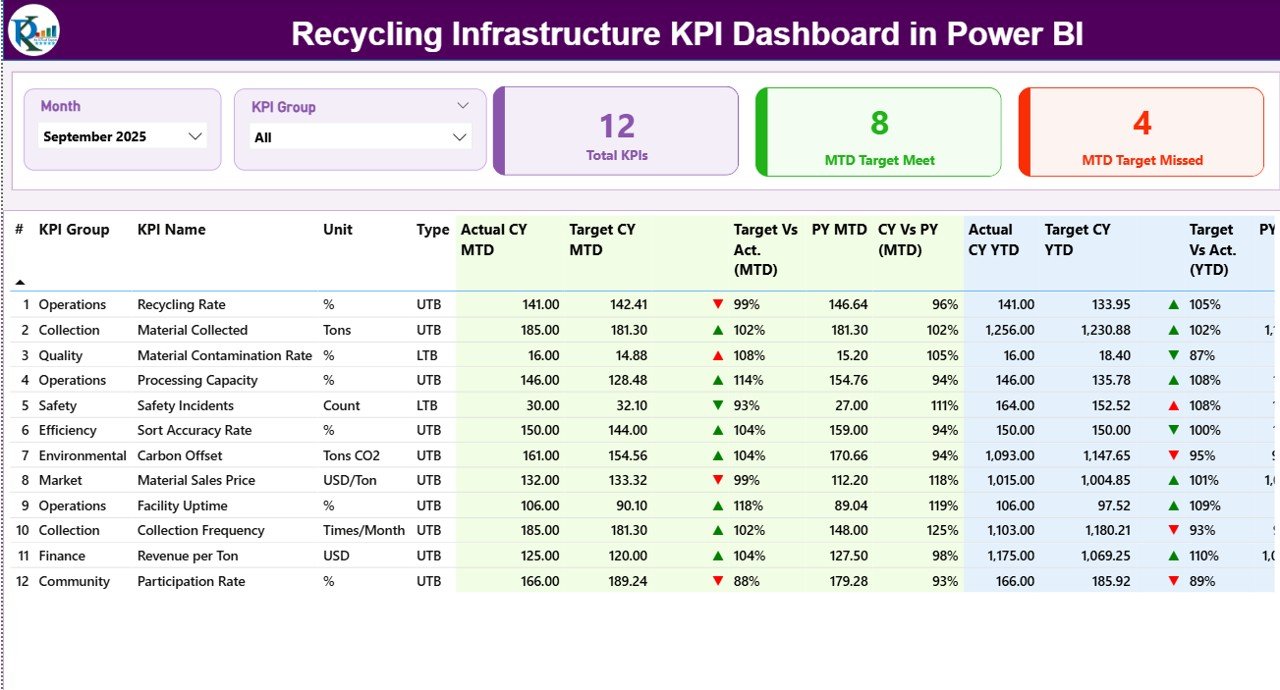
The Summary Page serves as the main performance monitoring screen.
It includes:
• Month slicer
• KPI Group slicer
Key KPI cards displayed:
Total KPIs Count
MTD Target Meet Count
MTD Target Missed Count
The page also includes a detailed KPI performance table that displays:
KPI Number
KPI Group
KPI Name
Unit
KPI Type (LTB / UTB)
Actual CY MTD
Target CY MTD
MTD Status Indicator
Target vs Actual %
PY MTD
CY vs PY %
In addition, the dashboard provides Year-To-Date (YTD) performance analysis, including:
Actual CY YTD
Target CY YTD
YTD Status Indicator
Target vs Actual (YTD)
PY YTD
CY vs PY (YTD)
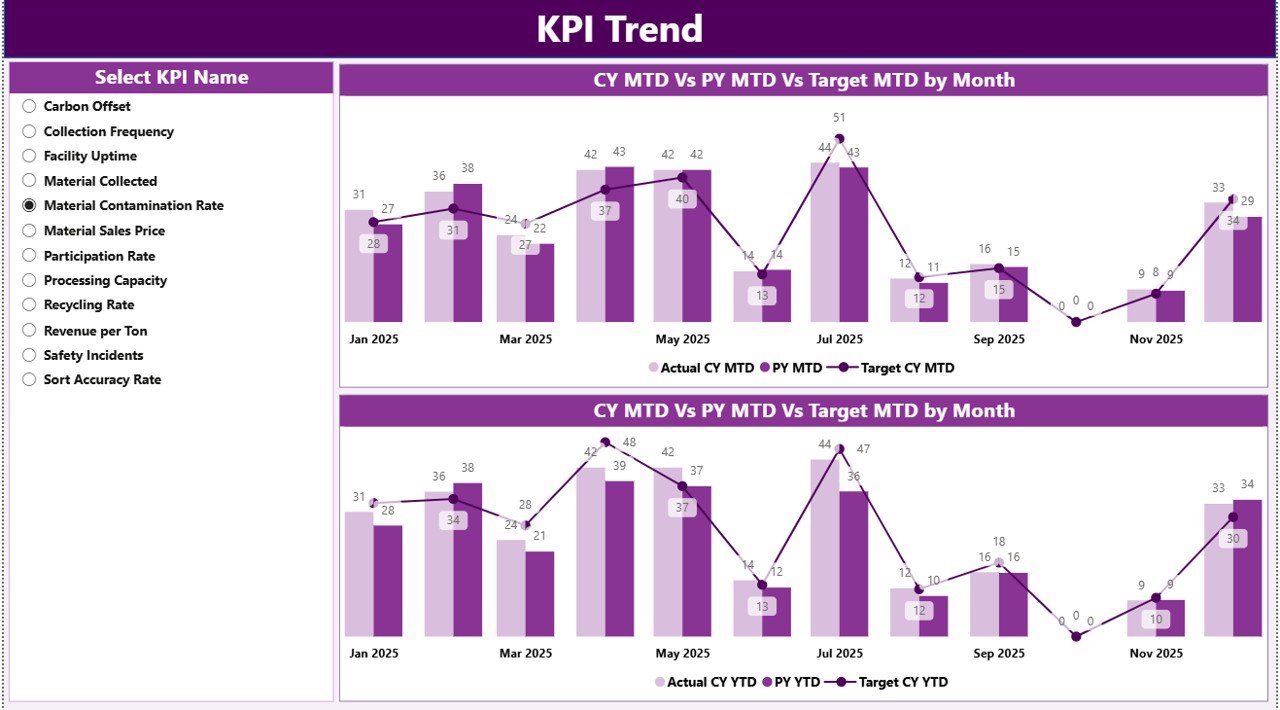
KPI Trend Page
The KPI Trend Page visualizes recycling performance trends over time.
This page contains:
• MTD trend chart
• YTD trend chart
Each chart compares:
Current Year Actual
Previous Year Actual
Target Values
Users can select any KPI using the KPI Selection slicer, and the charts update automatically.
This feature allows managers to analyze recycling performance patterns and identify operational trends.
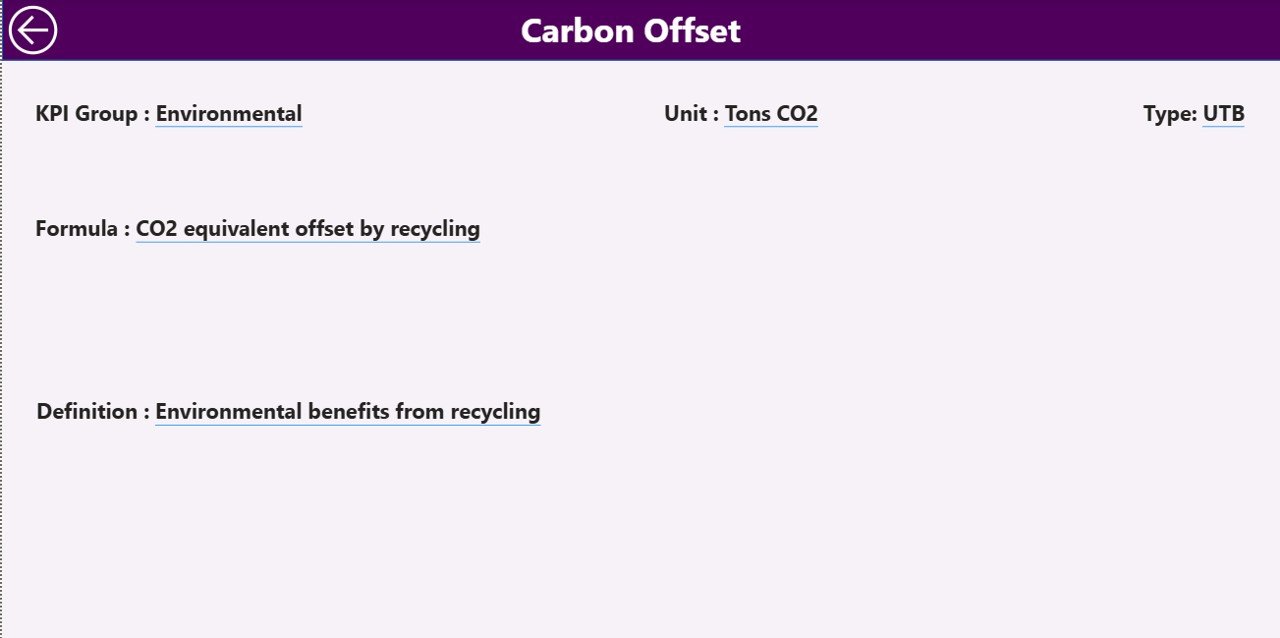
KPI Definition Page
The KPI Definition Page provides detailed explanations of each KPI.
Information displayed includes:
KPI Number
KPI Group
KPI Name
Unit
KPI Formula
KPI Definition
KPI Type (LTB / UTB)
This page acts as a drill-through reference library, ensuring transparency in KPI calculations.
A Back Button allows users to quickly return to the main dashboard.
⚙️ How to Use the Recycling Infrastructure KPI Dashboard
Using this dashboard is simple and efficient.
1️⃣ Enter recycling KPI data in the Excel data source file.
2️⃣ Update the Actual KPI values and Target values.
3️⃣ Refresh the Power BI dashboard.
4️⃣ Use filters to analyze performance by month or KPI group.
5️⃣ Review KPI cards, tables, and trend charts.
Once data is refreshed, the dashboard automatically updates all visuals and indicators.
This enables recycling managers to monitor performance quickly and identify improvement opportunities.
👥 Who Can Benefit from This Recycling KPI Dashboard
This dashboard is designed for professionals involved in recycling infrastructure and environmental sustainability.
It is especially useful for:
♻️ Waste Management Companies
🏙 Municipal Recycling Departments
🌍 Environmental Agencies
🏭 Recycling Processing Facilities
📊 Sustainability Analysts
📈 Environmental Consultants
Because the dashboard combines operational metrics, sustainability KPIs, and performance analytics, it supports both operational teams and strategic decision-makers.
💡 Why Organizations Use Recycling KPI Dashboards
✔ Centralized monitoring of recycling operations
✔ Improved sustainability performance tracking
✔ Faster identification of operational inefficiencies
✔ Better target monitoring and performance benchmarking
✔ Improved waste management planning
✔ Data-driven environmental decision-making
✔ Enhanced transparency for regulatory reporting
✔ Improved operational efficiency
Instead of relying on manual reports, organizations can use Power BI analytics to transform recycling data into actionable insights.
This dashboard helps organizations improve recycling performance, achieve sustainability goals, and support smarter waste management strategies.
### Click here to read the Detailed blog post
Visit our YouTube channel to learn step-by-step video tutorials
Youtube.com/@PKAnExcelExpert