Organizations today operate in complex regulatory environments. Businesses must comply with various rules related to financial reporting, data privacy, labor regulations, environmental standards, and workplace safety. Because regulatory requirements continue to evolve, organizations must continuously monitor compliance performance to avoid penalties, legal risks, and operational disruptions.
However, many companies still track compliance activities using scattered spreadsheets and manual reports. As a result, managers struggle to identify compliance risks, track regulatory checks, and evaluate compliance performance across departments and locations.
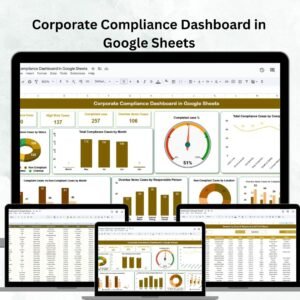
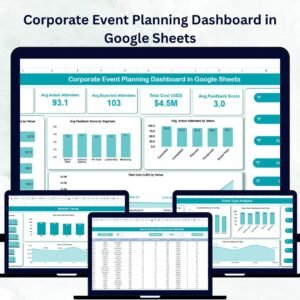
That is where the Compliance Dashboard in Google Sheets becomes an extremely powerful solution.
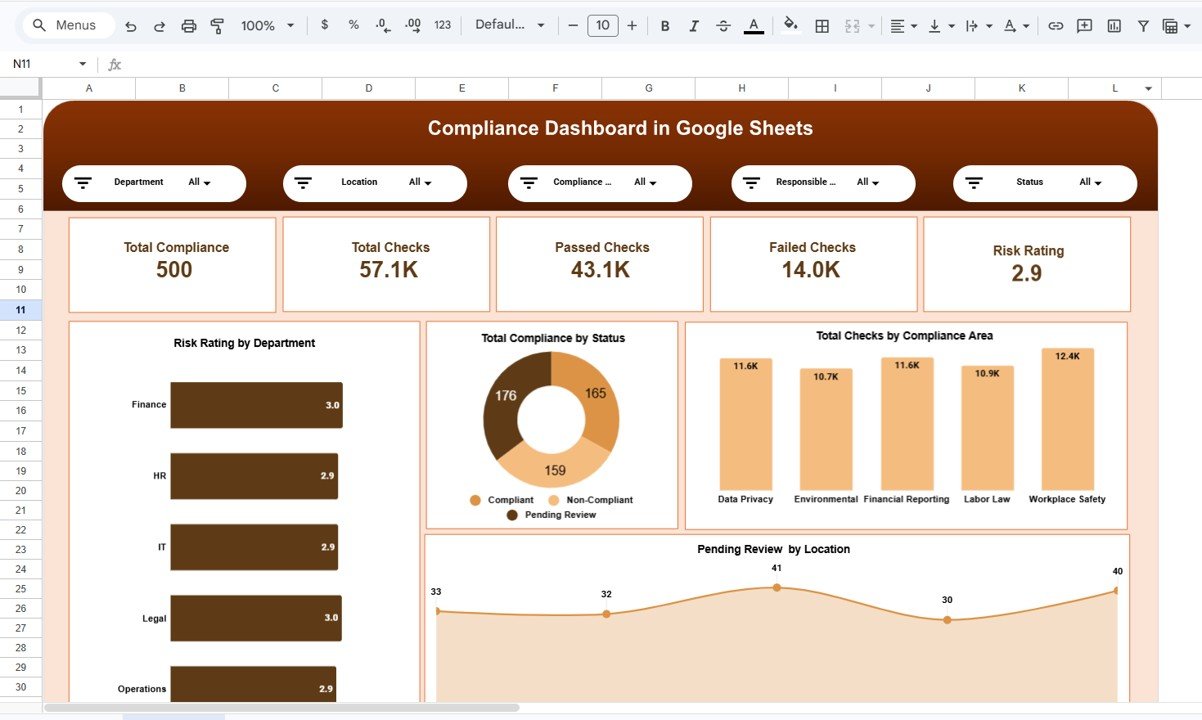
This ready-to-use Google Sheets template helps organizations track compliance checks, monitor regulatory risks, and evaluate compliance performance using structured KPIs and visual analytics. Instead of reviewing multiple compliance reports, managers can analyze compliance data from one centralized dashboard.
Because the dashboard includes interactive charts, KPI cards, and dynamic filters, organizations can easily monitor compliance activities and take corrective action before risks escalate.
If your organization needs a simple yet effective compliance monitoring system, this Google Sheets compliance dashboard provides the perfect solution.
📊 Key Feature of Compliance Dashboard in Google Sheets
This dashboard includes several powerful features that help organizations monitor compliance performance efficiently.
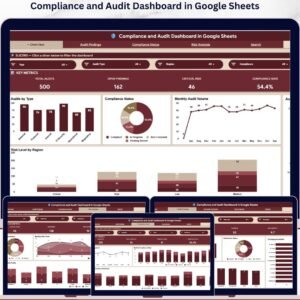
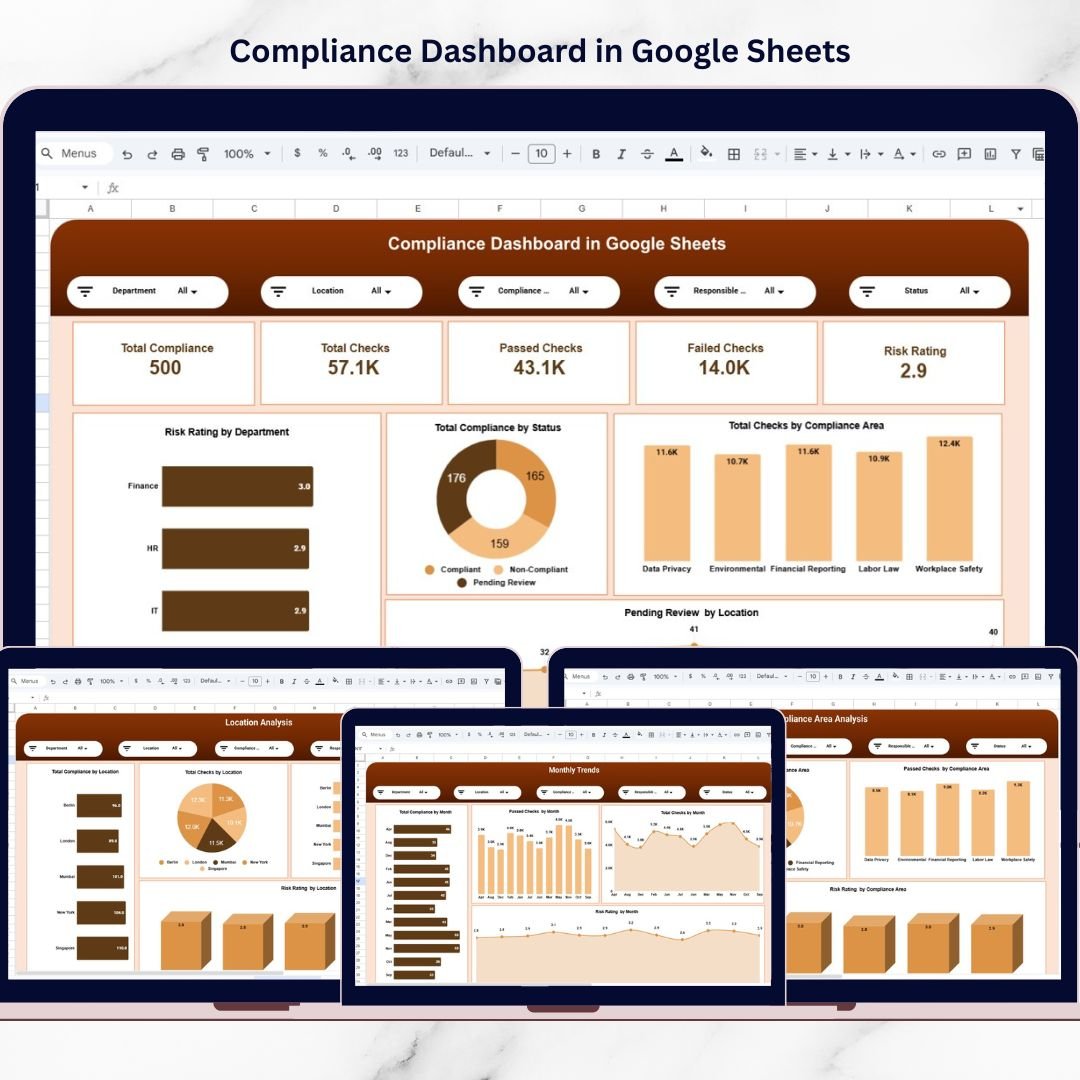
📊 Centralized Compliance Overview Dashboard – Monitor all compliance metrics from a single interactive page.
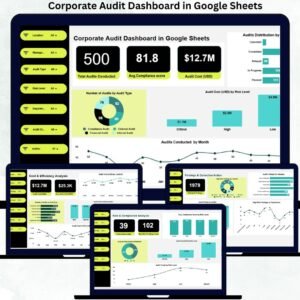
📋 Compliance KPI Cards – Track key metrics such as total records, total checks, passed checks, failed checks, and risk ratings.
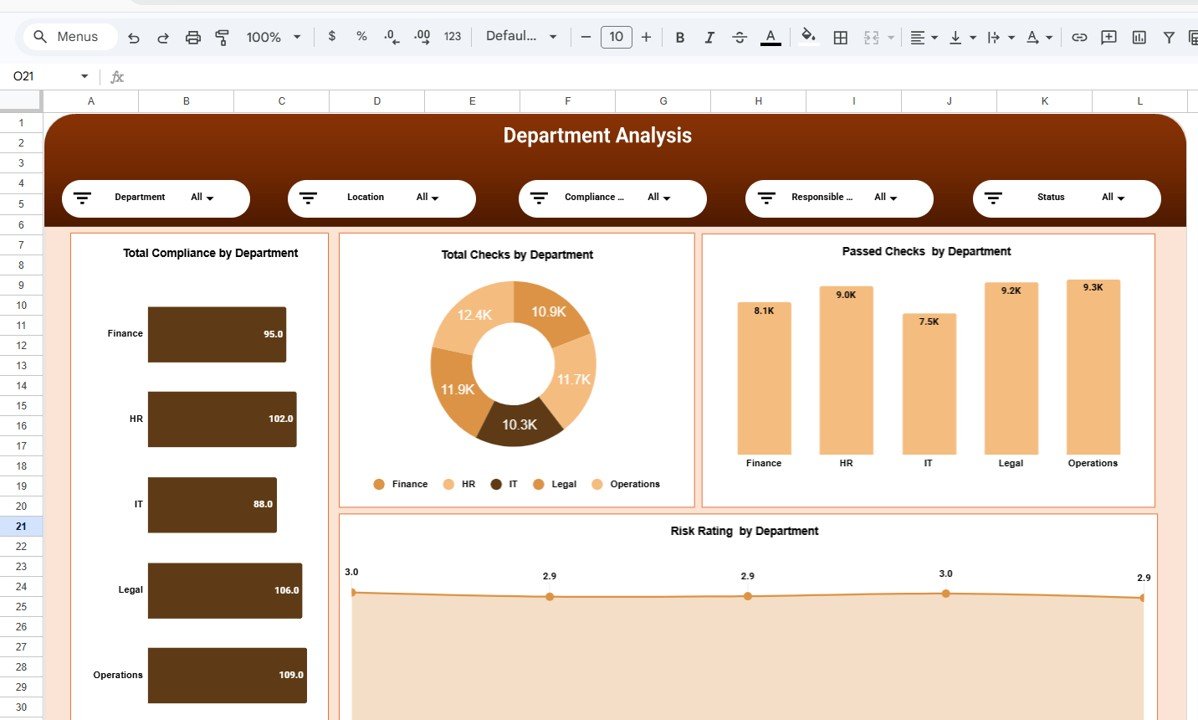
🏢 Department-Level Compliance Analysis – Evaluate regulatory performance across different departments.
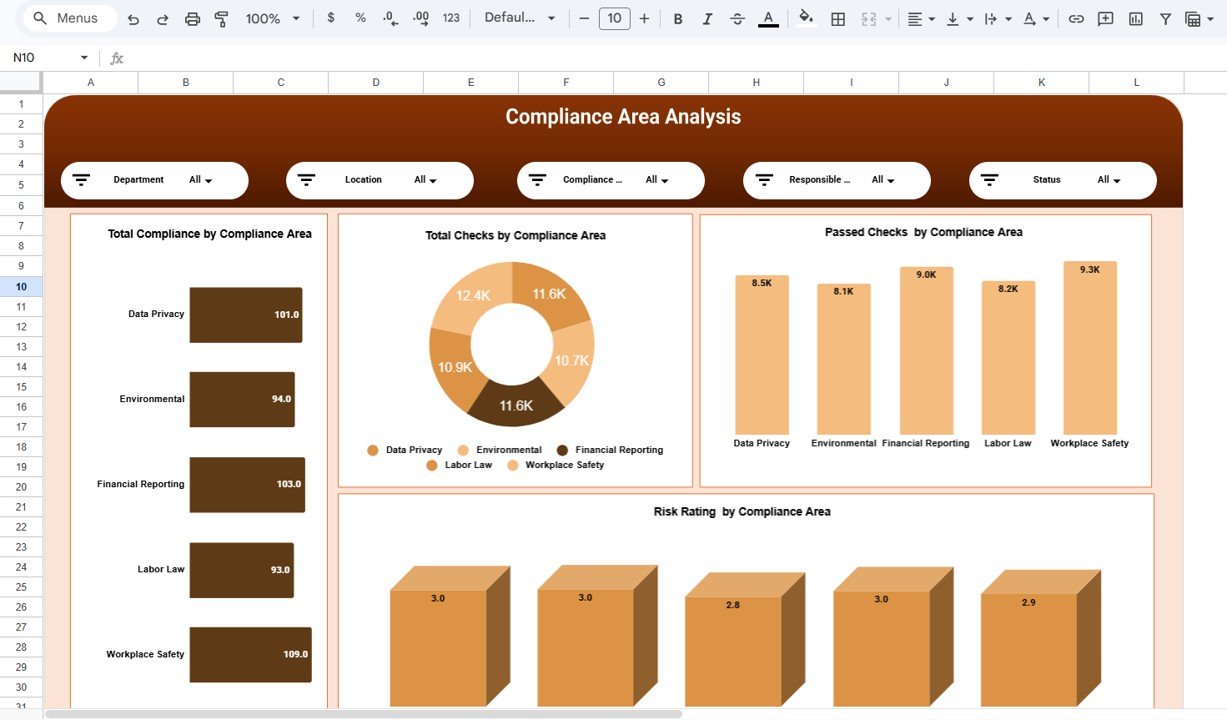
📑 Compliance Area Monitoring – Track compliance activities across multiple regulatory categories.
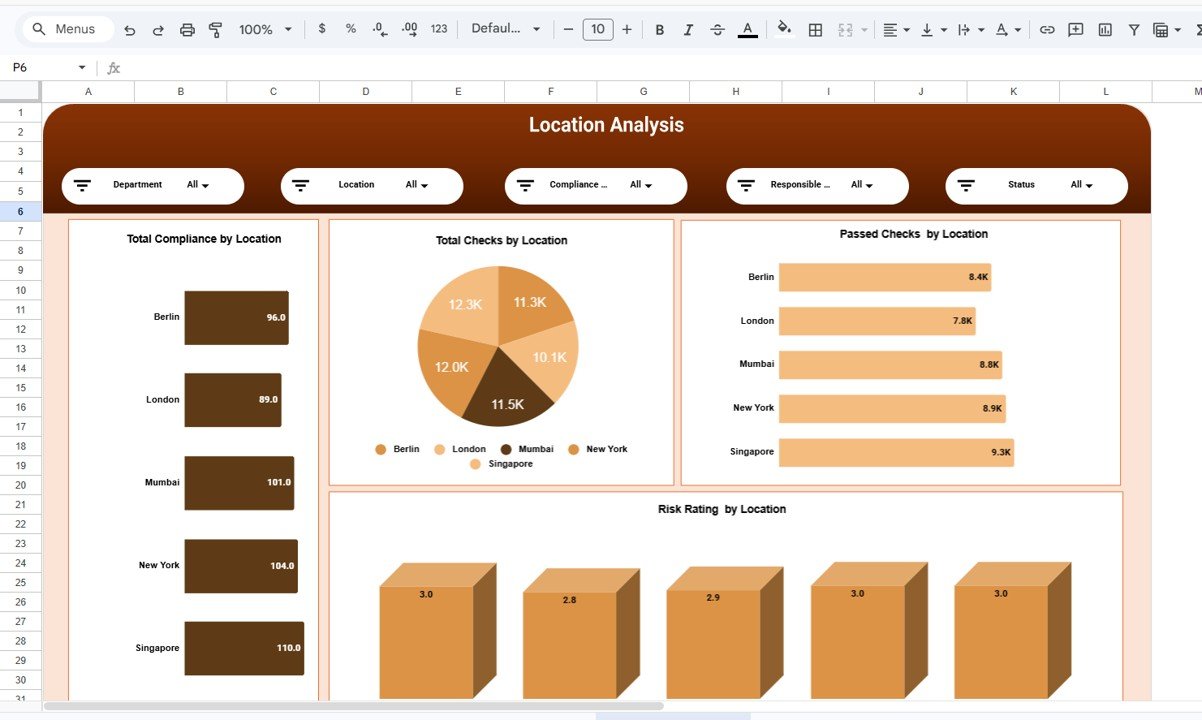
🌍 Location-Based Compliance Insights – Analyze compliance performance across different geographic locations.
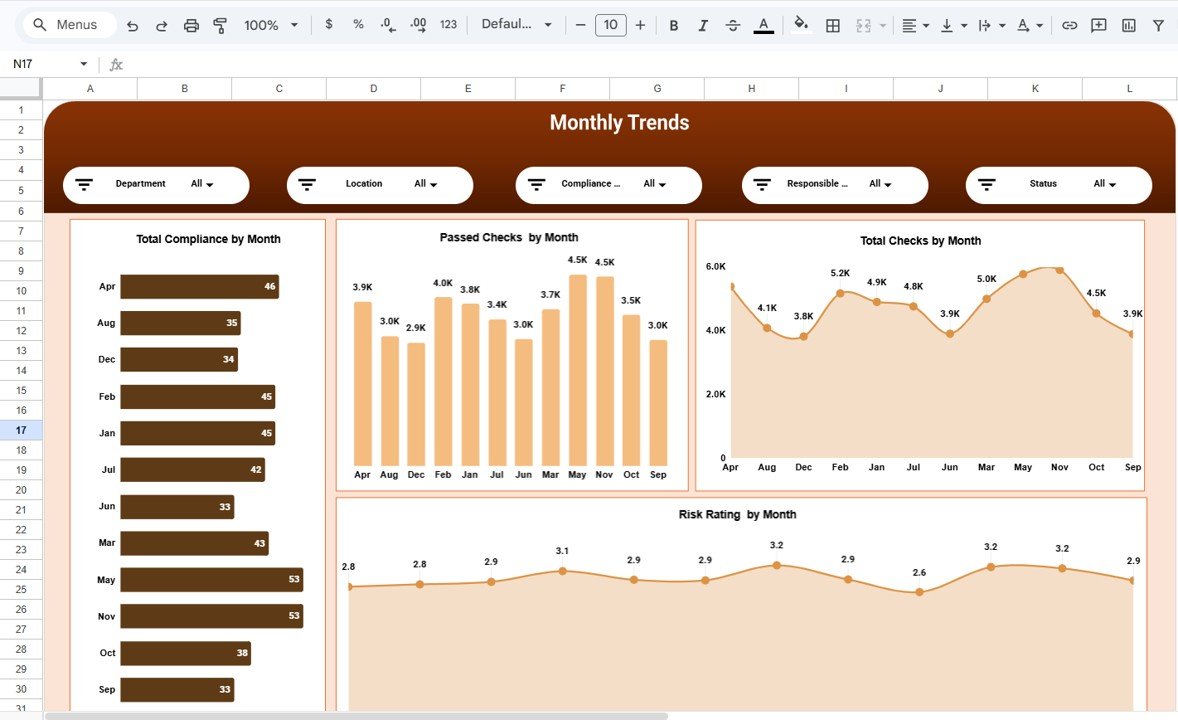
📅 Monthly Compliance Trend Analysis – Monitor compliance activities and improvements over time.
🔎 Interactive Filters & Slicers – Filter data by department, location, compliance area, responsible team, and status.
📉 Risk Rating Visualization – Identify high-risk compliance areas quickly using visual indicators.
☁️ Cloud-Based Collaboration – Multiple team members can access and update the dashboard simultaneously.
Because of these features, organizations can easily identify compliance gaps and strengthen regulatory governance.
📦 What’s Inside the Compliance Dashboard in Google Sheets
This template includes several analytical pages designed to monitor compliance performance from multiple perspectives.
Inside the template you will find:
✅ Overview Dashboard – High-level compliance performance summary
✅ Department Analysis Page – Compliance metrics by department
✅ Compliance Area Analysis Page – Regulatory performance by compliance area
✅ Location Analysis Page – Compliance insights by geographic location
✅ Monthly Trends Page – Compliance performance trends over time
The dashboard tracks important compliance metrics such as:
Total Compliance Records
Total Compliance Checks
Passed Compliance Checks
Failed Compliance Checks
Compliance Risk Rating
Users can also analyze compliance performance using filters such as:
Department
Location
Compliance Area
Responsible Person or Team
Compliance Status
Because of this structured approach, organizations gain clear visibility into regulatory performance.
⚙️ How to Use the Compliance Dashboard in Google Sheets
Using this compliance dashboard is simple and efficient.
1️⃣ Enter compliance records and check results in the dataset sheet.
2️⃣ Open the Overview Dashboard to review overall compliance metrics.
3️⃣ Use filters to analyze compliance performance by department, location, or compliance area.
4️⃣ Review departmental, regulatory, and location-level performance insights.
5️⃣ Monitor monthly compliance trends to identify improvements or issues.
Within seconds, compliance managers can analyze regulatory performance and detect compliance risks.
Because the dashboard uses automated charts and KPI cards, compliance monitoring becomes much easier.
👥 Who Can Benefit from This Compliance Dashboard
This dashboard is designed for professionals responsible for regulatory monitoring and risk management.
It is especially useful for:
🏢 Compliance Managers
⚖️ Legal and Regulatory Teams
📊 Risk Management Professionals
👩💼 Internal Audit Teams
🏭 Operations Managers
📈 Corporate Governance Teams
Because the template uses Google Sheets, teams can collaborate easily and maintain up-to-date compliance records.
💡 Why Organizations Use This Compliance Dashboard
✔ Centralized compliance performance monitoring
✔ Improved visibility of compliance risks
✔ Faster identification of regulatory issues
✔ Better audit preparation and reporting
✔ Clear departmental and location-based compliance analysis
✔ Data-driven regulatory decision-making
✔ Cloud collaboration for compliance teams
✔ Structured and scalable compliance monitoring system
Instead of managing compliance through fragmented reports, organizations gain a centralized analytics system that helps strengthen regulatory governance.
This dashboard transforms compliance data into actionable insights that help organizations reduce risks and maintain regulatory standards.
### Click here to read the Detailed blog post
Watch the step-by-step video tutorial:
Visit our YouTube channel to learn step-by-step video tutorials
Youtube.com/@NeotechNavigators