E-logistics Startups Dashboard industry is growing rapidly as online shopping, quick commerce, and digital marketplaces continue to expand. Every day, logistics startups handle thousands of deliveries, manage different vehicle types, coordinate multiple operating teams, and serve customers across various cities.
Because of this operational complexity, logistics companies must constantly monitor delivery performance, operational costs, customer satisfaction, and revenue trends. However, many startups still depend on scattered spreadsheets and manual reports. As a result, managers struggle to analyze business performance clearly and identify operational issues quickly.
That is where the E-Logistics Startups Dashboard in Power BI becomes a powerful analytics solution.
This ready-to-use Power BI dashboard transforms raw logistics data into interactive visual insights. Instead of reviewing multiple reports, managers can monitor delivery performance, analyze operational costs, track customer satisfaction, and evaluate revenue trends from one centralized dashboard.
Because Power BI provides dynamic charts, KPI cards, and interactive filters, decision-makers can analyze logistics data quickly and make faster data-driven decisions.
If you want better visibility into your logistics operations and improved operational efficiency, this dashboard provides an effective and scalable solution.
🚚 Key Feature of E-Logistics Startups Dashboard in Power BI
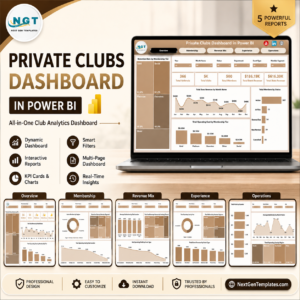
This Power BI dashboard includes five powerful analytical pages that allow logistics startups to monitor operations from multiple perspectives.
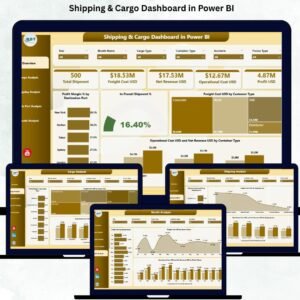
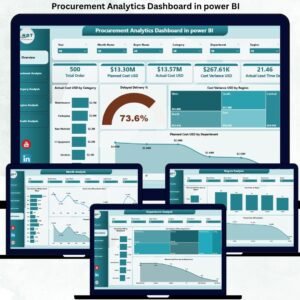
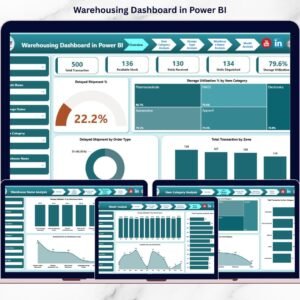
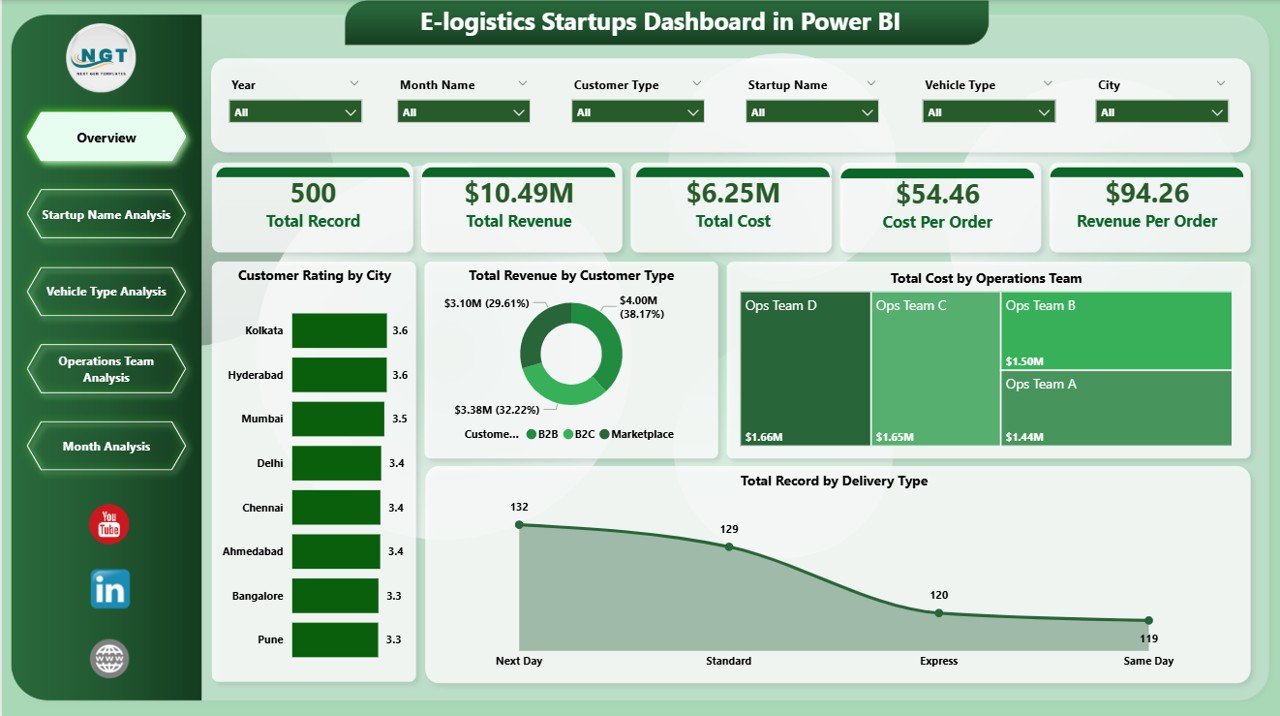
📊 Interactive Overview Dashboard – Get a quick snapshot of overall logistics performance.
🚚 Delivery Performance Monitoring – Track total delivery records by delivery type.
💰 Revenue Analysis by Customer Type – Understand which customer groups generate the highest revenue.
⭐ Customer Satisfaction Monitoring – Evaluate customer ratings by city and operational segments.
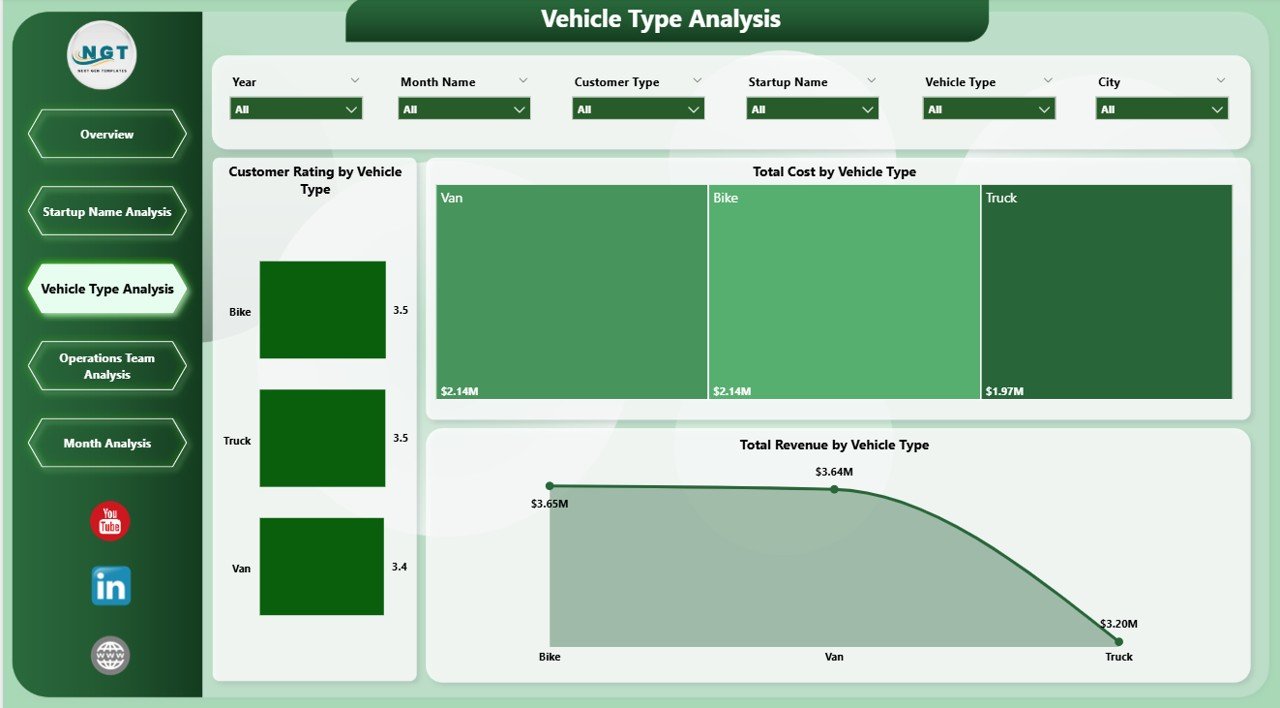
🚗 Vehicle Type Performance Analysis – Compare cost, revenue, and satisfaction by vehicle type.
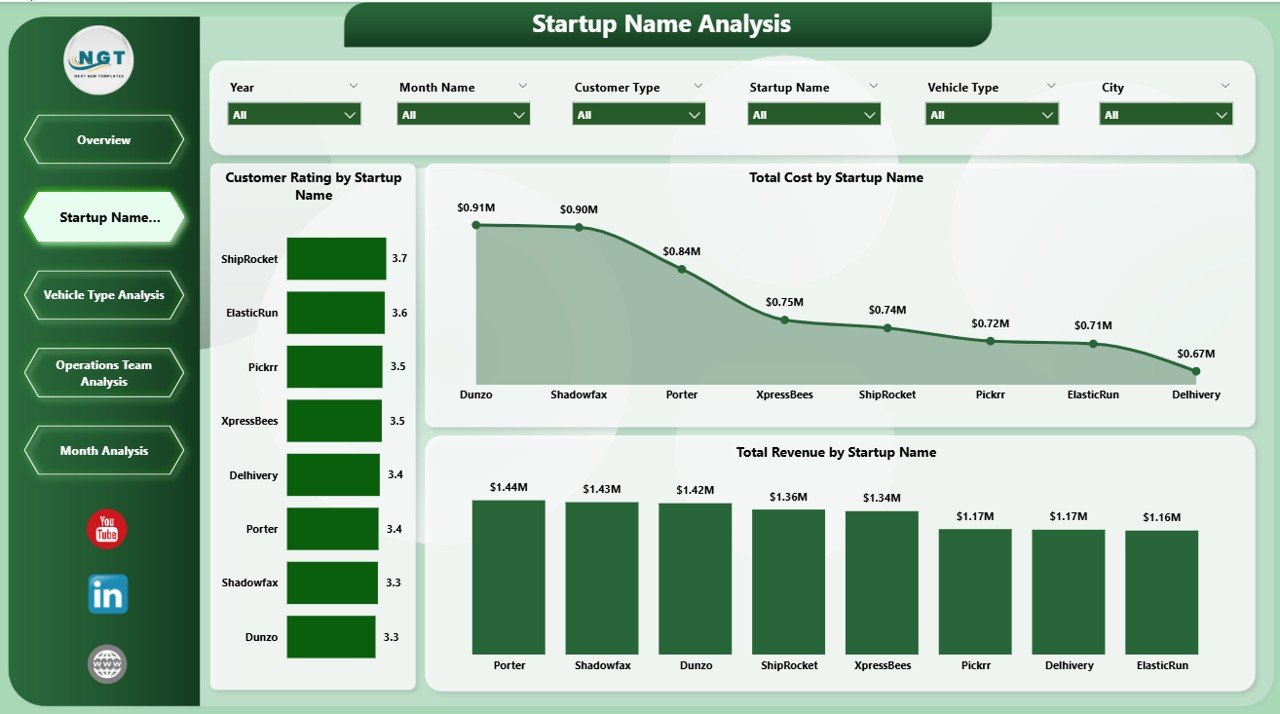
🏢 Startup Name Analysis – Compare operational performance across different logistics startup brands.
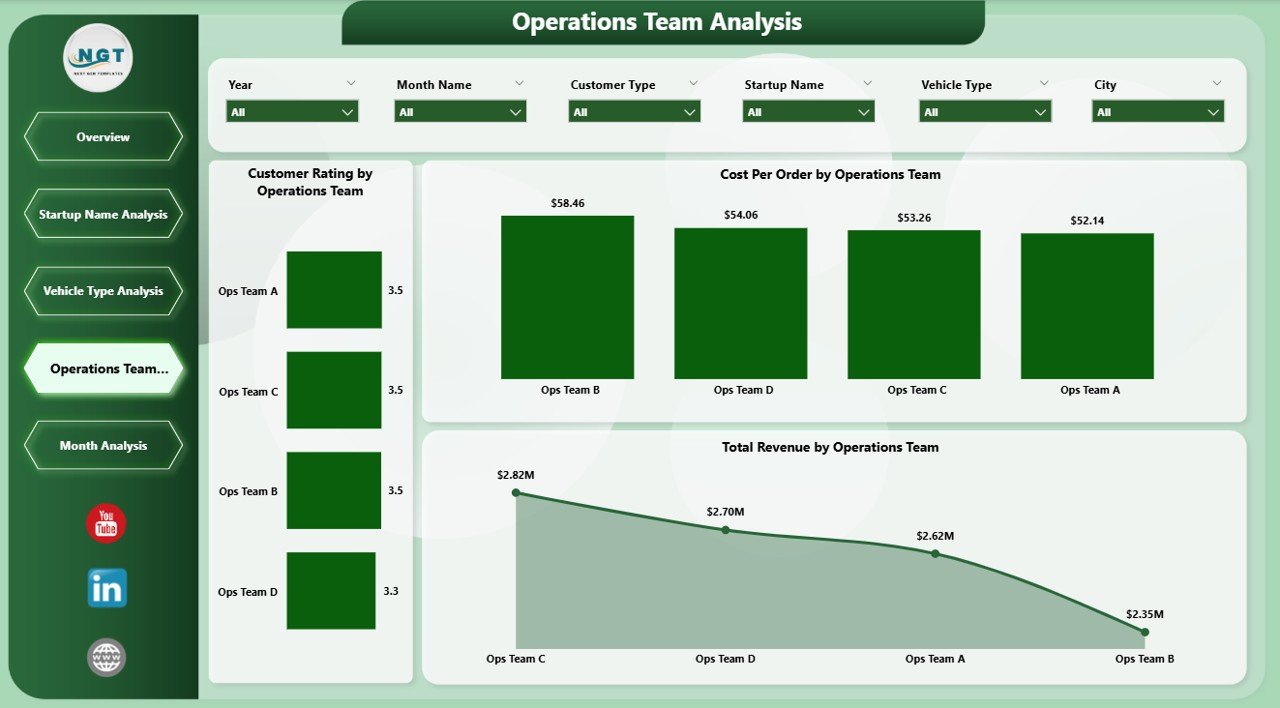
👨💼 Operations Team Performance Tracking – Monitor operational efficiency across logistics teams.
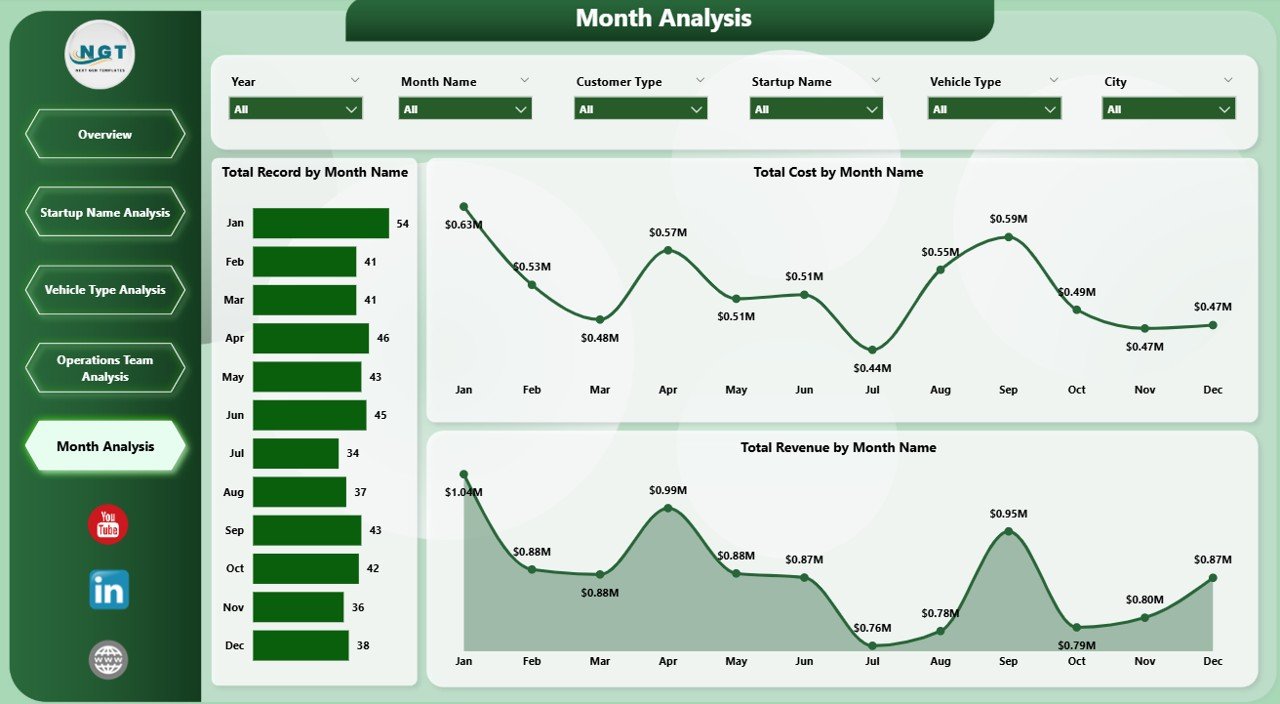
📅 Monthly Trend Analysis – Analyze delivery performance, cost, and revenue trends over time.
🔎 Dynamic Filters & Slicers – Explore data by city, startup name, vehicle type, or operational team.
Because of these features, managers can easily identify performance gaps and optimize logistics operations.
📦 What’s Inside the E-Logistics Startups Dashboard in Power BI
This ready-to-use dashboard is designed using Power BI for visualization and structured logistics data as the source.
Inside the dashboard you get:
✅ Overview Page – High-level operational performance insights
✅ Startup Name Analysis Page – Startup brand performance comparison
✅ Vehicle Type Analysis Page – Fleet efficiency and revenue analysis
✅ Operations Team Analysis Page – Team performance monitoring
✅ Month Analysis Page – Time-based logistics performance trends
✅ Interactive KPI Cards – Key logistics performance indicators
✅ Dynamic Charts and Filters – Flexible operational analysis
The dashboard analyzes several important logistics data fields such as:
Delivery Type
Startup Name
Vehicle Type
Operating Team
City
Customer Rating
Revenue
Cost
Month
Because Power BI integrates easily with multiple data sources, organizations can connect the dashboard with:
Excel files
Cloud databases
ERP systems
Logistics management software
This makes the dashboard scalable for growing logistics startups.
⚙️ How to Use the E-Logistics Startups Dashboard in Power BI
Using this dashboard is simple and user-friendly.
1️⃣ Import logistics data into Power BI from Excel or other operational systems.
2️⃣ Ensure the dataset includes delivery records, costs, revenue, vehicle types, operating teams, and customer ratings.
3️⃣ Refresh the Power BI dashboard to update all charts and visuals.
4️⃣ Use slicers to filter data by vehicle type, startup name, city, or operational team.
5️⃣ Analyze logistics performance and identify areas for improvement.
Within seconds, decision-makers gain a clear overview of logistics operations.
Even users with basic Power BI knowledge can easily explore insights and interpret operational data.
👥 Who Can Benefit from This E-Logistics Startups Dashboard in Power BI
This dashboard is designed for professionals working in logistics and delivery operations.
It is especially useful for:
🚚 Logistics Startup Founders
📦 Delivery Operations Managers
📊 Business Analysts
💰 Finance Teams
⭐ Customer Experience Teams
📈 Supply Chain Managers
🏢 E-commerce Fulfillment Teams
Because the dashboard combines operational, financial, and customer metrics, multiple departments can use it simultaneously.
💡 Why This Dashboard Improves Logistics Operations
✔ Centralized monitoring of logistics performance
✔ Faster identification of operational inefficiencies
✔ Improved fleet management and vehicle utilization
✔ Better cost control across delivery operations
✔ Enhanced customer satisfaction monitoring
✔ Clear comparison between logistics startups and teams
✔ Data-driven operational decision-making
✔ Scalable analytics platform using Power BI
Instead of relying on scattered spreadsheets, logistics companies can manage their operations using clear visual insights.
This dashboard converts logistics data into actionable intelligence that helps startups improve efficiency and scale their business faster.
### Click here to read the Detailed blog post
Visit our YouTube channel to learn step-by-step video tutorials
Youtube.com/@PKAnExcelExpert