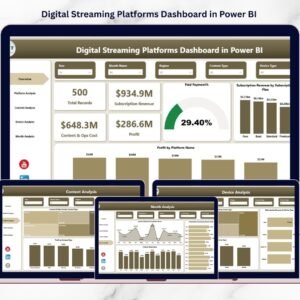
The digital entertainment industry is evolving rapidly. Millions of viewers now consume movies, TV shows, documentaries, and exclusive content through digital streaming platforms every day. Because of this massive growth, streaming companies must Digital Streaming Platforms Dashboard in Power BI continuously monitor subscriptions, revenue, operational costs, platform performance, and profitability.However, managing streaming analytics is not always simple. Many companies still rely on scattered spreadsheets, manual reports, or disconnected analytics tools. As a result, decision-makers struggle to understand which platform generates the most revenue, which content performs best, or which devices users prefer for streaming.This is exactly where the Digital Streaming Platforms Dashboard in Power BI becomes a powerful solution.This professionally designed Power BI dashboard transforms complex streaming data into clear, interactive visuals. It helps organizations monitor revenue, analyze costs, track platform performance, and identify profitable content instantly.Instead of reviewing multiple reports, managers can analyze everything through a single, centralized Power BI dashboard.
🚀 Key Features of Digital Streaming Platforms Dashboard in Power BI
✨ Five Interactive Analytical Pages
The dashboard includes five powerful pages designed to analyze streaming performance from multiple perspectives.
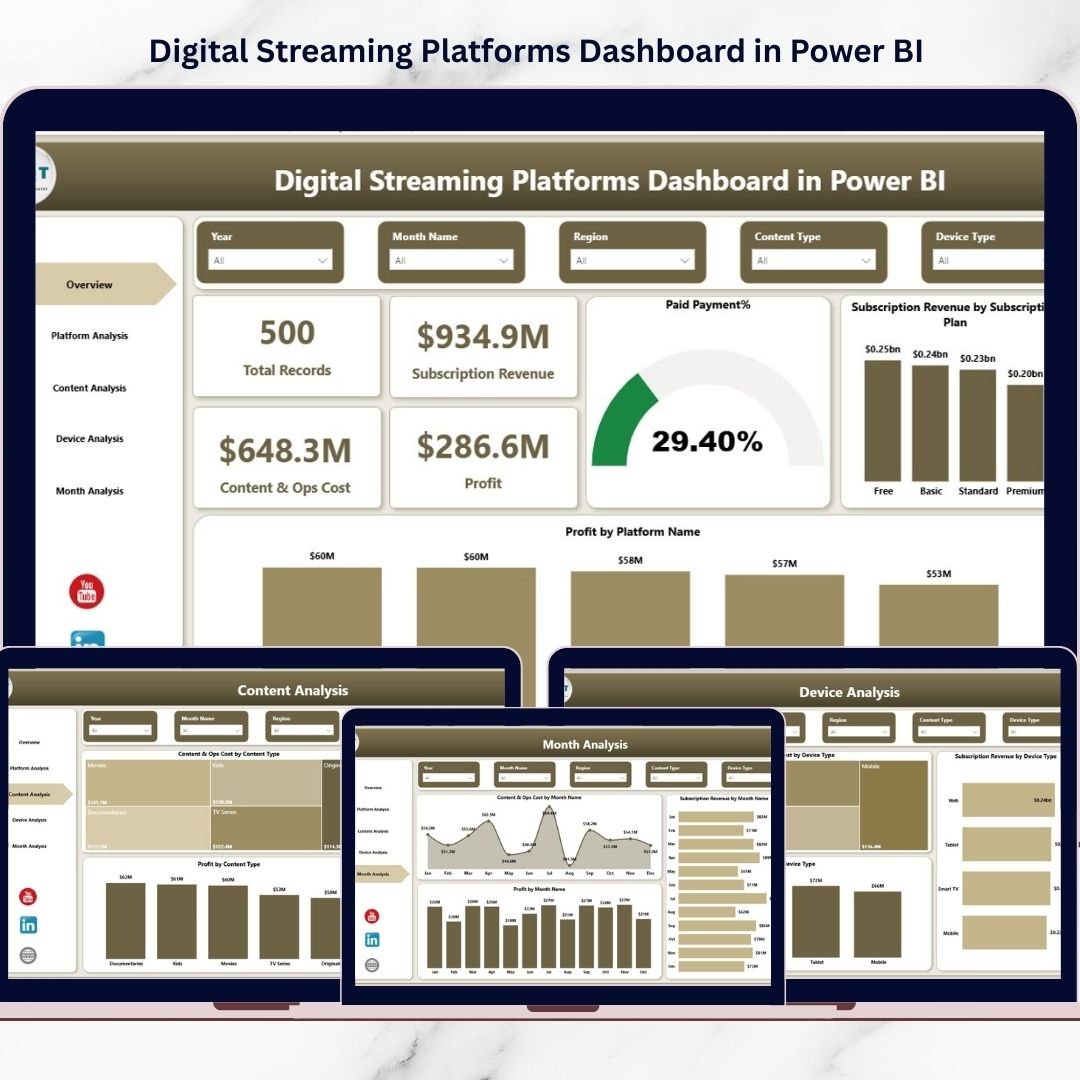
📊 Overview Page for Quick Insights
Instantly monitor Total Records, Subscription Revenue, Content & Operations Cost, and Profit using dynamic KPI cards.
📈 Subscription Plan Performance Analysis
Identify which subscription plans generate the highest revenue and paid subscription percentage.
📱 Platform Performance Monitoring
Analyze costs, revenue, and profitability across different platforms such as mobile apps, web browsers, and smart TVs.
🎬 Content Performance Analysis
Understand which content types and titles generate the highest revenue and profit.
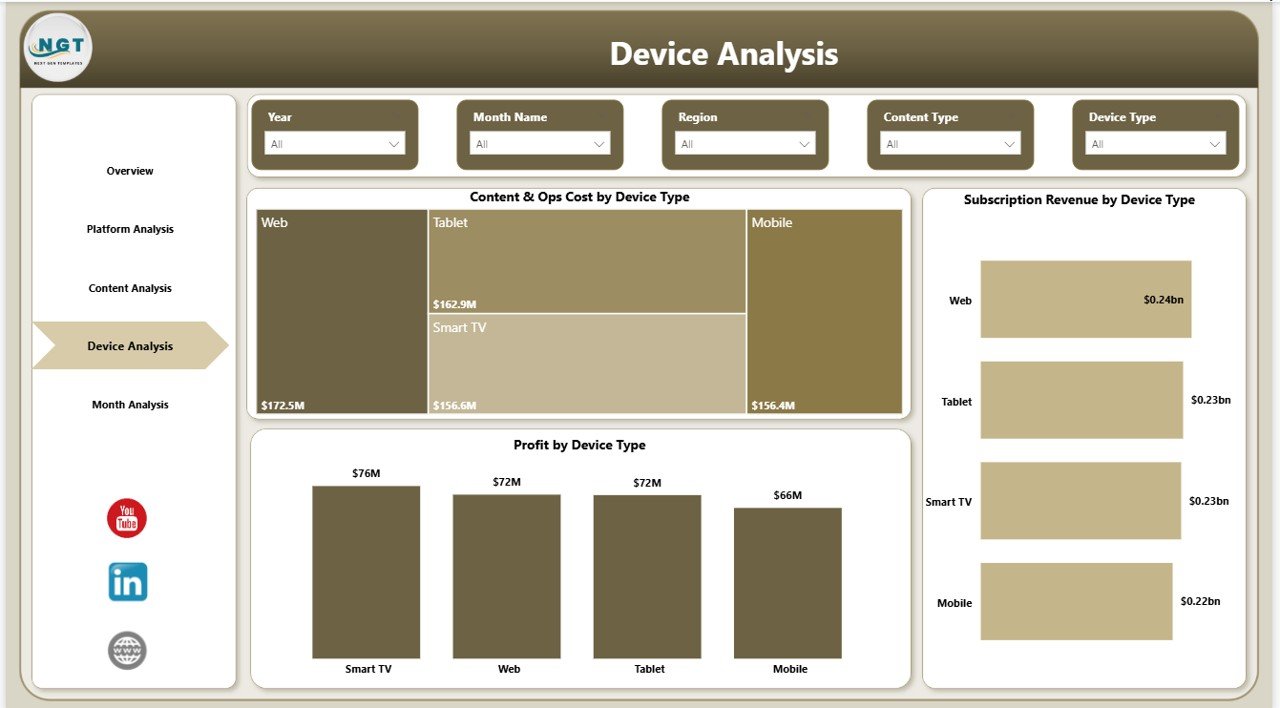
📺 Device Usage Insights
Track how users consume content across smartphones, tablets, laptops, and smart TVs.
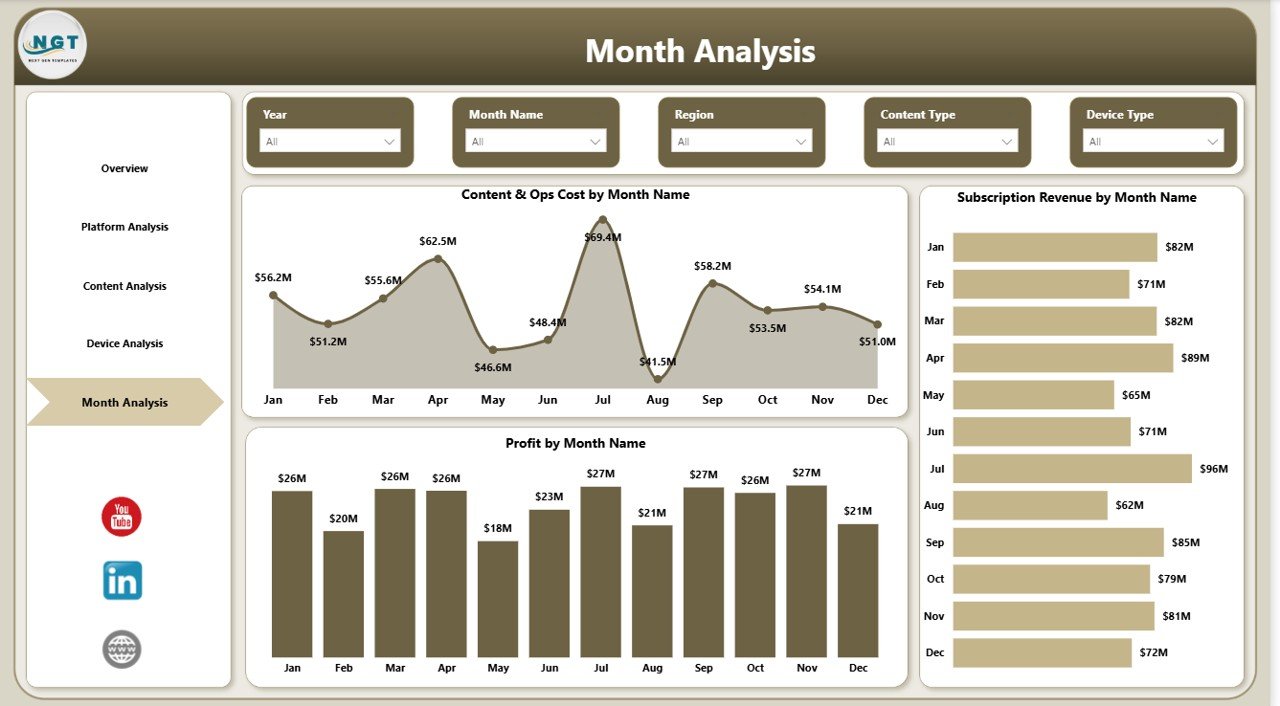
📅 Monthly Streaming Performance Tracking
Monitor revenue trends, operational costs, and profit changes by month.
🔎 Interactive Slicers and Filters
Easily explore data using interactive filters to analyze performance across different dimensions.
⚡ Fast and Visual Decision Making
Power BI visuals help executives and analysts instantly understand streaming business performance.
💼 Business-Focused KPIs
Track important streaming metrics such as subscription revenue, content costs, paid subscriptions, and platform profitability.
📊 Professional and Ready-to-Use Design
The dashboard is fully designed and ready to use, helping teams start analyzing streaming data immediately.
📦 What’s Inside the Digital Streaming Platforms Dashboard in Power BI
This template includes five powerful analytical pages designed for comprehensive streaming analytics.
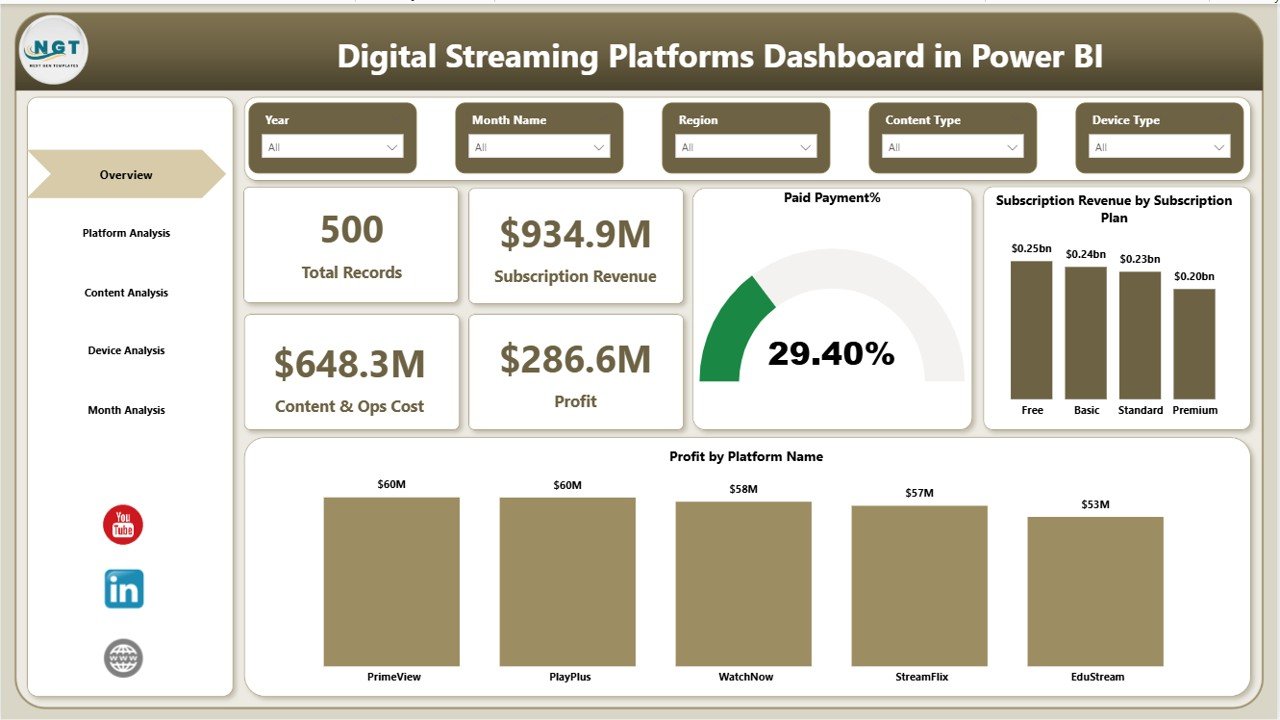
1️⃣ Overview Page
The Overview page provides a quick snapshot of streaming performance.
KPI Cards include:
-
Total Records
-
Subscription Revenue
-
Content & Operations Cost
-
Profit
Charts available on this page:
-
Paid Payment %
-
Subscription Revenue by Subscription Plan
-
Profit by Platform Name
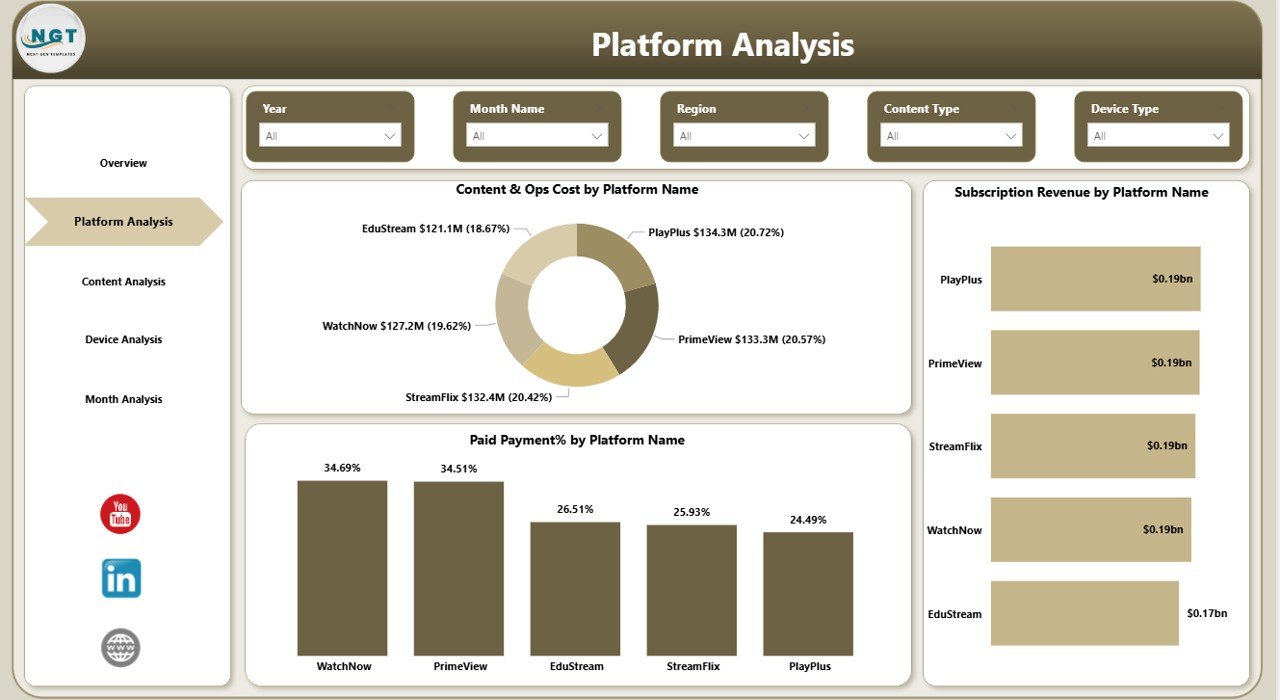
2️⃣ Platform Analysis Page
This page helps analyze performance across streaming platforms.
Charts included:
-
Content & Operations Cost by Platform Name
-
Subscription Revenue by Platform Name
-
Paid Invoice % by Platform Name
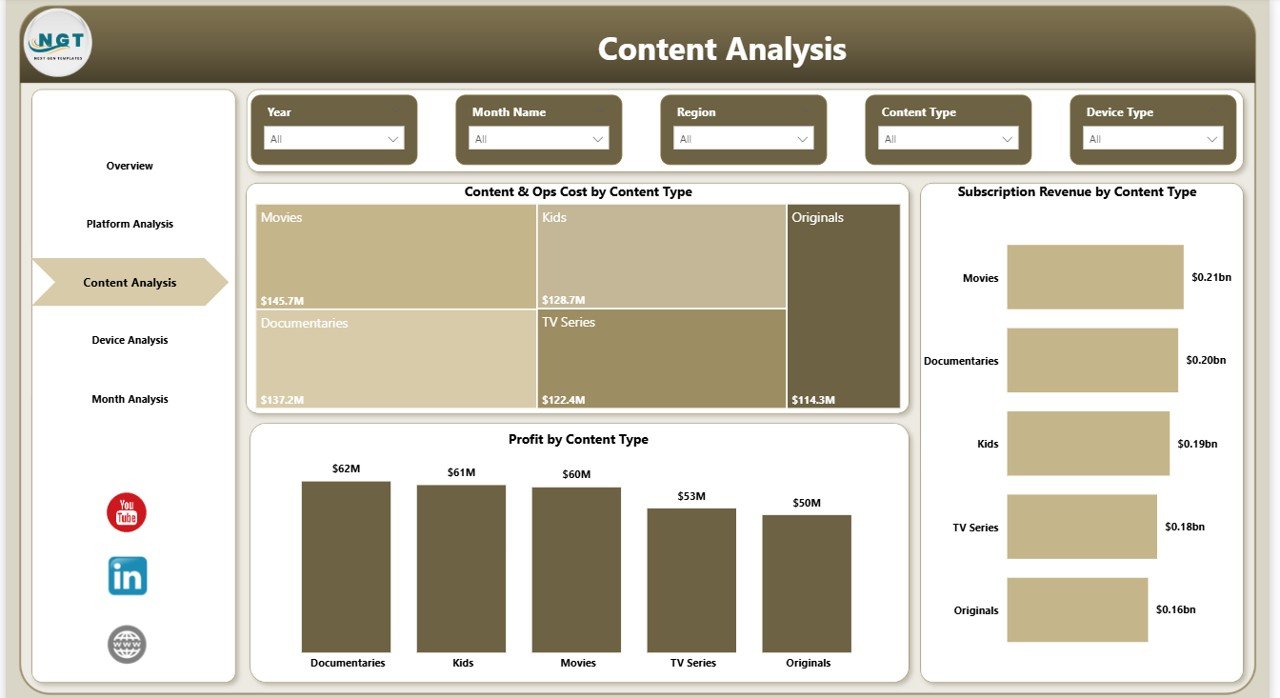
3️⃣ Content Analysis Page
This page focuses on understanding content performance.
Charts included:
-
Content & Operations Cost by Content Name
-
Subscription Revenue by Content Type
-
Profit by Content Type
4️⃣ Device Analysis Page
This page analyzes how viewers access streaming content.
Charts included:
-
Content & Operations Cost by Device Type
-
Subscription Revenue by Device Type
-
Profit by Device Type
5️⃣ Month Analysis Page
The final page provides monthly trend analysis.
Charts included:
-
Content & Operations Cost by Month
-
Revenue Trends by Month
-
Profit Trends by Month
⚙️ How to Use the Digital Streaming Platforms Dashboard in Power BI
Using this dashboard is extremely simple and user-friendly.
1️⃣ Import or connect your streaming dataset to Power BI.
2️⃣ Refresh the data to update the dashboard.
3️⃣ Use slicers and filters to analyze different platforms, content types, and devices.
4️⃣ Monitor KPIs and charts to evaluate streaming performance.
5️⃣ Use insights to optimize content strategy, pricing, and platform investments.
Because of its interactive design, users can quickly explore insights without technical expertise.
👥 Who Can Benefit from This Digital Streaming Platforms Dashboard in Power BI
This dashboard is ideal for many professionals working in the streaming and media industry.
🎬 Streaming Platform Companies – Track revenue, subscriptions, and operational costs.
📺 Media & Entertainment Businesses – Analyze content profitability and audience behavior.
📊 Data Analysts – Convert streaming data into visual insights.
💼 Business Executives – Monitor performance and make strategic decisions.
📈 Content Producers – Understand which content types generate the most revenue.
📱 OTT Platform Managers – Evaluate platform performance and optimize streaming strategy.
Click here to read the Detailed blog post
Watch the step-by-step video tutorial:
Visit our YouTube channel to learn step-by-step video tutorials
YouTube Channel: https://youtube.com/@PKAnExcelExpert