Railway infrastructure forms the backbone of national transportation systems. Every day, millions of passengers and massive volumes of cargo travel across railway networks. Because of this large-scale operation, railway authorities must continuously monitor infrastructure performance, operational efficiency, safety compliance, and maintenance activities.
However, many railway organizations still rely on fragmented reports and manual spreadsheets. As a result, managers struggle to track infrastructure performance, analyze KPI trends, and identify operational gaps quickly.
That is where the Railway Infrastructure KPI Dashboard in Power BI becomes an extremely valuable solution.
This ready-to-use Power BI dashboard converts raw railway performance data into interactive visual insights. Instead of reviewing multiple reports manually, railway managers can monitor key performance indicators, compare targets with actual results, analyze trends, and evaluate infrastructure efficiency through one centralized dashboard.
Because Power BI provides interactive visuals, filters, and automated calculations, decision-makers can analyze railway infrastructure performance quickly and make smarter data-driven decisions.
If you want to improve railway infrastructure monitoring and operational efficiency, this dashboard offers a powerful and practical analytics solution.
🚆 Key Feature of Railway Infrastructure KPI Dashboard in Power BI
This structured Power BI dashboard includes three analytical pages designed to monitor railway infrastructure KPIs effectively.
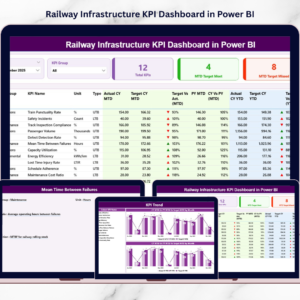
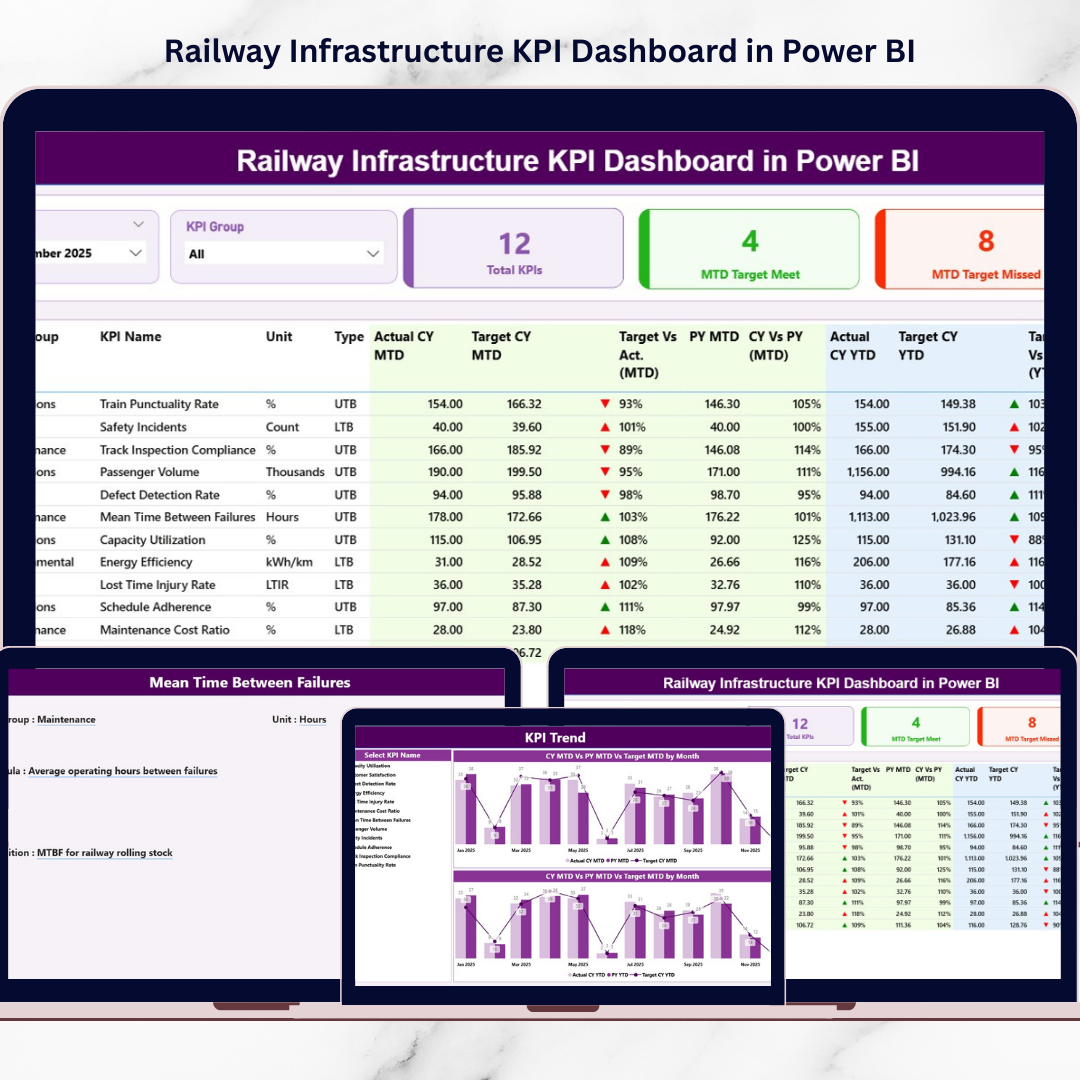
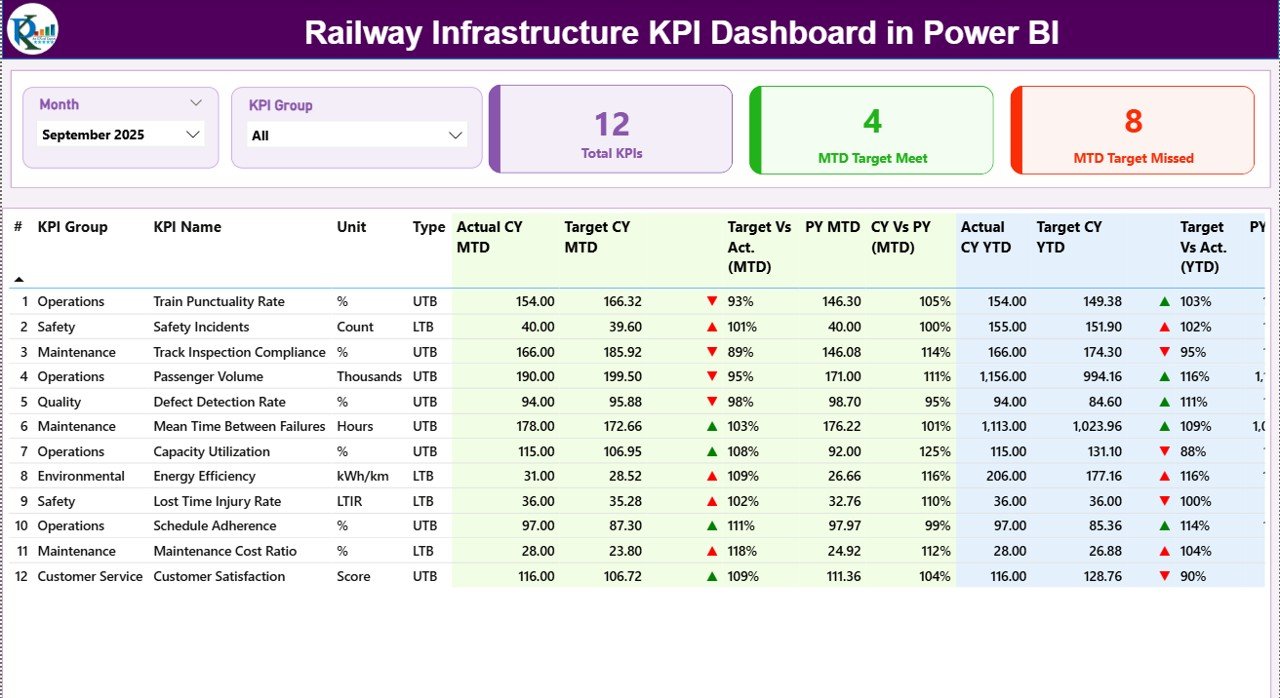
📊 Summary Dashboard Page – A central page displaying key infrastructure performance indicators.
🎯 Interactive Slicers – Filter the dashboard using Month and KPI Group slicers for dynamic analysis.
📈 KPI Performance Cards – Quickly view Total KPIs, Target Meet Count, and Target Missed Count.
📊 Detailed KPI Performance Table – Analyze KPI metrics including Actual vs Target and Previous Year comparisons.
📅 MTD KPI Monitoring – Track Month-To-Date KPI performance across infrastructure operations.
📆 YTD KPI Analysis – Monitor Year-To-Date KPI performance for long-term infrastructure insights.
⬆️⬇️ Performance Indicator Icons – Visual indicators highlight KPI performance status instantly.
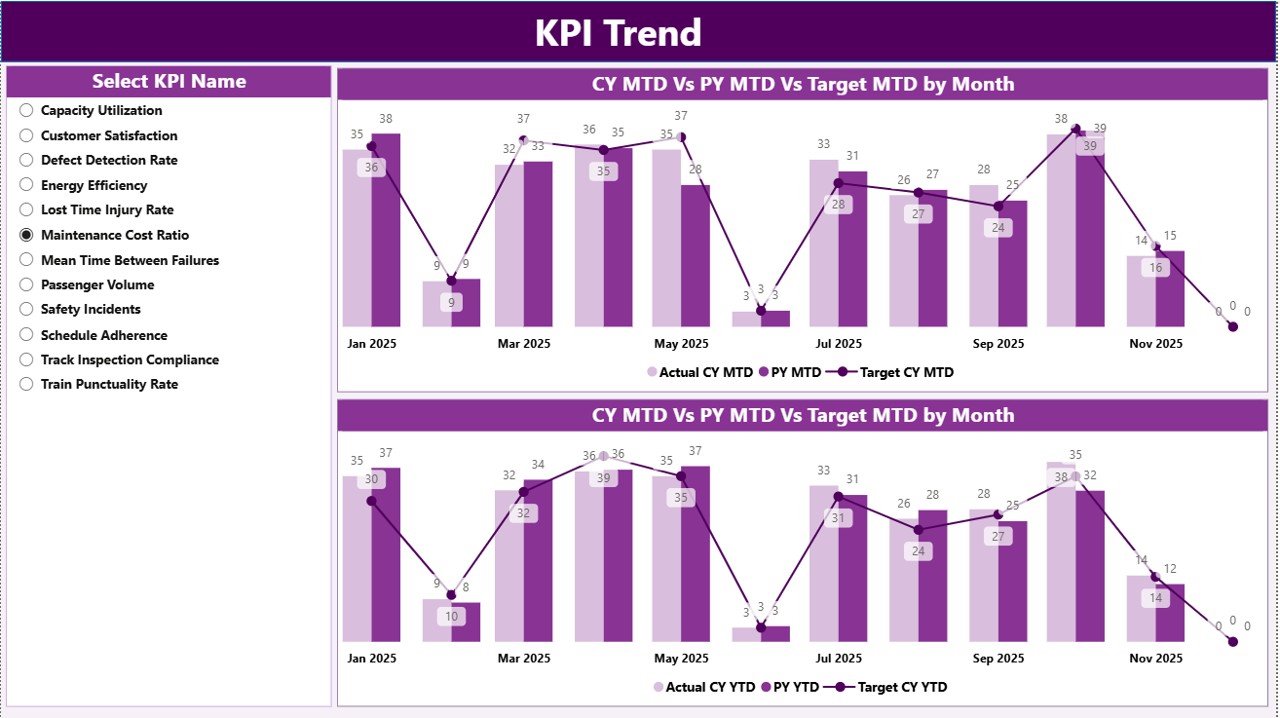
📈 KPI Trend Analysis Charts – Evaluate monthly and yearly KPI performance trends.
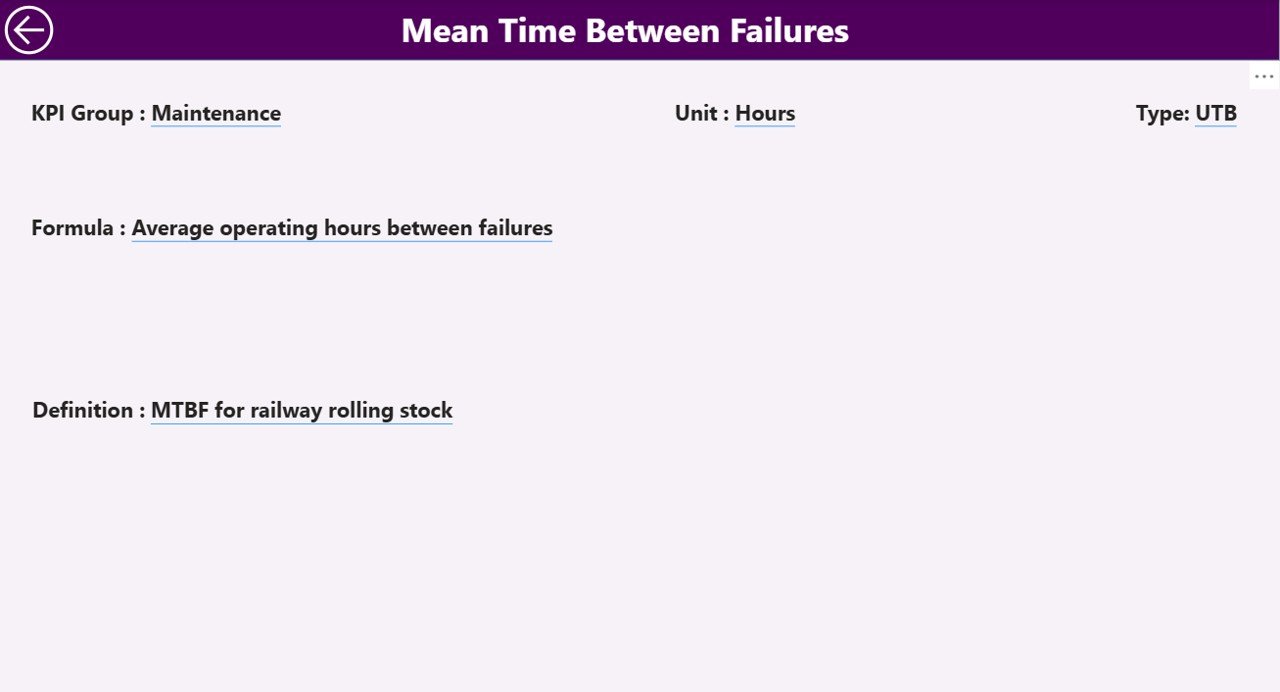
📘 KPI Drill-Through Page – Access detailed KPI formulas, definitions, and measurement units.
Because the dashboard updates dynamically, users can analyze infrastructure performance in seconds.
📦 What’s Inside the Railway Infrastructure KPI Dashboard in Power BI
The dashboard is built using Power BI for visualization and Excel as the data source, creating a flexible and scalable performance monitoring system.
Inside the dashboard you get:
✅ Summary Page – Central KPI monitoring interface
✅ KPI Trend Page – Detailed performance trend analysis
✅ KPI Definition Page – KPI formula and definition reference
✅ Interactive KPI Cards – Instant performance indicators
✅ Dynamic KPI Table – Detailed KPI performance comparisons
✅ Interactive Filters & Slicers – Easy data exploration
The dashboard typically uses structured Excel datasets that include:
KPI Number
KPI Group
KPI Name
Unit of Measurement
KPI Type (LTB or UTB)
Month
MTD Actual Value
MTD Target Value
YTD Actual Value
YTD Target Value
Previous Year Values
KPI Definition
KPI Formula
Because Power BI supports multiple data connections, organizations can integrate this dashboard with:
Excel spreadsheets
Railway operational databases
Maintenance systems
Asset management platforms
This flexibility allows the dashboard to scale as railway networks grow.
⚙️ How to Use the Railway Infrastructure KPI Dashboard in Power BI
Using the dashboard is simple and efficient.
1️⃣ Maintain KPI data in the Excel source file.
2️⃣ Enter actual KPI performance values in the Input_Actual Sheet.
3️⃣ Enter target values in the Input_Target Sheet.
4️⃣ Define KPI details in the KPI Definition Sheet.
5️⃣ Refresh the Power BI dashboard to update visuals.
6️⃣ Use slicers to filter KPIs by Month or KPI Group.
Within seconds, railway managers can analyze infrastructure performance and identify operational improvements.
Even users with basic Power BI knowledge can easily operate the dashboard.
👥 Who Can Benefit from This Railway Infrastructure KPI Dashboard in Power BI
This dashboard is designed for professionals responsible for railway infrastructure planning and performance monitoring.
It is particularly useful for:
🚆 Railway Authorities
🛠 Infrastructure Maintenance Teams
📊 Railway Operations Managers
🏛 Government Transportation Departments
📈 Railway Project Managers
📉 Infrastructure Performance Analysts
Because the dashboard simplifies complex infrastructure data into visual insights, both technical teams and executives can analyze KPI performance easily.
💡 Why This Dashboard Improves Railway Infrastructure Management
✔ Centralized KPI monitoring system
✔ Real-time infrastructure performance insights
✔ Faster identification of operational gaps
✔ Improved maintenance planning
✔ Clear comparison between targets and actual results
✔ Historical performance benchmarking
✔ Better infrastructure investment decisions
✔ Scalable and interactive Power BI analytics
Instead of relying on manual reports, railway authorities can use this dashboard to gain immediate insights into infrastructure performance.
This dashboard transforms operational data into actionable insights that support better railway management and planning.
### Click here to read the Detailed blog post
Visit our YouTube channel to learn step-by-step video tutorials
Youtube.com/@PKAnExcelExpert