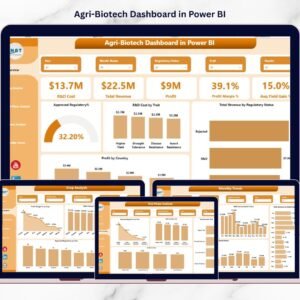
Agriculture is no longer just about cultivation — it is about data-driven decisions. Rising input costs, changing weather patterns, and fluctuating market prices demand smarter monitoring. Yet many farmers and agribusiness owners still depend on scattered spreadsheets.What if you could track revenue, cost, production, and profit — all in one powerful system?Agriculture Dashboard in Power BI is a ready-to-use, fully interactive analytics solution designed to transform raw farm data into clear, actionable insights. Instead of manually compiling reports, you can instantly monitor financial performance, production efficiency, and regional profitability.
This dashboard provides a complete 360° view of your agriculture operations across 5 powerful pages — helping you make faster, smarter, and more profitable decisions.
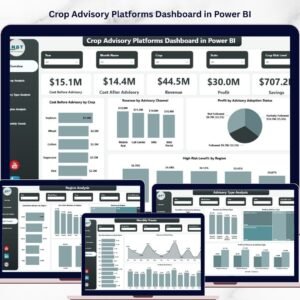
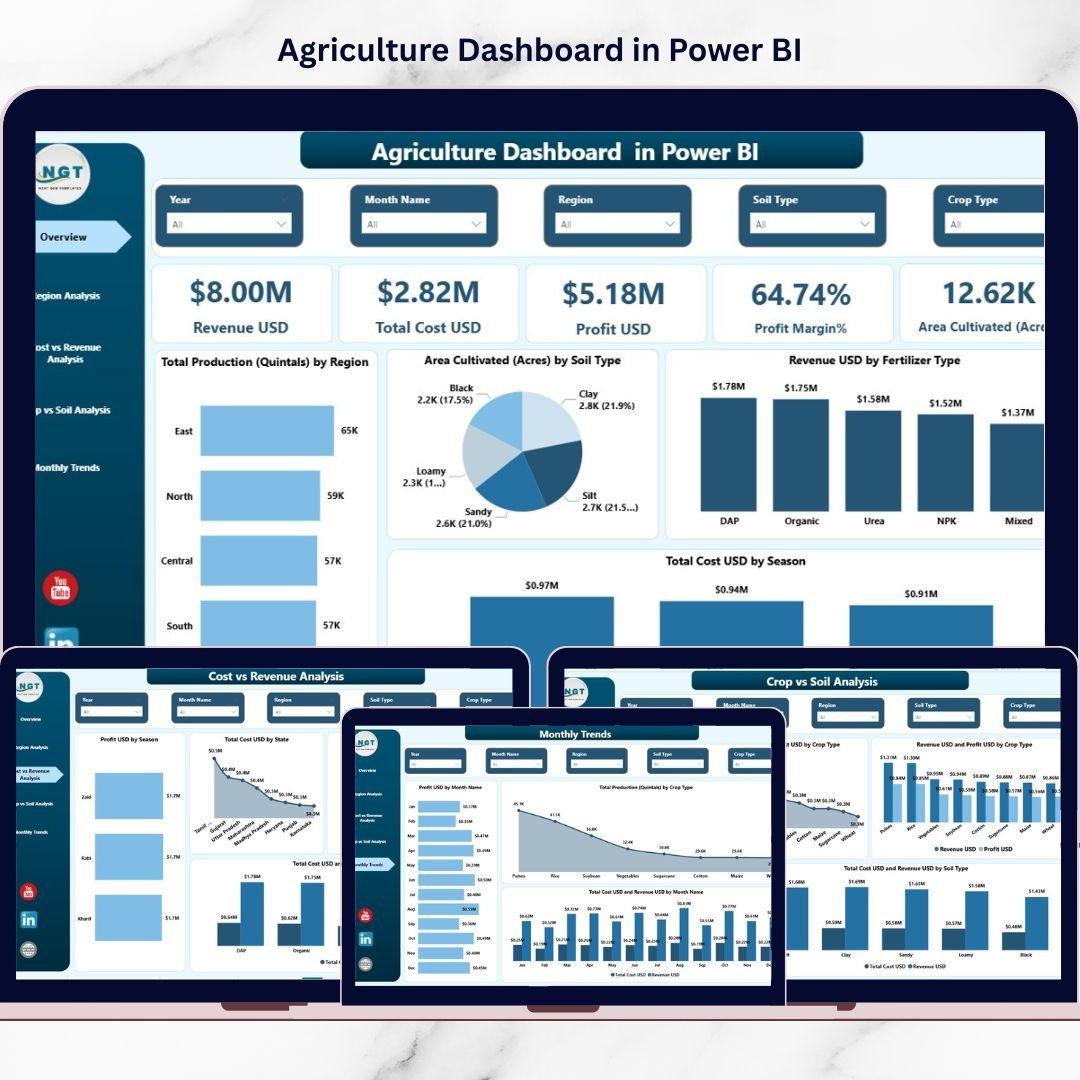
🌾 Key Feature of Agriculture Dashboard in Power BI
📊 5 Fully Interactive Pages – Overview, Region Analysis, Cost vs Revenue, Crop vs Soil, and Monthly Trends.
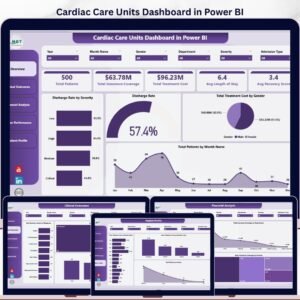
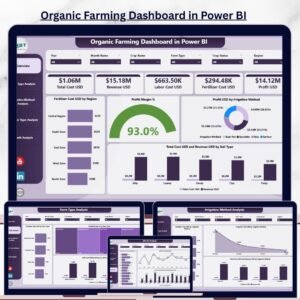
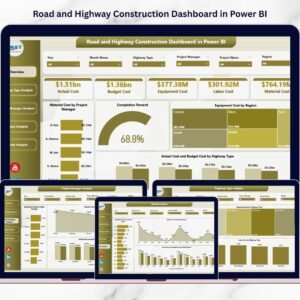
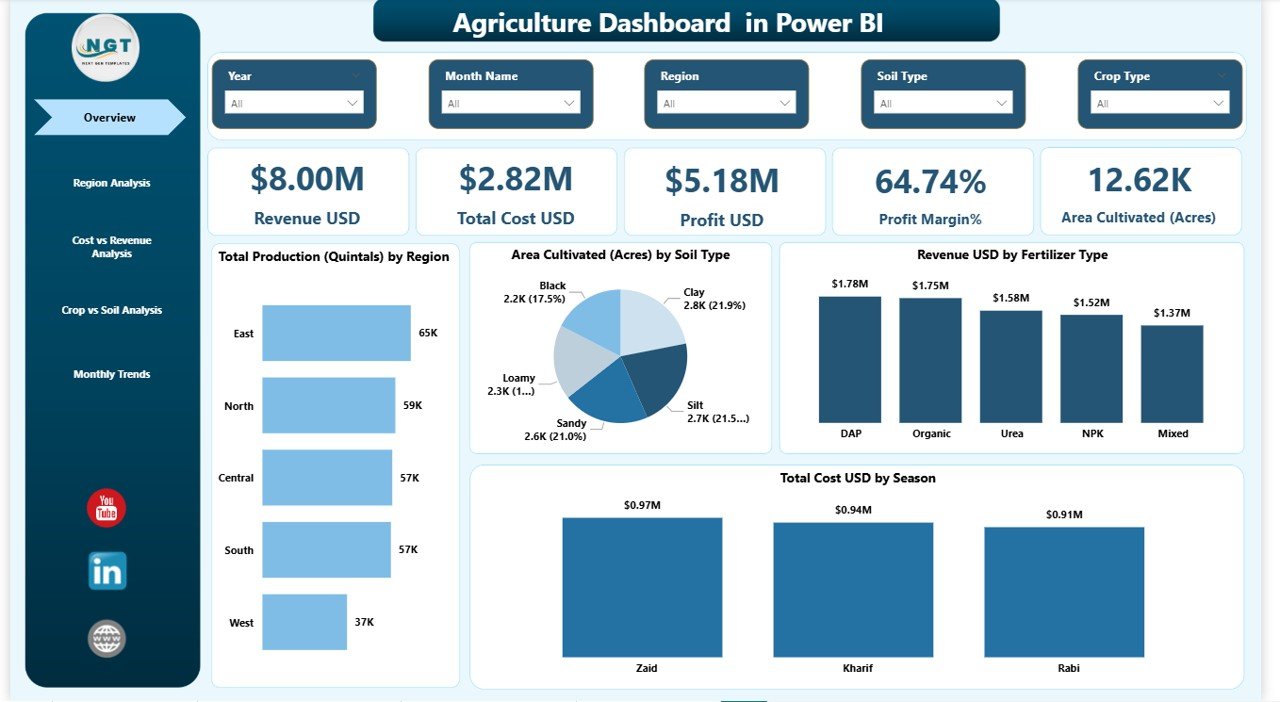
🎯 Dynamic KPI Cards – Instantly monitor Revenue, Total Cost, Profit, Profit Margin %, Area Cultivated, and Production.
🌍 Smart Slicers (Filters) – Analyze data by Region, Crop Type, Soil Type, Fertilizer Type, Season, and Month.
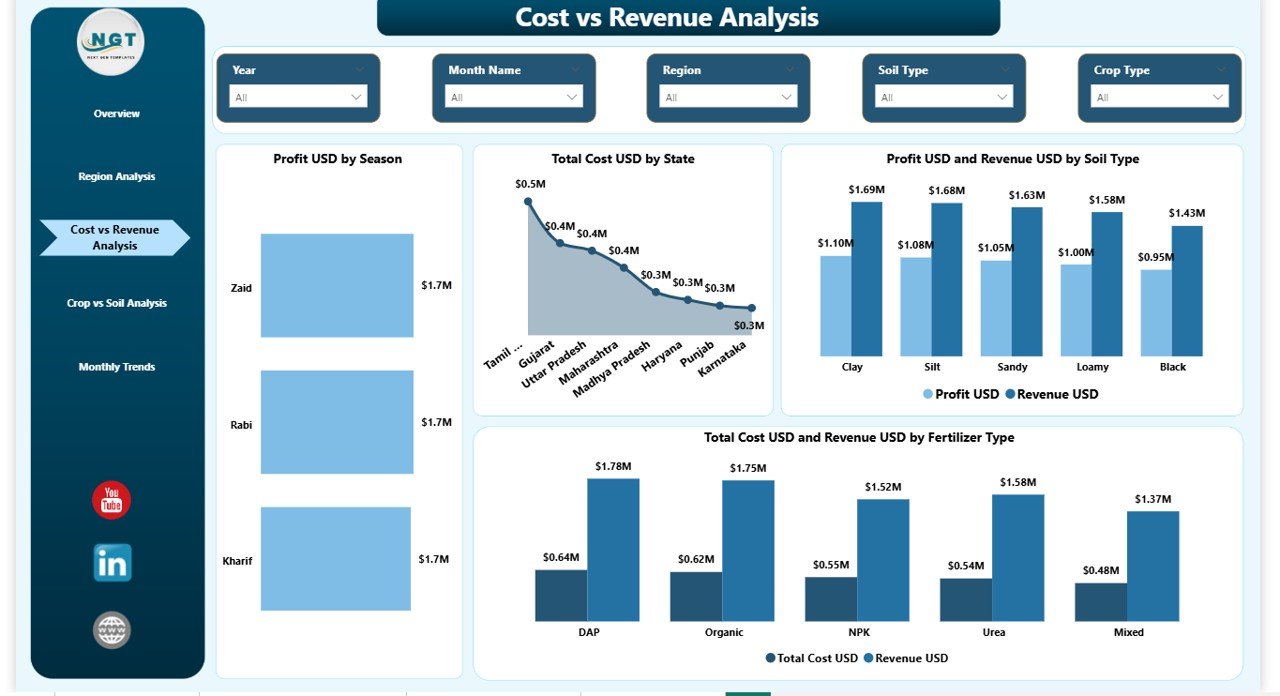
📈 Profitability Insights – Compare Revenue vs Cost visually to identify margin improvement areas.
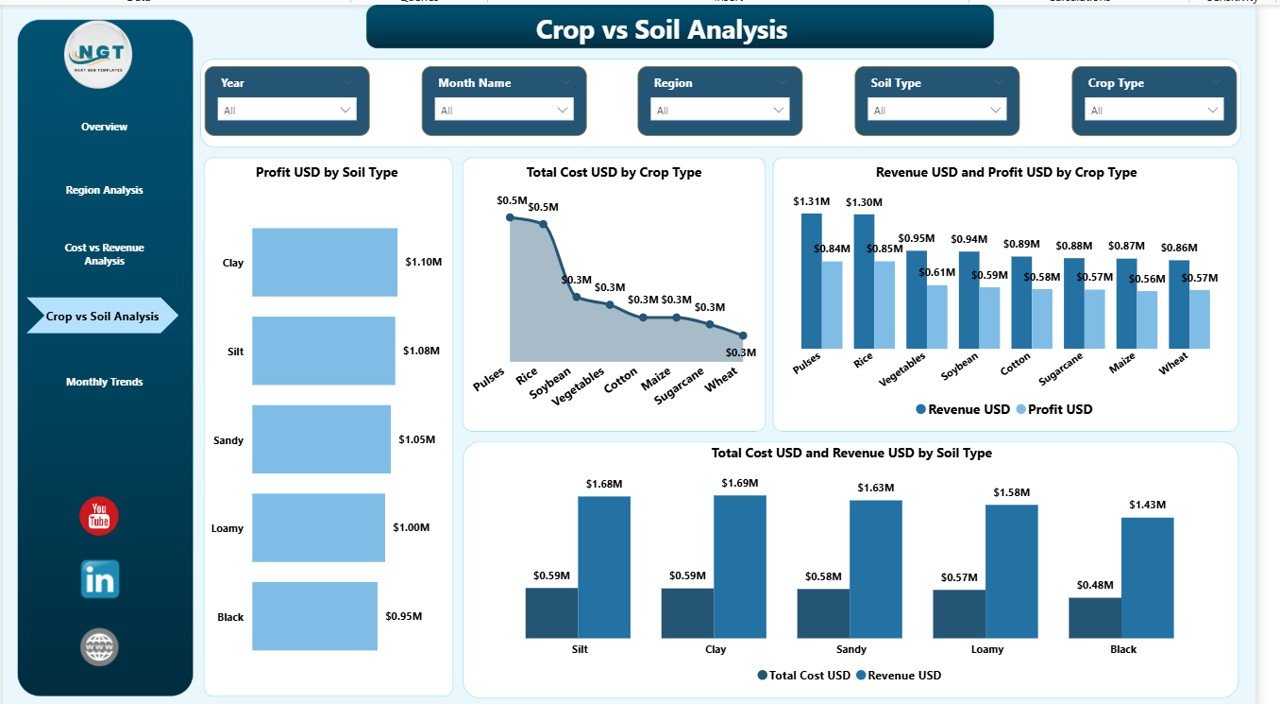
🌱 Crop & Soil Optimization Analysis – Discover which crop-soil combination generates the highest returns.
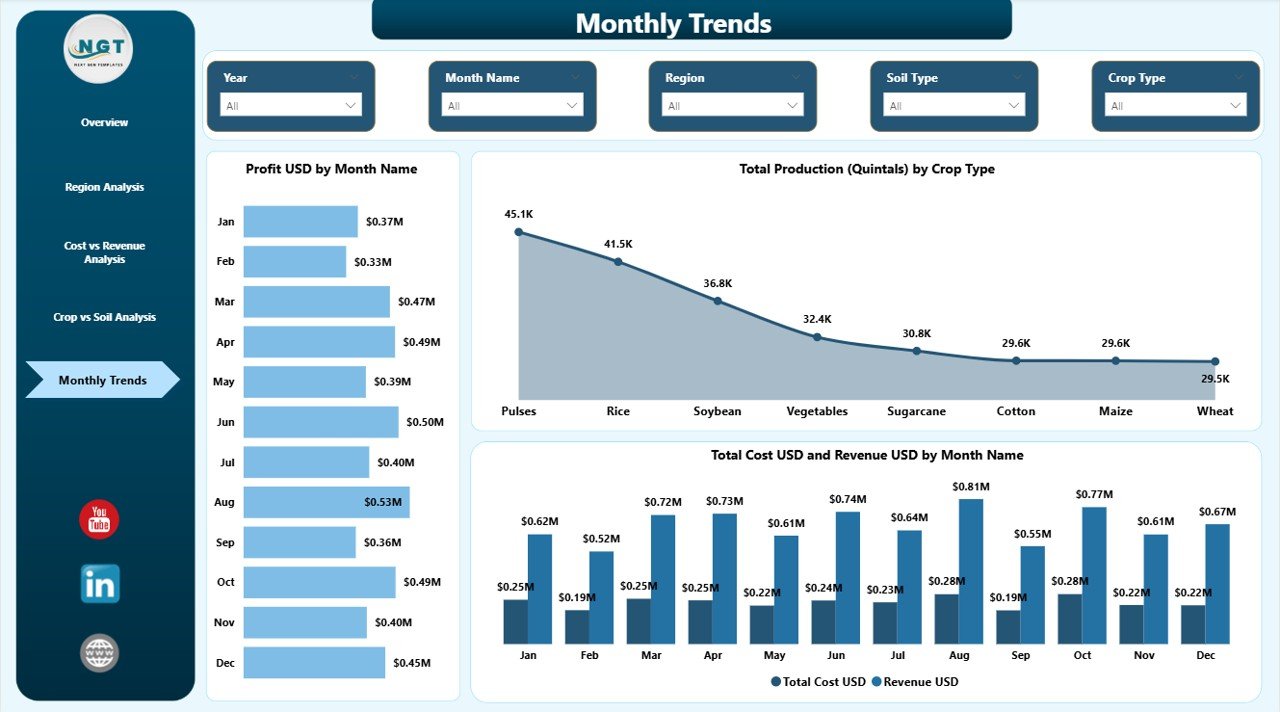
📅 Monthly Trend Monitoring – Track seasonal fluctuations and forecast future performance.
🔄 Real-Time Refresh – Update Excel data and refresh the dashboard instantly.
📦 What’s Inside the Agriculture Dashboard in Power BI
This ready-to-use Power BI file includes:
✔️ 5 Structured Dashboard Pages
✔️ Pre-designed KPI cards and visual charts
✔️ Revenue, Cost, Profit & Margin tracking visuals
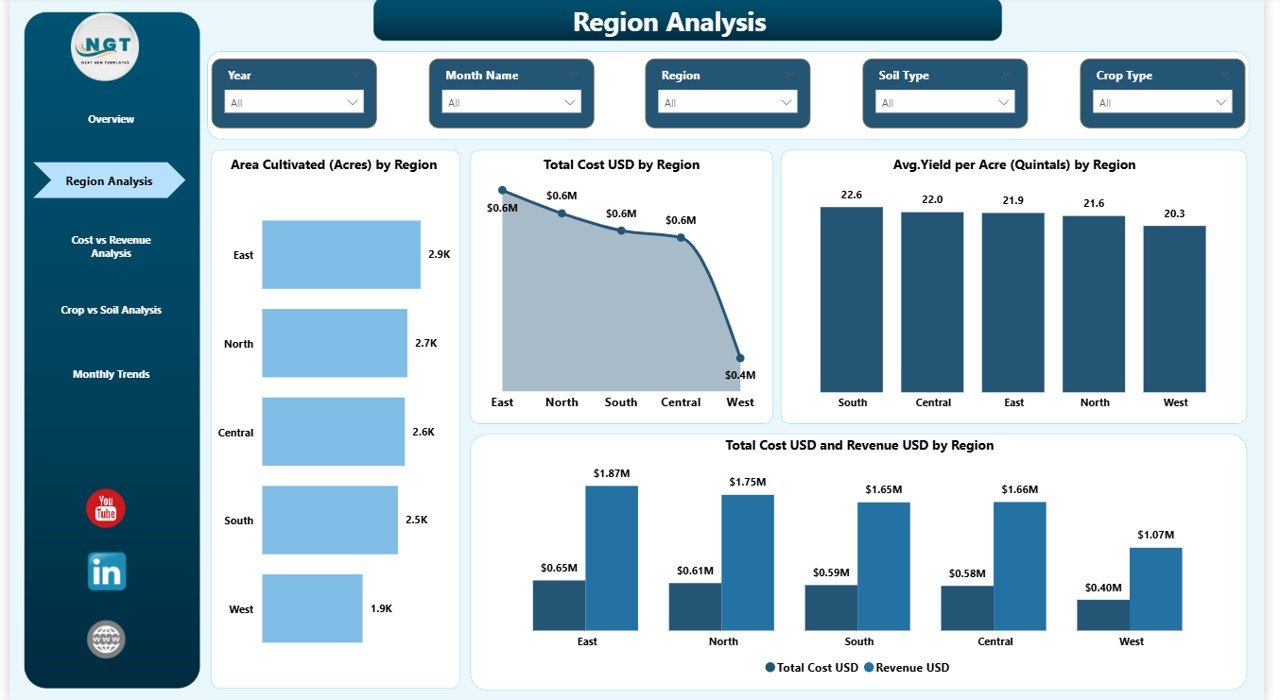
✔️ Region-based performance comparison charts
✔️ Soil and Crop combination analytics
✔️ Monthly trend and seasonal analysis visuals
✔️ Interactive slicers for deep filtering
✔️ Clean and structured data model
Everything is professionally designed to give you clarity within seconds.
🚀 How to Use the Agriculture Dashboard in Power BI
Using this dashboard is simple and efficient:
1️⃣ Enter your agriculture data in the provided Excel file.
2️⃣ Open the Power BI file.
3️⃣ Click “Refresh” to update visuals.
4️⃣ Use slicers to filter by region, crop, soil, or season.
5️⃣ Analyze KPI cards and charts for insights.
Within minutes, you will see:
-
Which region is most profitable
-
Which fertilizer increases ROI
-
Which crop-soil combination improves yield
-
Which season increases cost
-
How profit margin changes month by month
No advanced technical knowledge required.
👨🌾 Who Can Benefit from This Agriculture Dashboard in Power BI
This dashboard is ideal for:
🌾 Large-scale farm owners
🏢 Agribusiness companies
📊 Agriculture consultants
🤝 Farming cooperatives
🏛️ Government agriculture departments
📈 Agriculture project managers
Whether you manage small farms or multi-region agribusiness operations, this dashboard helps you take control of your numbers.
🎯 Why This Dashboard Is a Smart Investment
Instead of relying on static Excel sheets, this dashboard gives you:
✔ Complete financial visibility
✔ Better cost control
✔ Improved profit margin analysis
✔ Data-backed crop planning
✔ Regional expansion insights
✔ Seasonal performance forecasting
When you combine region insights, soil analytics, and monthly trends, you create a powerful decision-making engine.
This is not just a dashboard.
It is your agriculture command center.
Click hare to read the Detailed blog post
Watch the step-by-step video tutorial: