Industrial Automation Equipment KPI Dashboard modern manufacturing. Robots run continuously. PLC systems monitor precision. CNC machines operate with high accuracy. However, without structured tracking, machine efficiency drops, downtime increases, and maintenance costs spiral out of control.
If you still rely on scattered reports, you are reacting instead of preventing issues.
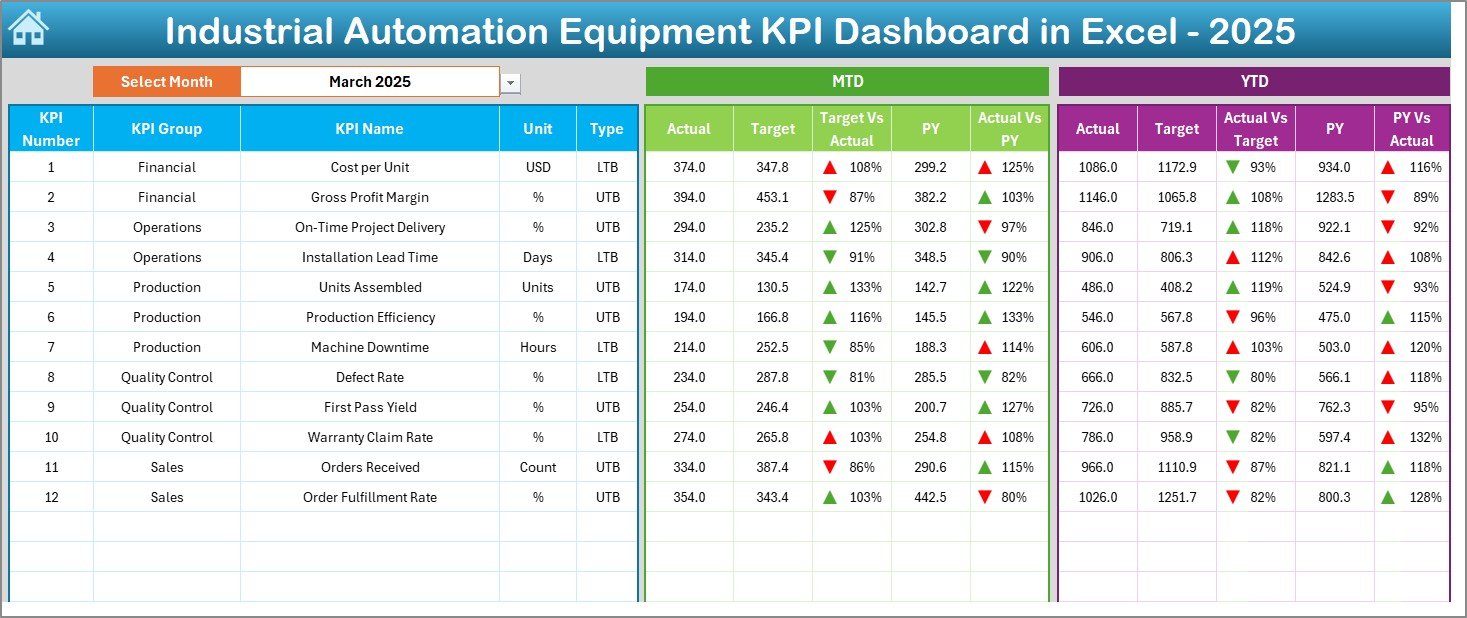
Now imagine tracking MTD & YTD Performance, Actual vs Target, Previous Year Comparison, OEE, Downtime, Maintenance Cost, and Production Output — all inside one structured Excel dashboard.
That is exactly what the Industrial Automation Equipment KPI Dashboard in Excel delivers.
This ready-to-use dashboard transforms operational data into clear visuals, KPI comparisons, and trend analysis. As a result, managers detect performance gaps early and improve production control.
Stop managing machines blindly. Start managing them with data.
🚀 Key Features of Industrial Automation Equipment KPI Dashboard in Excel
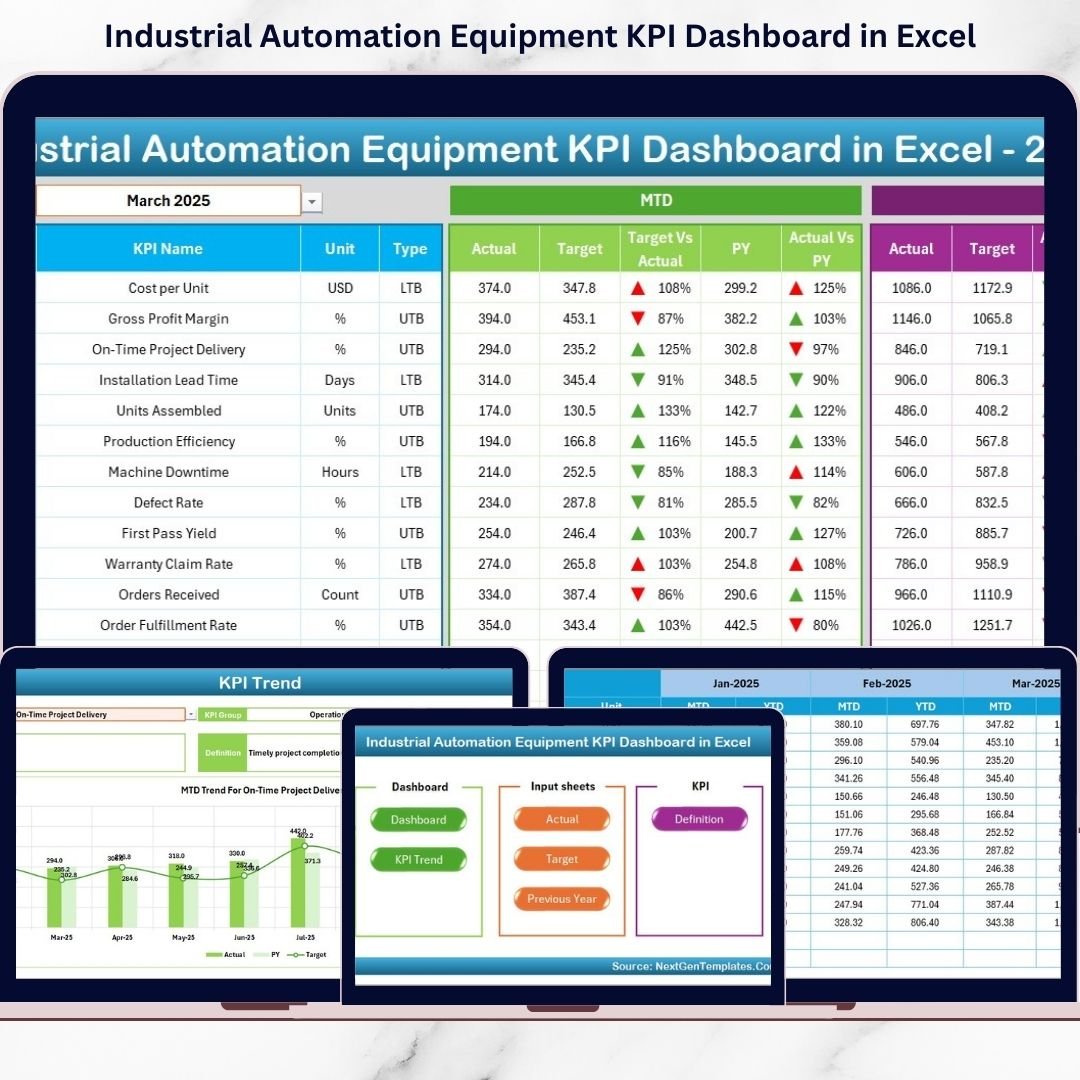
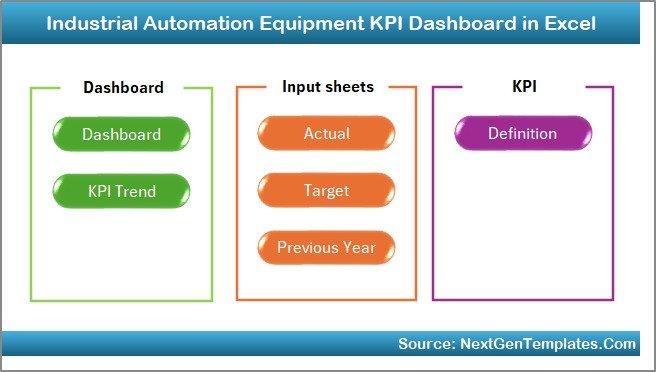
📊 7 Structured Worksheets
📅 MTD & YTD Performance Tracking
🎯 Target vs Actual Comparison
📈 Previous Year Growth Analysis
🔼 Conditional Performance Indicators
🧭 Navigation Buttons for Easy Access
📉 KPI Trend Charts
🛠 Fully Customizable KPI Structure
📂 Structured Data Entry Sheets
Built entirely in Excel, this dashboard provides powerful insights without requiring advanced software.
📦 What’s Inside the Industrial Automation Equipment KPI Dashboard in Excel
This dashboard contains 7 well-organized worksheets designed for complete KPI monitoring.
1️⃣ Home Sheet – Navigation Hub
Quick access buttons allow you to jump directly to:
-
Dashboard
-
KPI Trend
-
Actual Input
-
Target Sheet
-
Previous Year Sheet
-
KPI Definition
Save time and improve meeting efficiency.
2️⃣ Dashboard Sheet – Central Performance View
The heart of the system.
Select month in Cell D3 and instantly view:
-
MTD Actual
-
MTD Target
-
MTD Previous Year
-
YTD Actual
-
YTD Target
-
YTD Previous Year
Automatic comparisons and visual arrows show performance direction clearly.
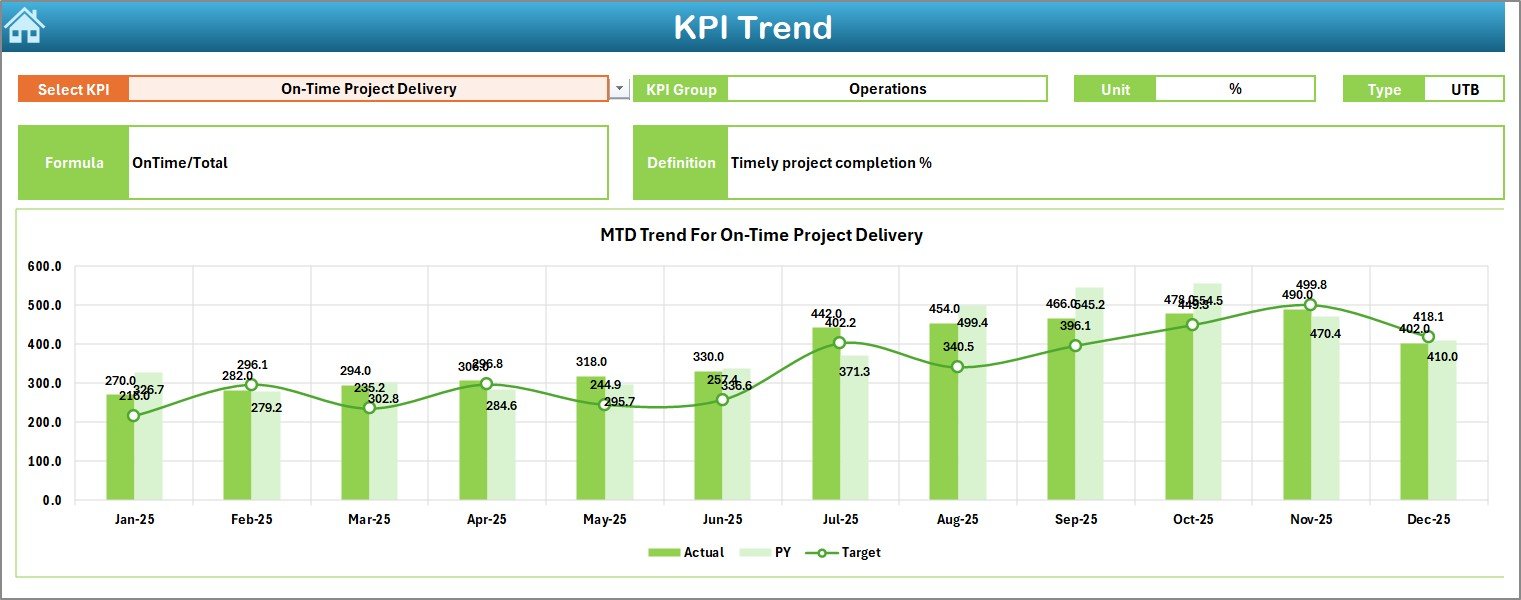
3️⃣ KPI Trend Sheet – Deep Performance Analysis
Select any KPI in Cell C3 and analyze:
-
KPI Group
-
Unit
-
KPI Type (UTB / LTB)
-
Formula
-
Definition
-
MTD Trend Chart
-
YTD Trend Chart
Detect patterns across months instead of focusing on a single period.
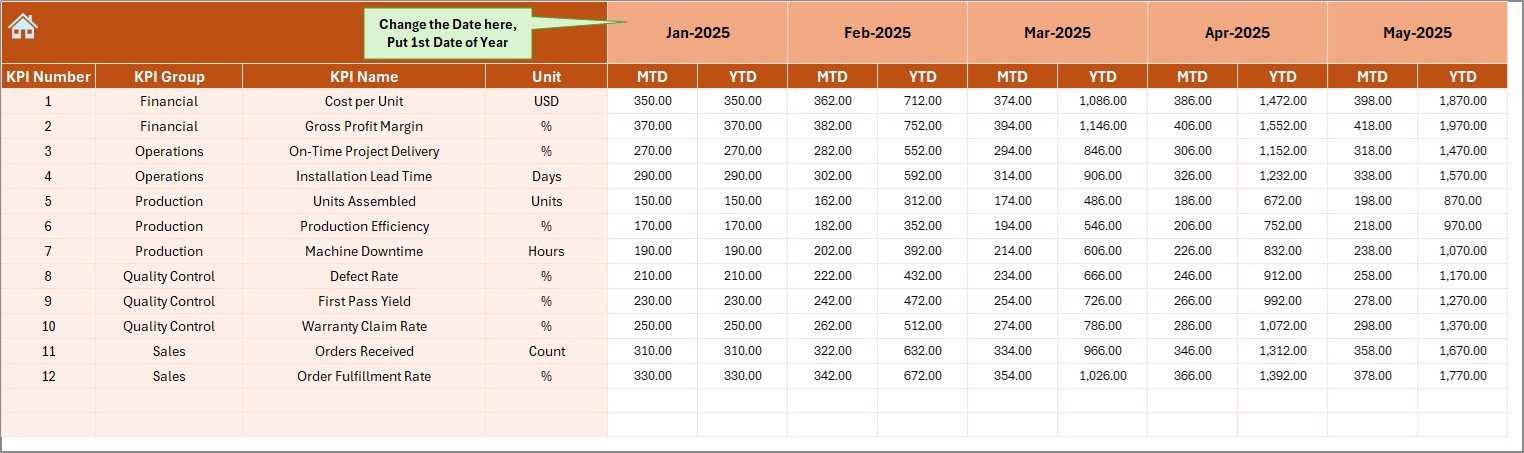
4️⃣ Actual Numbers Input Sheet
Enter MTD and YTD actual values.
Define the first financial month in Cell E1.
The dashboard updates automatically after data entry.
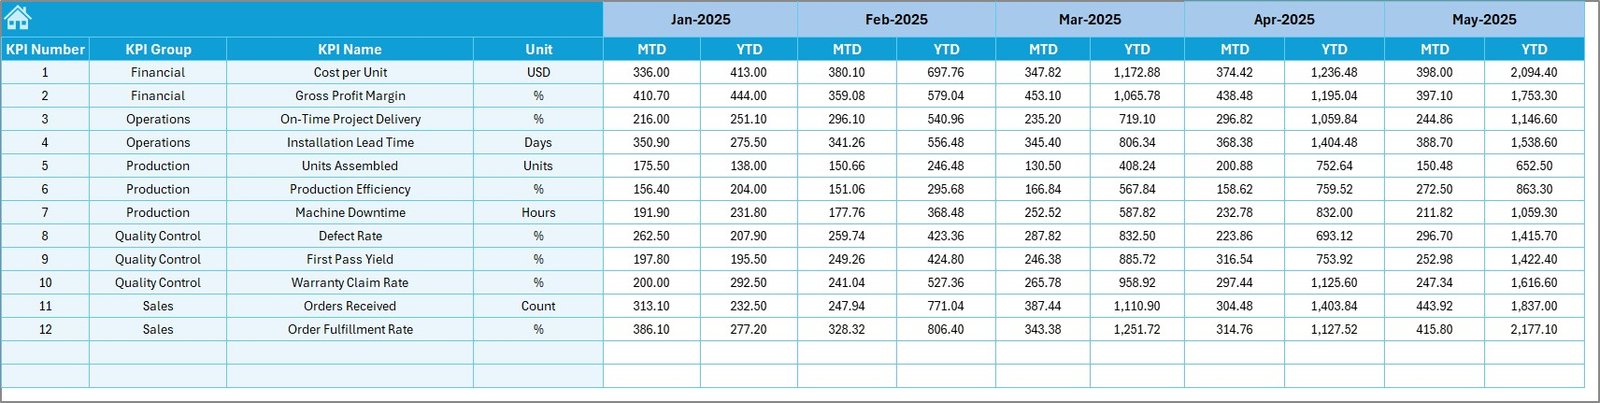
5️⃣ Target Sheet
Set:
-
Monthly MTD Targets
-
YTD Cumulative Targets
Clear goals improve accountability and production focus.
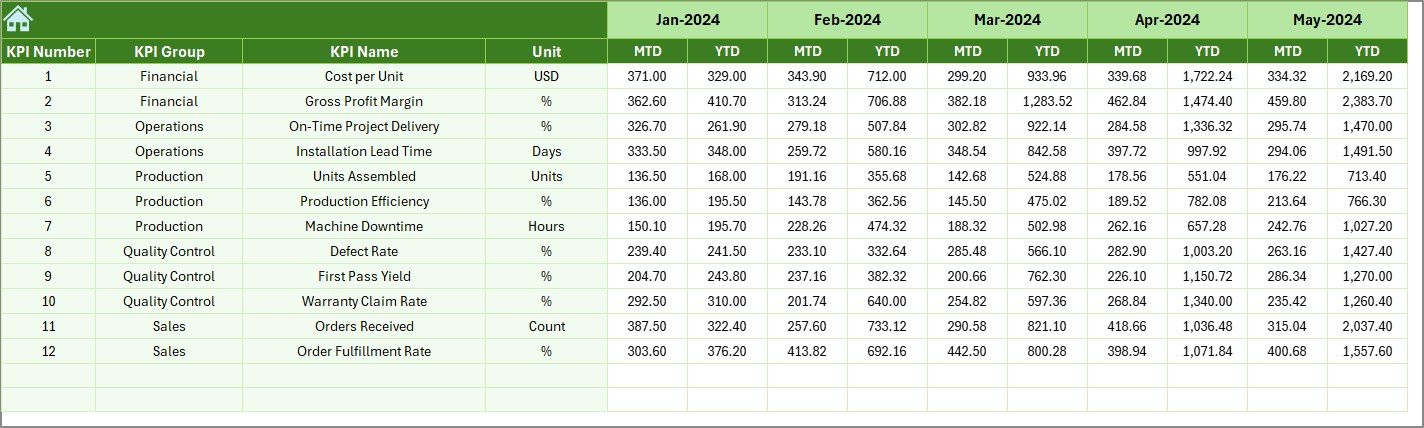
6️⃣ Previous Year Sheet
Enter historical data to enable:
-
Year-over-Year Growth
-
Improvement Analysis
-
Long-Term Trend Monitoring
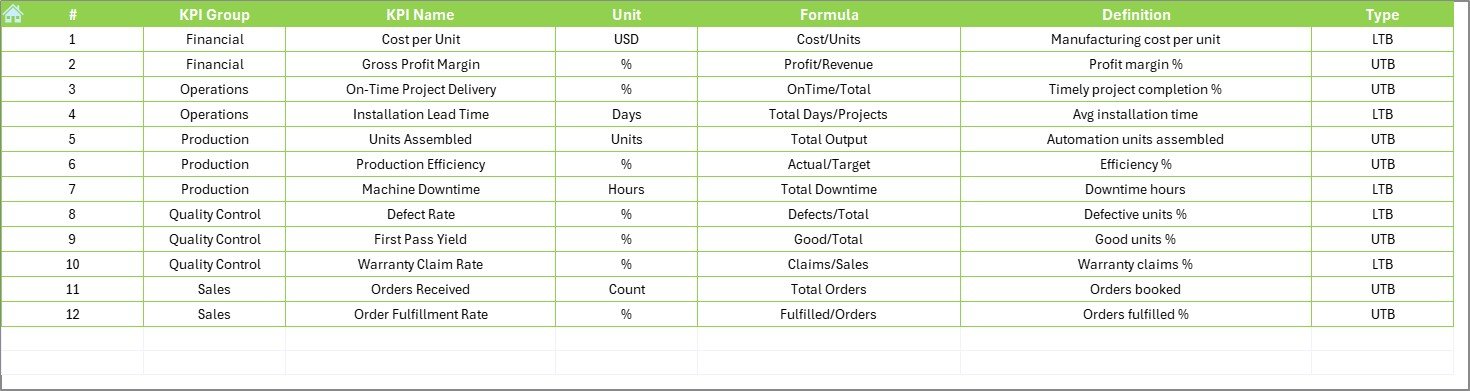
7️⃣ KPI Definition Sheet
Maintain structured KPI information:
-
KPI Name
-
KPI Group
-
Unit
-
Formula
-
Definition
-
KPI Type (Lower/Upper the Better)
This ensures consistent measurement across departments.
🛠 How to Use the Industrial Automation Equipment KPI Dashboard in Excel
1️⃣ Define KPIs in KPI Definition Sheet
2️⃣ Enter previous year data
3️⃣ Set monthly targets
4️⃣ Enter actual performance data
5️⃣ Select month from dropdown
6️⃣ Review dashboard & trend charts
No advanced Excel skills required.
👥 Who Can Benefit from This Industrial Automation Equipment KPI Dashboard
🏭 Manufacturing Plants
🤖 Robotics Production Units
⚙️ CNC & PLC Operations Teams
🛠 Maintenance Departments
📊 Operations Managers
💰 Finance Teams
📈 Plant Heads
If you manage automation systems, production efficiency, or maintenance operations, this dashboard supports structured performance tracking.
📌 Important KPIs Included
Production KPIs
-
Overall Equipment Effectiveness (OEE)
-
Machine Utilization Rate
-
Cycle Time
-
Production Output
-
Downtime
Maintenance KPIs
-
MTBF
-
MTTR
-
Preventive Maintenance Compliance
-
Maintenance Cost per Machine
Quality KPIs
-
Defect Rate
-
First Pass Yield
-
Rework Percentage
Financial KPIs
-
Cost per Unit
-
Energy Cost per Machine
-
Spare Parts Cost
Tracking these KPIs improves reliability, efficiency, and profitability.
Visit our YouTube channel to learn step-by-step video tutorials
🔗 Click here to read the Detailed blog post