


The Comic Books and Publishing Dashboard is no longer driven by creativity alone. While storytelling and artwork remain at the core, publishers today must carefully manage production schedules, costs, sales channels, formats, and profitability. However, when this information lives in scattered Excel sheets, teams often face confusion instead of clarity. As a result, delays increase, margins shrink, and decision-making slows down.
That is exactly where the Comic Books and Publishing Dashboard in Excel becomes a powerful advantage 📚📊.
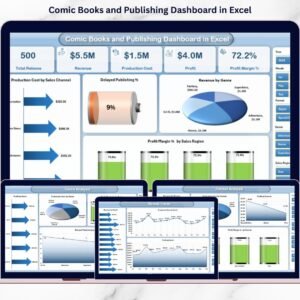
This ready-to-use Excel dashboard is designed specifically for comic publishers and publishing houses that want clear visibility into production, revenue, costs, and profit—without using complex software. It transforms raw publishing data into visual insights that help teams identify delays early, optimize sales strategies, and improve overall profitability.
🔑 Key Features of Comic Books and Publishing Dashboard in Excel
📊 Centralized Publishing Performance Tracking
Track production, sales, revenue, cost, and profit in one structured Excel dashboard instead of multiple spreadsheets.
⏱️ Publishing Delay Monitoring
Identify delayed publishing percentages early and take corrective action before timelines slip further.
💰 Revenue & Profit Analysis
Analyze revenue, profit, and profit margins by sales channel, genre, format, region, and month.
🎯 Multi-Dimensional Insights
Use interactive slicers to drill down performance by genre, format, sales channel, or time period.
🧭 Easy Page Navigation
Built-in Page Navigator allows smooth movement between dashboard pages with a single click.
🧩 Fully Excel-Based & Customizable
No coding, no macros, and no external tools—simple, flexible, and business-friendly.
📦 What’s Inside the Comic Books and Publishing Dashboard in Excel
This dashboard includes five powerful analytical pages, supported by backend sheets for smooth performance.
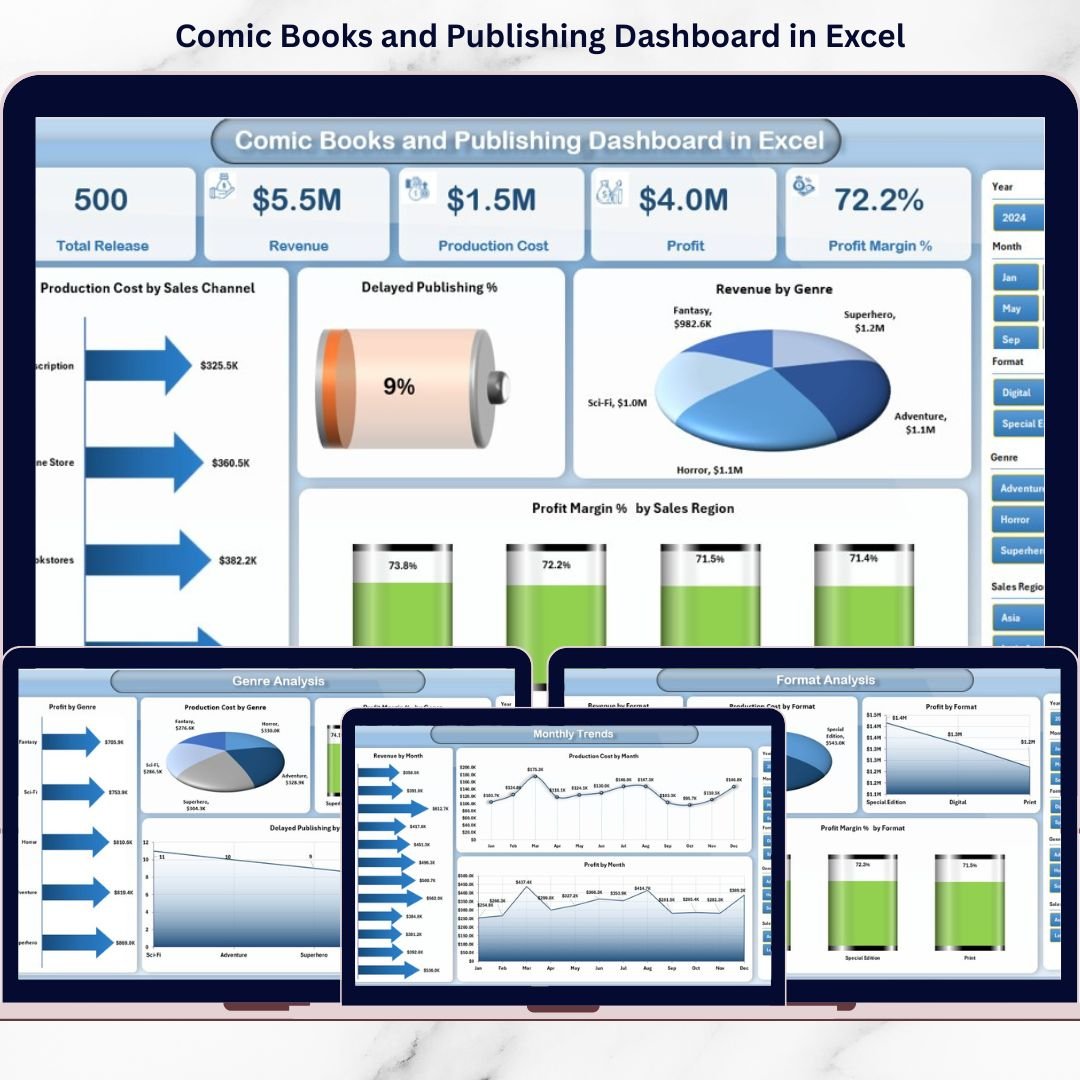
📌 Overview Page

The main landing page that provides a high-level snapshot of publishing performance.
-
KPI cards for quick metrics
-
Charts showing production by sales channel
-
Delayed publishing percentage
-
Revenue by genre
-
Profit margin % by sales region
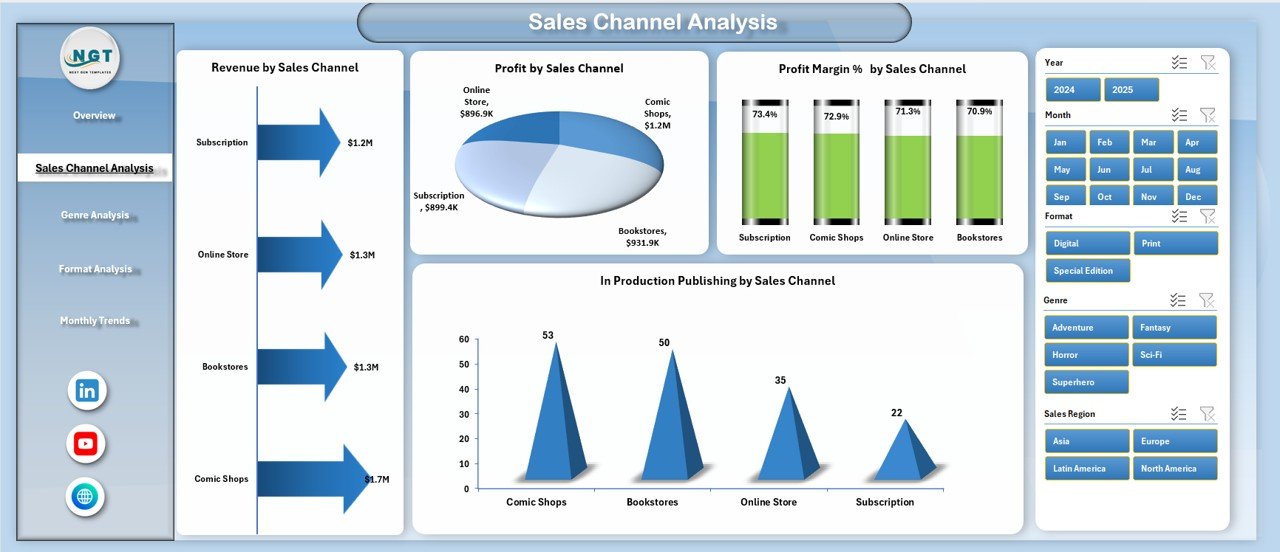
📢 Sales Channel Analysis Page
Helps publishers compare performance across online platforms, retail stores, distributors, and subscriptions.
-
Revenue by sales channel
-
Profit by sales channel
-
Profit margin % by channel
-
In-production publishing by channel
🎭 Genre Analysis Page
Evaluates which comic genres perform best financially.
-
Profit by genre
-
Production cost by genre
-
Profit margin % by genre
-
Delayed publishing by genre
📦 Format Analysis Page
Compares performance across print, digital, and special formats.
-
Revenue by format
-
Profit by format
-
Production cost by format
-
Profit margin % by format
📅 Month Analysis Page
Tracks trends and seasonality over time.
-
Revenue by month
-
Profit by month
-
Production cost by month
📄 Data Sheet & Support Sheet
-
Data Sheet stores all raw publishing data
-
Support Sheet manages helper logic and calculations
🛠️ How to Use the Comic Books and Publishing Dashboard in Excel
Using the dashboard is simple and intuitive:
1️⃣ Update production, sales, cost, and revenue data in the Data Sheet
2️⃣ Refresh pivot tables if required
3️⃣ Use slicers to filter data by month, genre, format, or channel
4️⃣ Navigate between pages using the Page Navigator
5️⃣ Review KPIs and charts to identify issues and opportunities
6️⃣ Make faster, data-driven publishing decisions
Within minutes, raw publishing data turns into actionable insights.
👥 Who Can Benefit from This Comic Books and Publishing Dashboard in Excel
📚 Comic Publishers & Studio Owners
🧑💼 Production Managers
💰 Finance & Accounting Teams
📈 Sales & Distribution Managers
✍️ Editorial Leadership Teams
🏢 Independent & Mid-Sized Publishing Houses
If your team already uses Excel and wants better visibility and control, this dashboard is the perfect fit.