
Managing a Warehousing Dashboard today is no longer just about storing goods. Inventory flows in, orders flow out, and performance data flows across multiple systems every single day. However, when warehouse data remains scattered across spreadsheets, ERP exports, and manual reports, visibility drops quickly. As a result, teams react late to stock issues, space constraints, and shipment delays.
That is exactly where a Warehousing Dashboard in Power BI becomes a powerful and essential analytics solution.
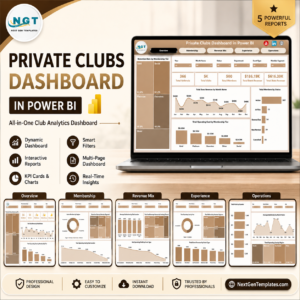
This ready-to-use Warehousing Dashboard in Power BI brings inventory, transactions, storage utilization, and shipment performance into one centralized, interactive, and visual reporting platform. Instead of spending hours preparing reports, warehouse managers and leadership teams can instantly monitor performance, identify bottlenecks, and take corrective action with confidence.
Because this dashboard is built using Microsoft Power BI, it supports dynamic filters, slicers, and real-time visuals. As a result, users interact with data instead of scrolling through static reports. Whether you manage a single warehouse or multiple locations, this dashboard delivers clarity, control, and speed.
📦 Key Features of Warehousing Dashboard in Power BI
🚀 Interactive Power BI dashboard with real-time visuals
📊 Centralized tracking of warehouse KPIs
🎛️ Dynamic slicers for instant filtering
📍 Multi-warehouse performance comparison
📦 Inventory, transaction & storage insights
⏱️ Shipment delay and utilization monitoring
📈 Trend analysis for better forecasting
🔄 Scalable and customizable design
🗂️ What’s Inside the Warehousing Dashboard in Power BI
This Power BI dashboard includes 5 professionally designed analytical pages, each focused on a critical warehouse performance area.
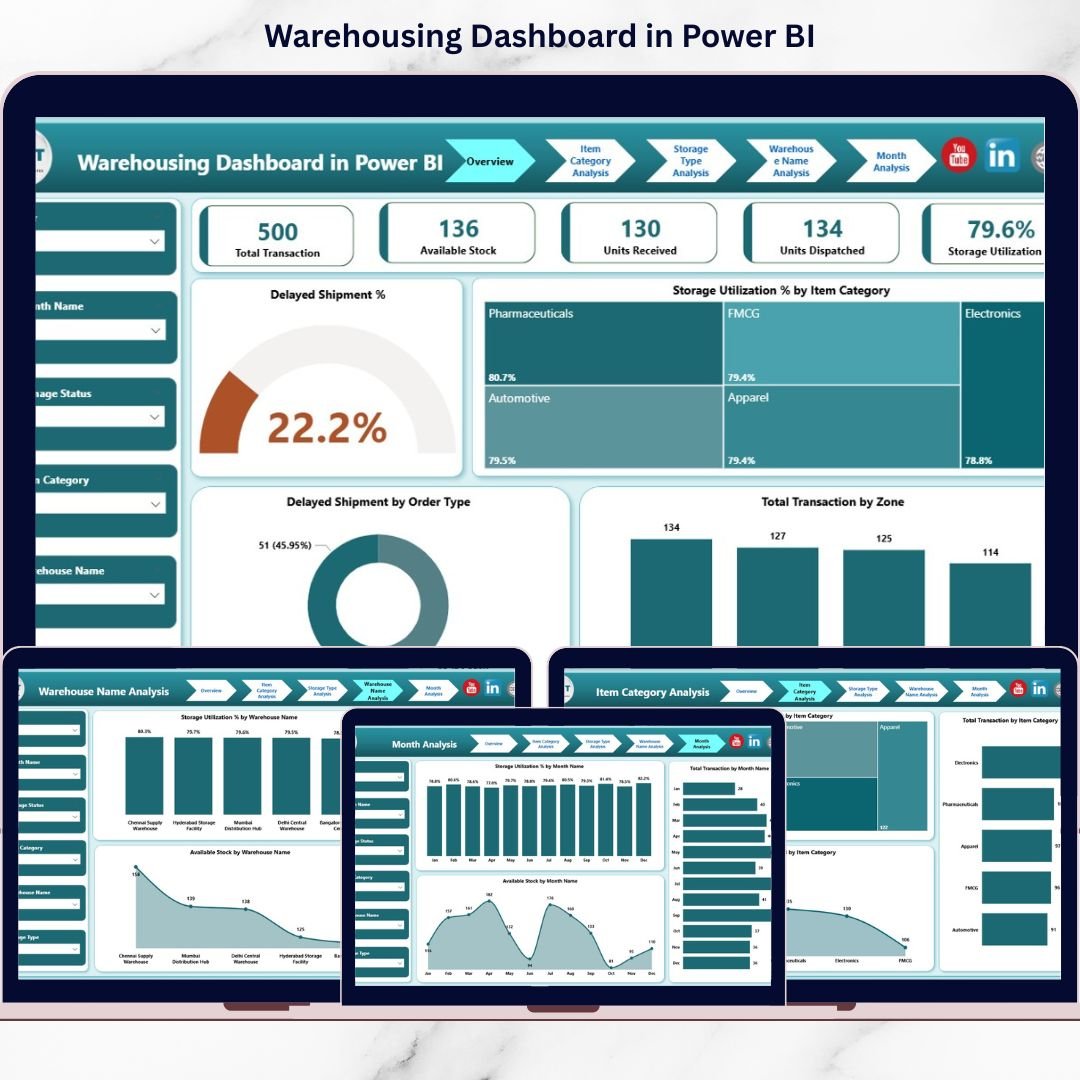
🏠 Overview Page – Warehouse Performance Snapshot
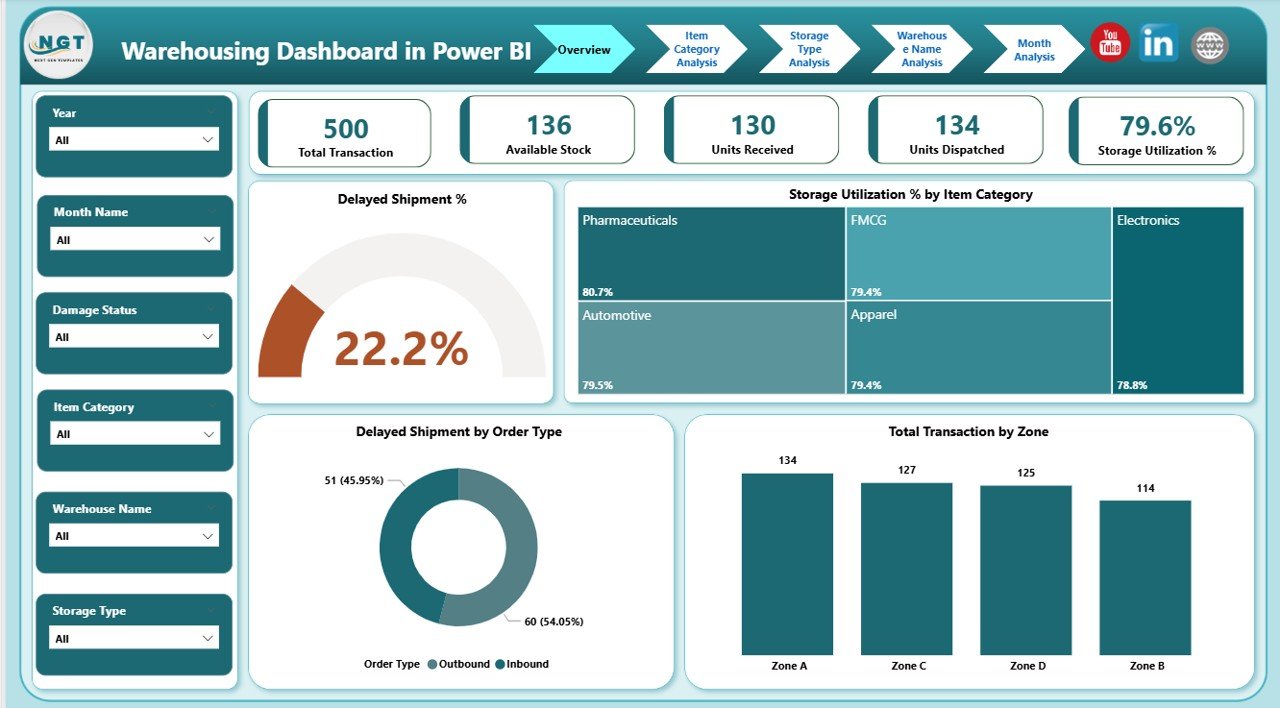
The Overview Page acts as the control panel for warehouse operations.
KPIs & Charts Included
-
⏳ Delayed Shipment %
-
📦 Storage Utilization % by Item Category
-
🚚 Delayed Shipment by Order Type
-
🔢 Total Transactions by Zone
This page helps decision-makers quickly understand overall warehouse health and operational risks.
📦 Item Category Analysis – Inventory Movement Insights
This page analyzes performance by item category, helping teams understand stock behavior.
Charts Included
-
📊 Available Stock by Item Category
-
🔁 Total Transactions by Item Category
-
📦 Units Dispersion by Item Category
With this analysis, teams identify fast-moving, slow-moving, and overstocked categories easily.
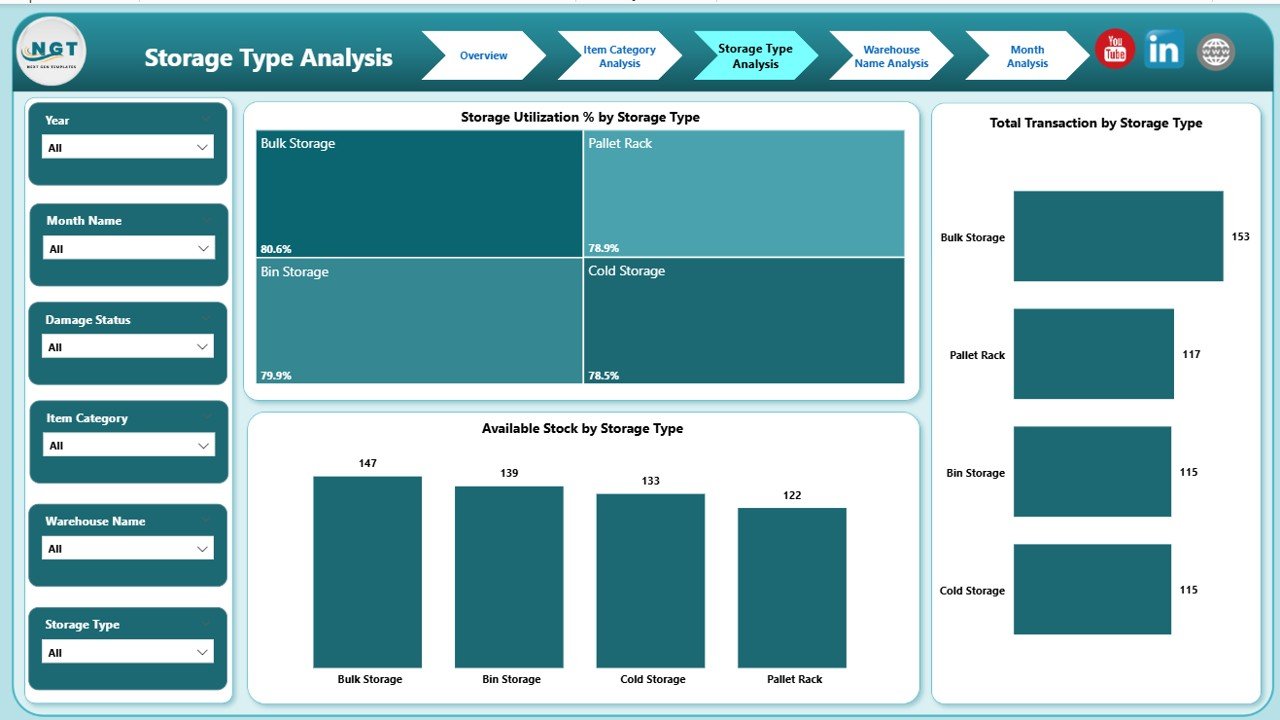
🧱 Storage Type Analysis – Space Utilization Control
Different storage types behave differently. This page evaluates storage efficiency across methods.
Charts Included
-
📦 Available Stock by Storage Type
-
🔄 Total Transactions by Storage Type
-
📐 Storage Utilization % by Storage Type
This page supports better warehouse layout planning and space optimization.
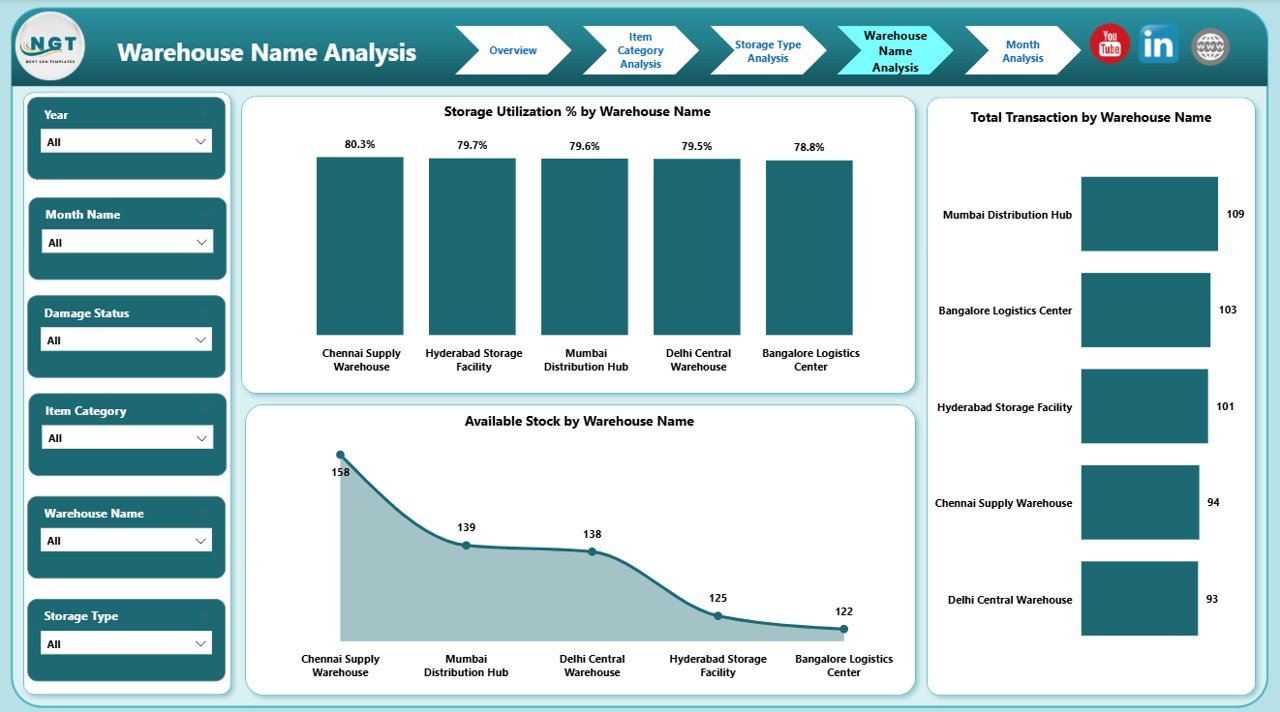
🏭 Warehouse Name Analysis – Location-Wise Performance
For organizations with multiple warehouses, this page enables location comparison.
Charts Included
-
📦 Available Stock by Warehouse Name
-
🔁 Total Transactions by Warehouse Name
-
📐 Storage Utilization % by Warehouse Name
Managers use this page to benchmark warehouses and allocate resources strategically.
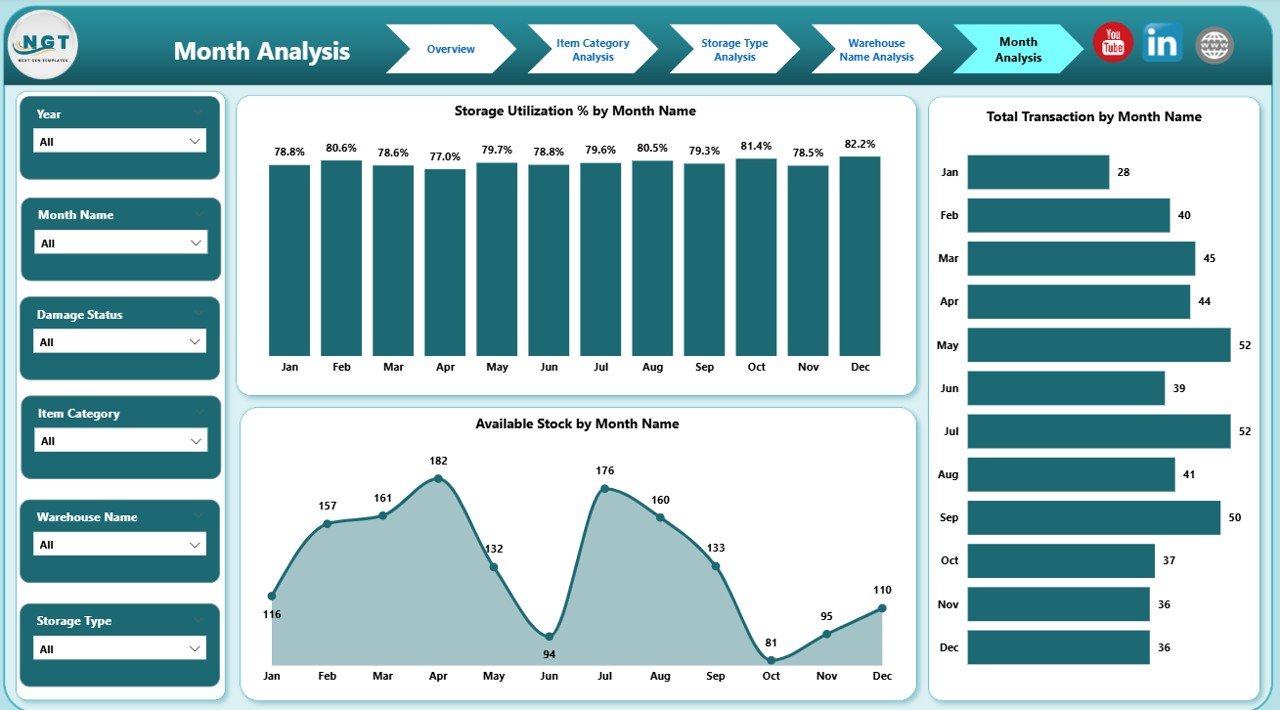
📅 Month Analysis – Trend & Seasonality View
This page tracks warehouse performance over time.
Charts Included
-
📦 Available Stock by Month
-
🔁 Total Transactions by Month
-
📐 Storage Utilization % by Month
It helps planners anticipate demand, prepare for seasonal spikes, and improve forecasting accuracy.
▶️ How to Use the Warehousing Dashboard in Power BI
Using the dashboard is simple and user-friendly:
1️⃣ Connect your warehouse data (Excel, ERP, WMS, database)
2️⃣ Refresh the Power BI dataset
3️⃣ Use slicers to filter by item category, storage type, warehouse, or month
4️⃣ Review KPIs, trends, and performance visuals
5️⃣ Take faster, data-driven operational decisions
No advanced Power BI or technical expertise is required for end users.
👥 Who Can Benefit from This Warehousing Dashboard?
✔ Warehouse Managers
✔ Inventory Planners
✔ Supply Chain & Operations Teams
✔ Logistics Managers
✔ Business Owners
✔ Senior Management & Analysts
Both small warehouses and large multi-location operations can scale this dashboard easily.
🚀 Business Advantages
Using this dashboard helps organizations:
-
Reduce shipment delays
-
Improve inventory accuracy
-
Optimize storage utilization
-
Eliminate manual reporting
-
Improve operational visibility
-
Support faster decision-making
### 📘 Click here to read the Detailed blog post
📺 Visit our YouTube channel to learn step-by-step video tutorials
👉 https://youtube.com/@PKAnExcelExpert