Budget forecasting is the backbone of strong financial planning. When budgets, forecasts, and actual spending are not tracked clearly, organizations face cost overruns, delayed decisions, and poor financial control. Unfortunately, many teams still depend on static spreadsheets that fail to show variances, trends, and risks in real time.
That is exactly why the Budget Forecasting Dashboard in Google Sheets becomes an essential financial management solution.
This ready-to-use dashboard converts raw budget data into a structured, visual, and decision-ready reporting system. It allows finance teams, department managers, and leadership to compare Budget vs Forecast vs Actual amounts while tracking variances across departments, categories, budget status, and time periods—all from one interactive Google Sheets dashboard.
Because it is built entirely in Google Sheets, the dashboard offers real-time updates, seamless collaboration, automatic calculations, and cloud-based access without the need for expensive BI tools.
✨ Key Features of the Budget Forecasting Dashboard in Google Sheets
📊 1. Budget vs Forecast vs Actual Comparison
Instantly compare planned budgets with forecasted and actual spending to identify gaps and control costs proactively.
🎯 2. Variance Tracking for Better Control
Variance amounts highlight overspending and underutilized budgets, helping teams act early.
📈 3. Department & Category-Level Visibility
Understand how each department and cost category contributes to overall budget performance.
🔍 4. Smart Search & Filtering
Quickly filter budget records by department, category, month, or budget status during reviews and audits.
☁️ 5. Google Sheets-Based & Collaborative
Multiple users can work together in real time with secure access controls.
📦 What’s Inside the Budget Forecasting Dashboard in Google Sheets
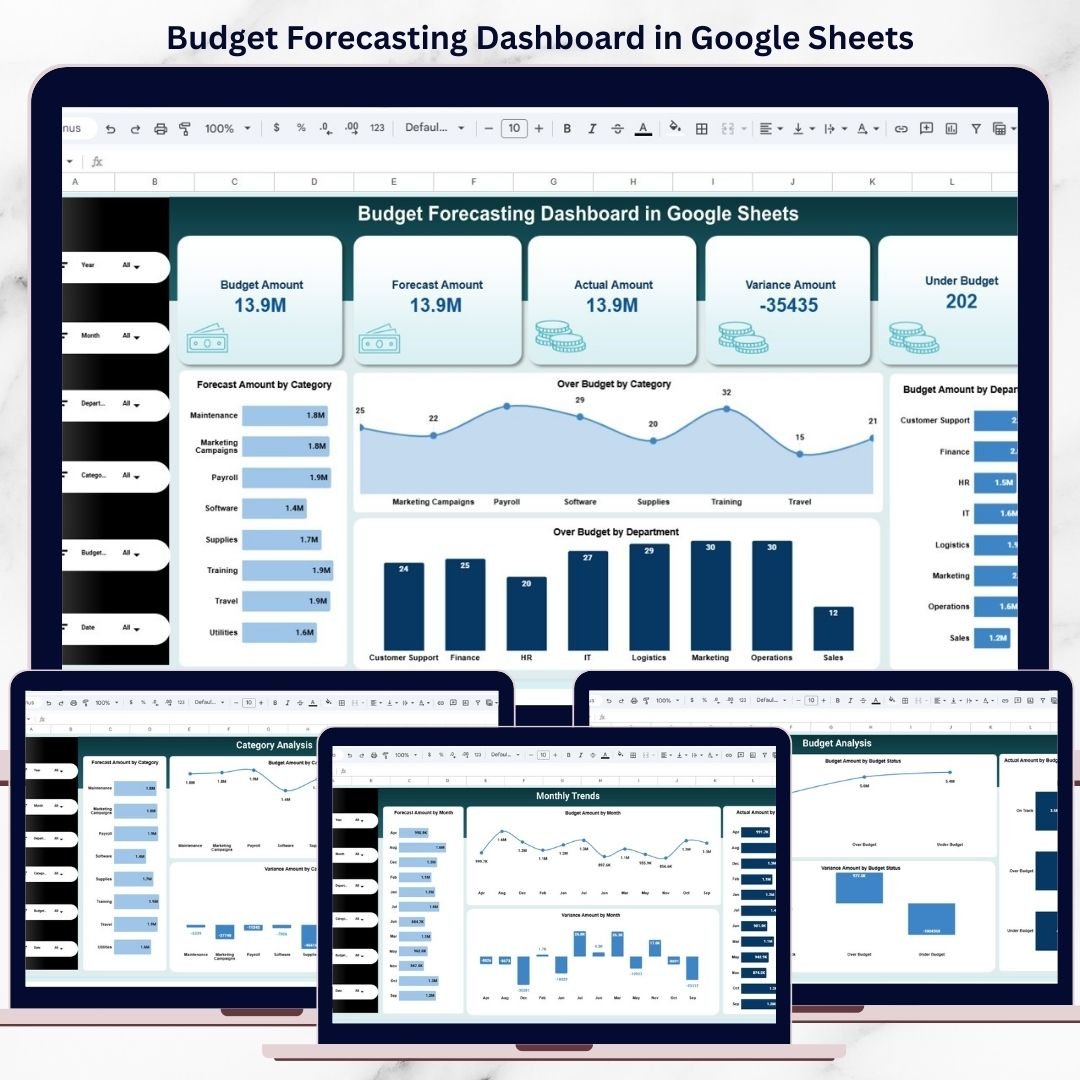
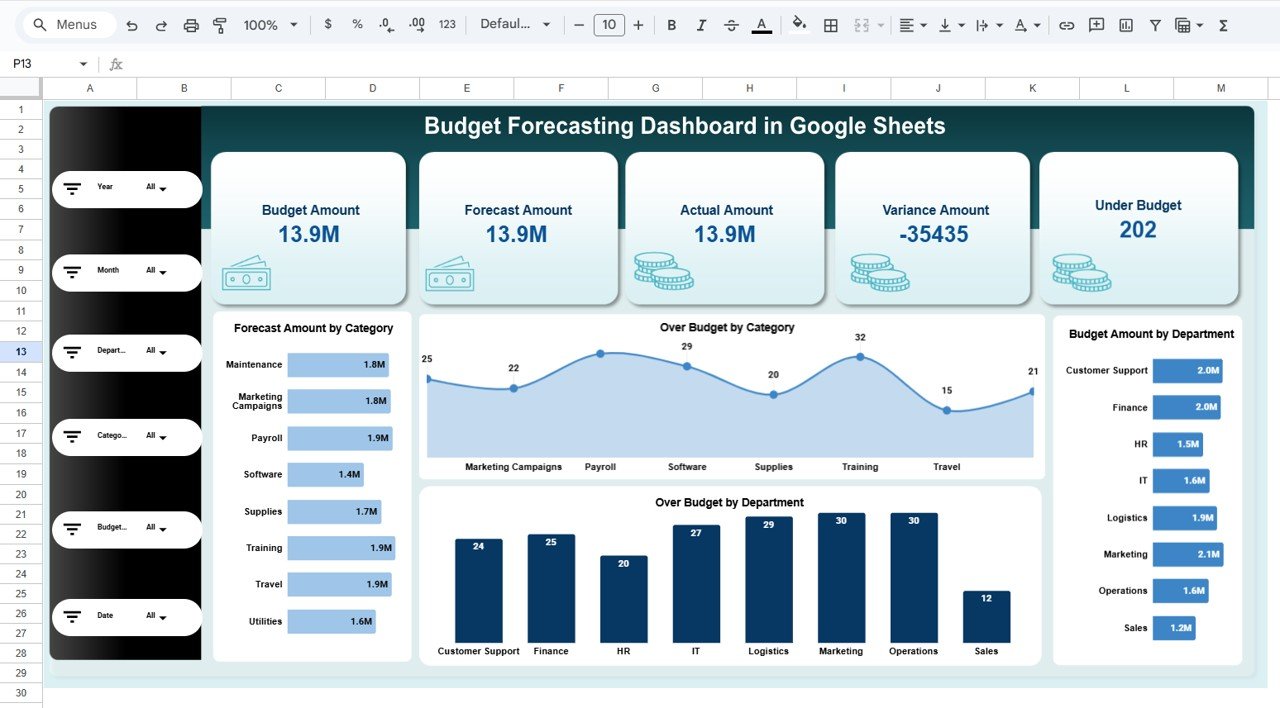
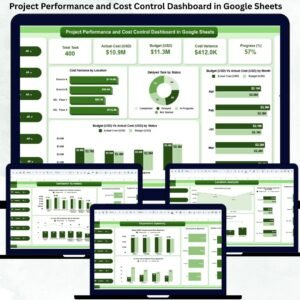
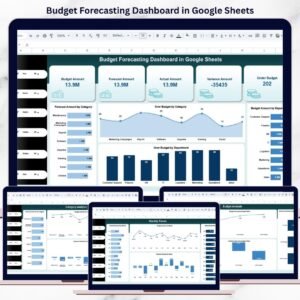
🖥️ Overview Sheet Tab – Budget Snapshot
This is the main dashboard view that summarizes budget performance using KPI cards and charts.
📌 KPI Cards on the Dashboard
-
Budget Amount – Total planned budget
-
Forecast Amount – Expected spend based on projections
-
Actual Amount – Real spending recorded
-
Variance Amount – Difference between budget and actual
-
Under Budget Indicator – Quick signal of budget control
These KPI cards help decision-makers understand financial health at a glance.
📊 Charts in the Overview Section
📉 Forecast Amount by Category
Shows projected spending across cost categories.
⚠️ Over Budget by Category
Highlights categories exceeding their allocated budget.
🏢 Budget Amount by Department
Displays planned budget distribution by department.
🚨 Over Budget by Department
Identifies departments with potential overspending risks.
All charts update automatically when data changes.
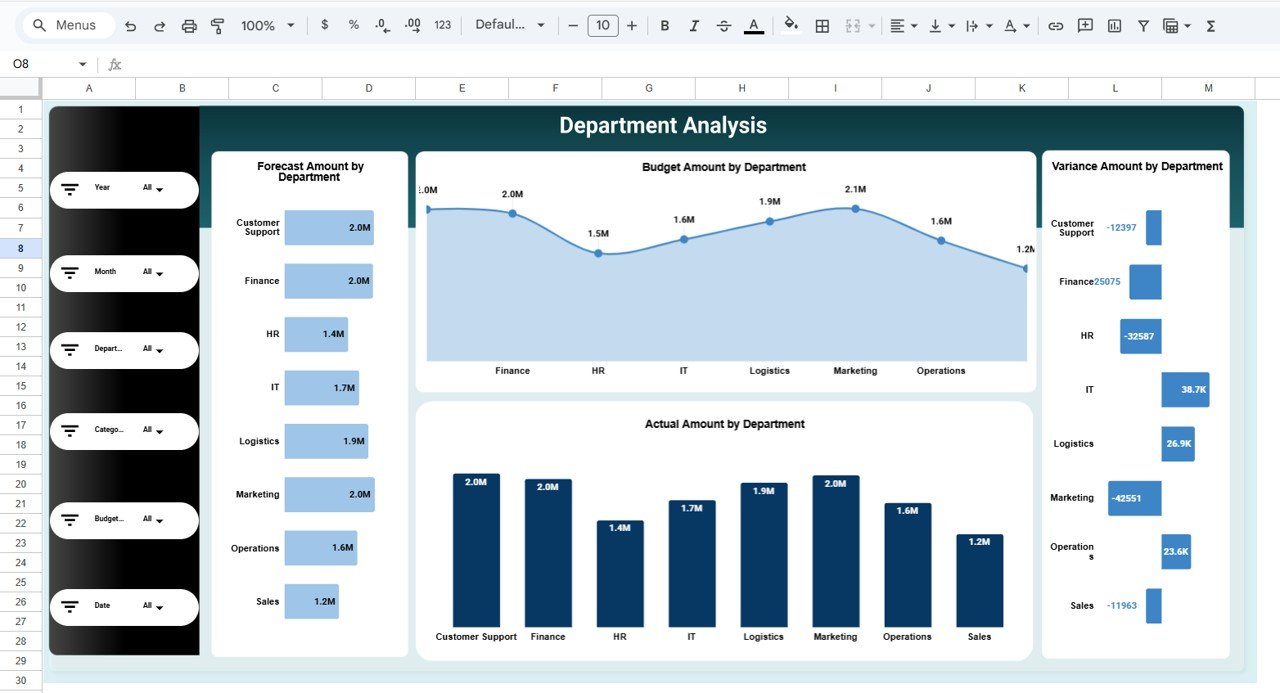
🏢 Department Analysis Section
This section focuses on department-wise budget performance:
-
Forecast Amount by Department
-
Budget Amount by Department
-
Actual Amount by Department
-
Variance Amount by Department
It helps leadership improve accountability and spending discipline.
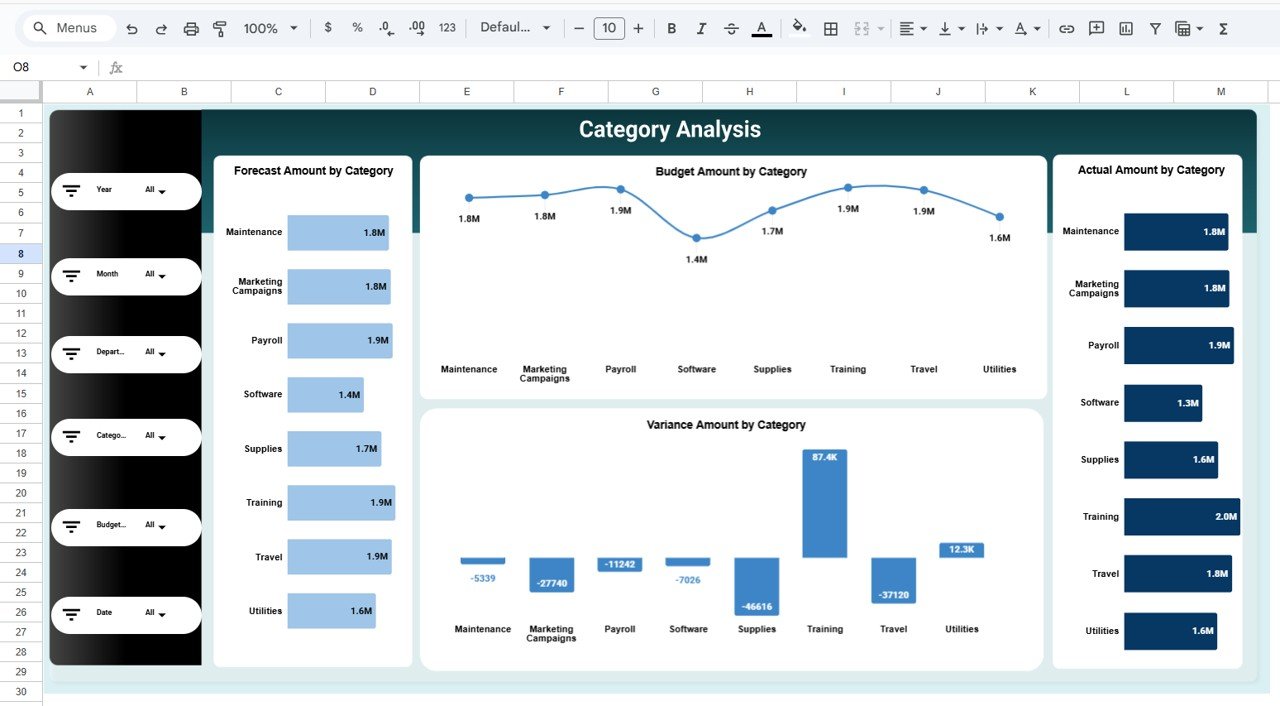
📂 Category Analysis Section
This section analyzes costs at a category level:
-
Forecast Amount by Category
-
Budget Amount by Category
-
Actual Amount by Category
-
Variance Amount by Category
It supports cost optimization and smarter category planning.
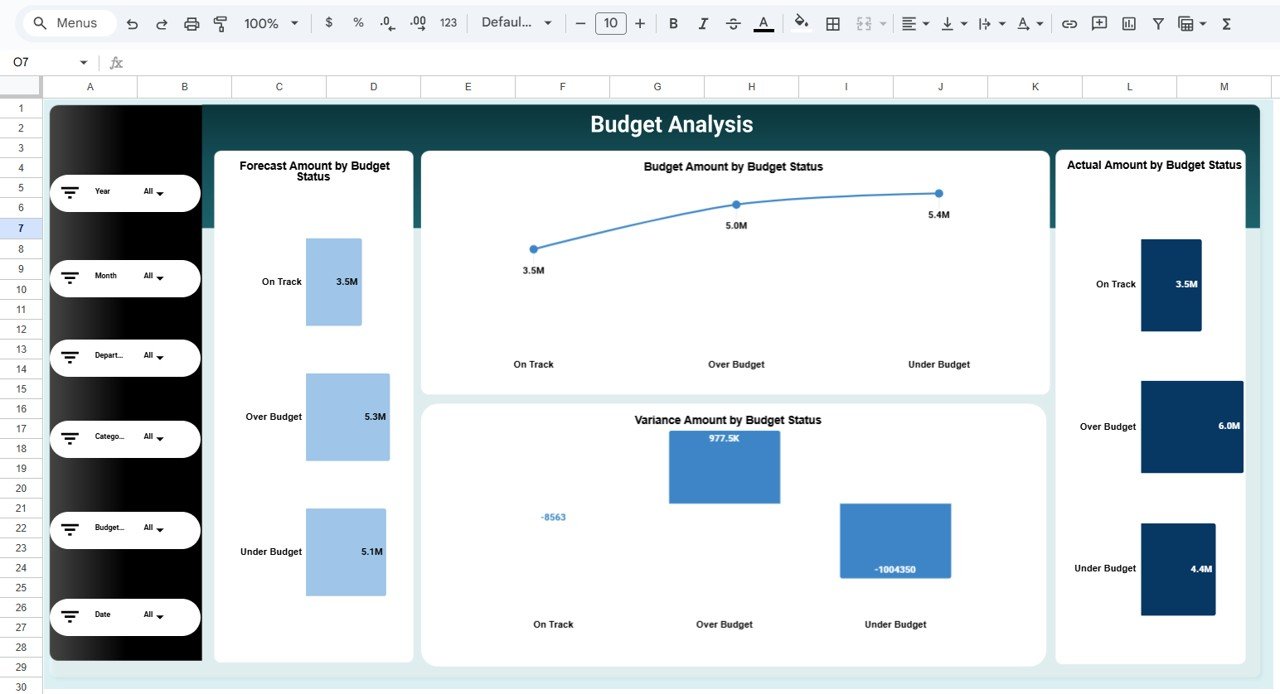
📌 Budget Status Analysis Section
Budgets are grouped by status (Under Budget, Over Budget, On Track):
-
Forecast Amount by Budget Status
-
Budget Amount by Budget Status
-
Actual Amount by Budget Status
-
Variance Amount by Budget Status
This helps teams quickly focus on budgets that need attention.
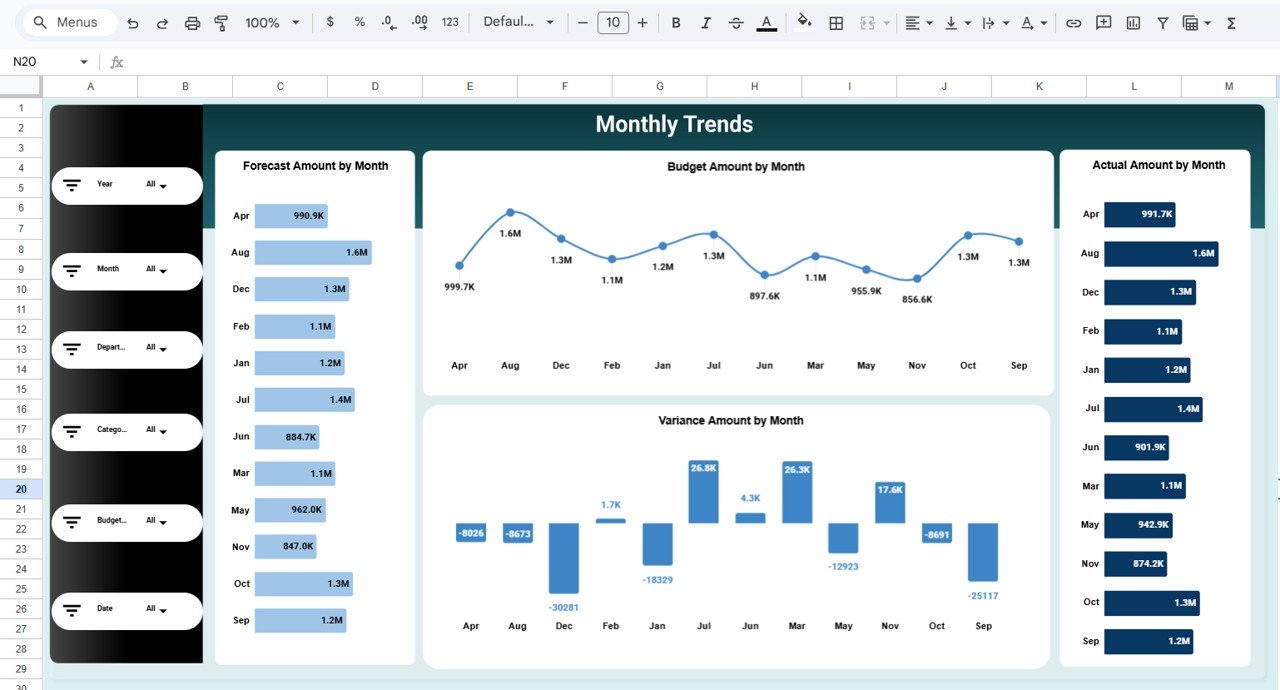
📅 Monthly Trends Analysis Section
Track how budget performance evolves across months:
-
Forecast Amount by Month
-
Budget Amount by Month
-
Actual Amount by Month
-
Variance Amount by Month
Monthly trends reveal seasonality and forecast accuracy.
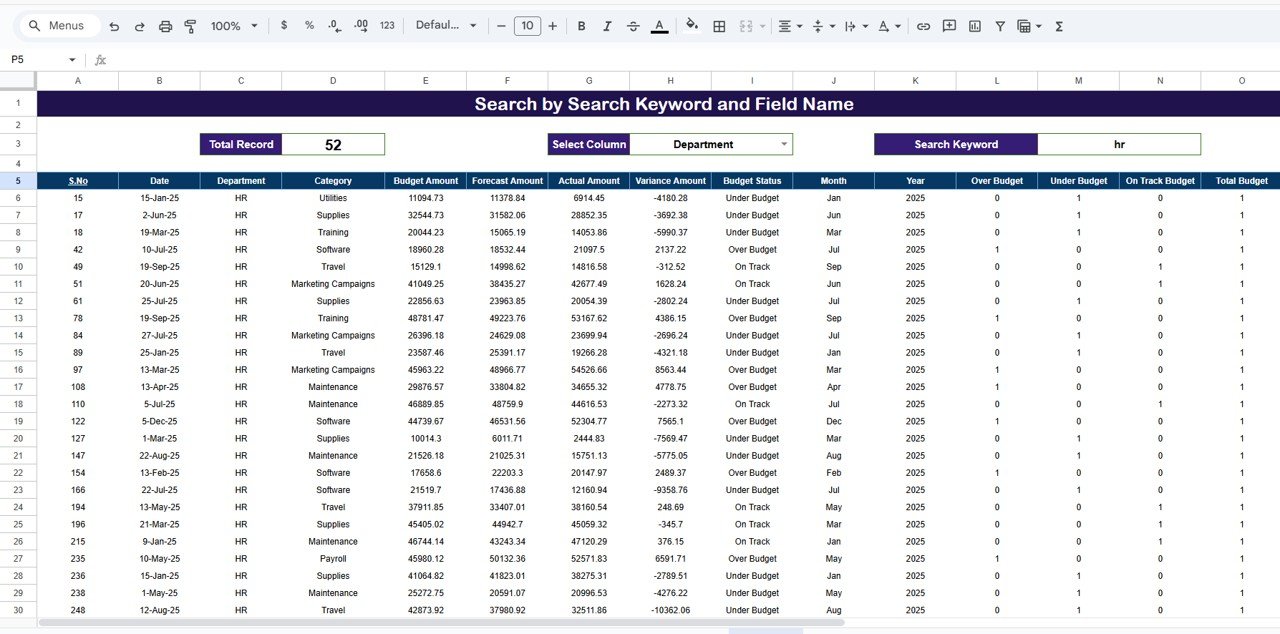
🔍 Search Feature – Find Budget Records Instantly
The built-in search allows filtering by:
-
Department
-
Category
-
Budget Status
-
Month
Perfect for audits, leadership reviews, and financial discussions.
📄 Data Input Sheet Tab – Backend Data Source
The Data Input sheet drives the entire dashboard. Typical fields include:
-
Date
-
Department
-
Category
-
Budget Amount
-
Forecast Amount
-
Actual Amount
-
Budget Status
Updating this sheet refreshes all dashboard visuals automatically.
🎯 Who Can Benefit from This Budget Forecasting Dashboard
💼 Finance Teams
Track budget performance and forecast accuracy easily.
🏢 Department Heads
Monitor spending and control costs proactively.
📊 Budget Owners
Understand variance and improve planning decisions.
👔 Leadership Teams
Gain high-level financial visibility for strategic planning.
🚀 Growing Organizations
Maintain financial discipline as operations scale.
### Click here to read the Detailed blog post
Watch the step-by-step video tutorial:


Reviews
There are no reviews yet.