Office infrastructure and furniture are not just physical assets—they directly impact employee comfort, productivity, workplace efficiency, and capital expenditure. Chairs, desks, workstations, cabinets, and meeting room furniture represent a significant long-term investment for every organization. However, when furniture inventory, costs, condition, and repairs are tracked across scattered spreadsheets, visibility is lost and decision-making becomes reactive.Office Infrastructure and Furniture Dashboard in Google Sheets
That is exactly why the Office Infrastructure and Furniture Dashboard in Google Sheets becomes a must-have asset management and facilities intelligence tool.Office Infrastructure and Furniture Dashboard in Google Sheets
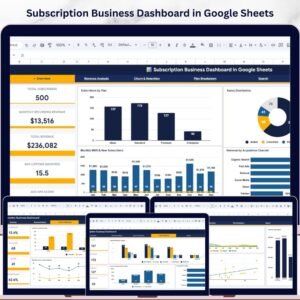
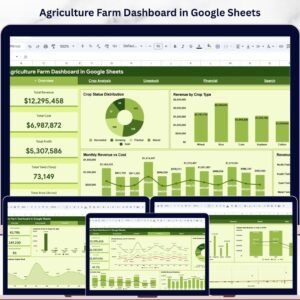
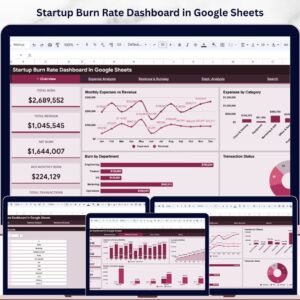
This ready-to-use Google Sheets dashboard provides a centralized, visual, and data-driven way to monitor office furniture and infrastructure. It helps organizations track inventory quantity, total cost, condition status, repair needs, vendor performance, and monthly trends—all from one interactive dashboard.
Because the dashboard is built entirely in Google Sheets, it is cloud-based, collaborative, cost-effective, and easy to maintain—without requiring any additional software or technical setup.
🧩 Key Features of Office Infrastructure and Furniture Dashboard
🗂️ Centralized Asset Visibility
Track all office furniture and infrastructure assets in one structured dashboard.
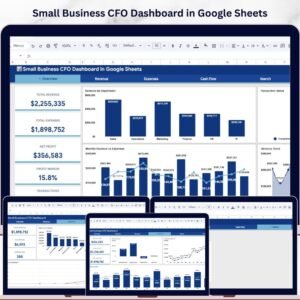
💰 Cost & Investment Tracking
Monitor total asset cost and location-wise spending easily.
🛠️ Condition & Repair Monitoring
Identify furniture in good condition, repair-needed, or disposed status instantly.
🏢 Location & Department Insights
Understand where assets are deployed and how departments consume resources.
🏭 Vendor Performance Analysis
Evaluate suppliers based on cost, quantity, and repair frequency.
📊 Auto-Updating Visuals
All charts refresh automatically as data changes.
🔍 Smart Search Feature
Find any furniture record in seconds using keyword search.
📦 What’s Inside the Office Infrastructure and Furniture Dashboard
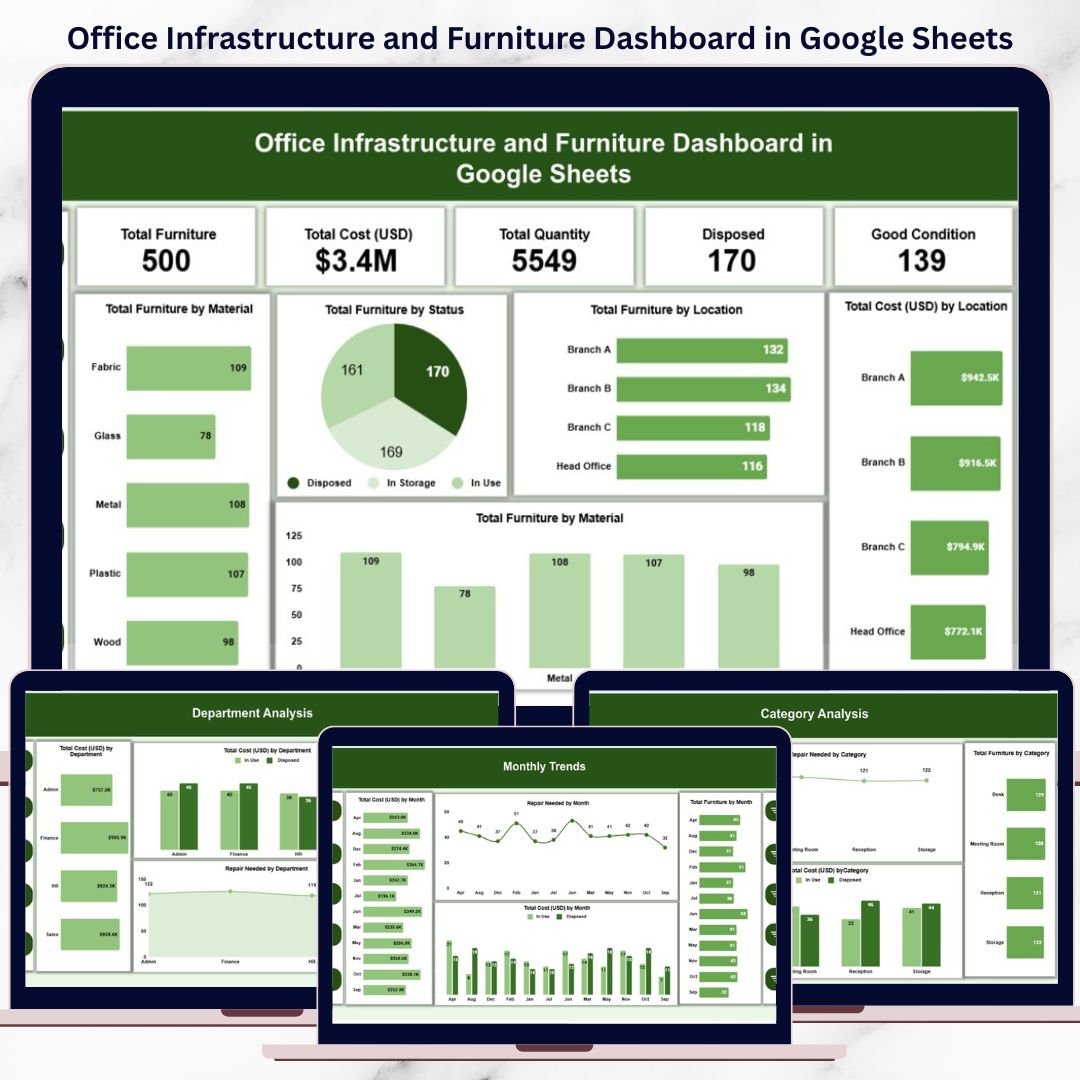
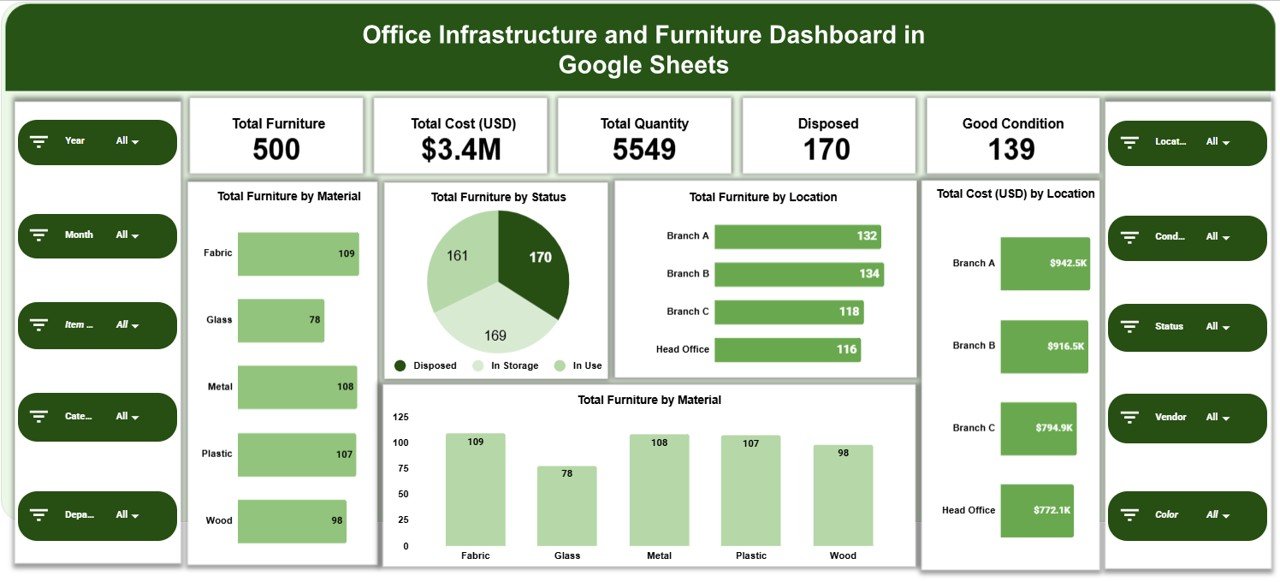
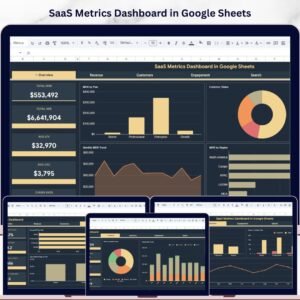
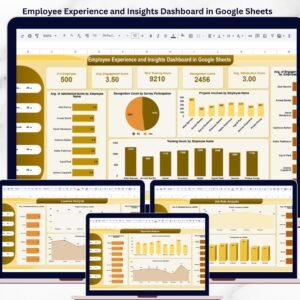
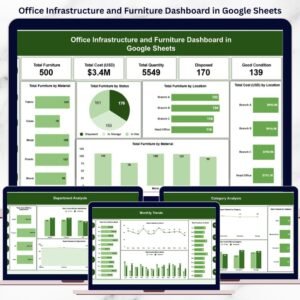
📊 Overview Sheet Tab – Executive Snapshot
The Overview sheet gives leadership instant visibility into asset health and spending.
🔢 KPI Cards Included:
-
Total Furniture – Total number of furniture items
-
Total Cost (USD) – Overall asset investment value
-
Total Quantity – Aggregate asset count
-
Disposed – Furniture items marked as disposed
-
Good Condition – Items currently in usable condition
📈 Overview Charts:
-
Total Furniture by Material (Wood, Metal, Plastic, Mixed)
-
Total Furniture by Status (Good, Repair Needed, Disposed)
-
Total Furniture by Location
-
Total Cost (USD) by Location
These visuals help management understand asset distribution and cost concentration instantly.
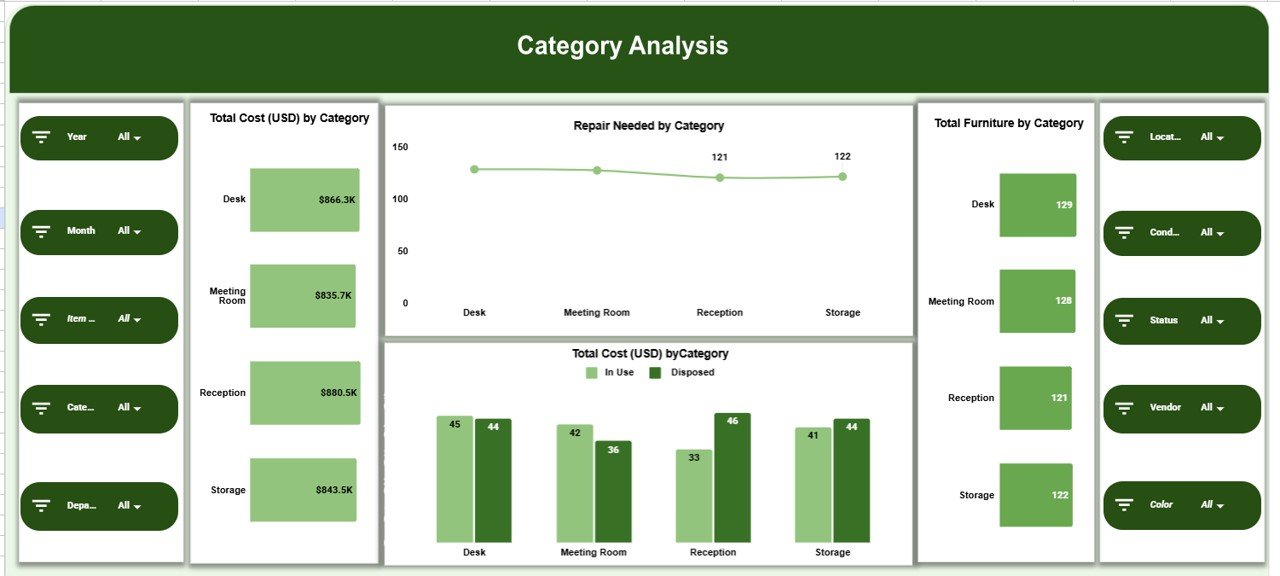
🪑 Category Analysis Section
This section focuses on furniture categories such as chairs, desks, workstations, cabinets, and meeting room furniture.
📊 Charts Included:
-
Total Cost (USD) by Category
-
Repair Needed by Category
-
Total Furniture by Category
It helps identify high-cost categories and furniture types with frequent repair needs.
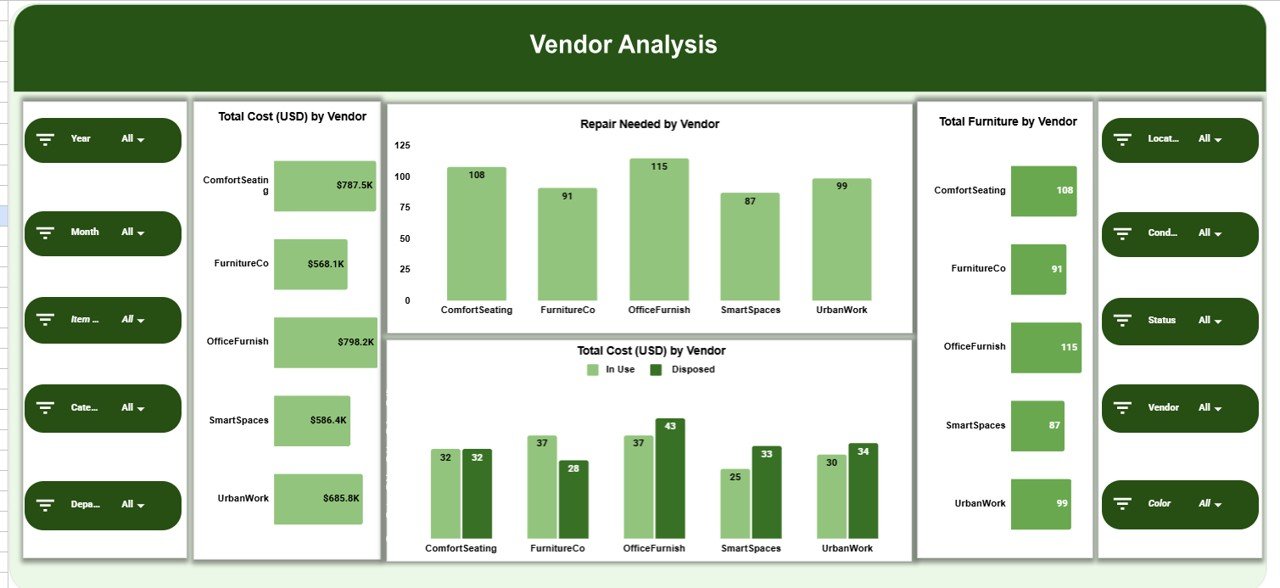
🏭 Vendor Analysis Section
This section evaluates supplier contribution and quality.
📊 Charts Included:
-
Total Cost (USD) by Vendor
-
Repair Needed by Vendor
-
Total Furniture by Vendor
These insights support smarter vendor selection, contract negotiation, and replacement planning.
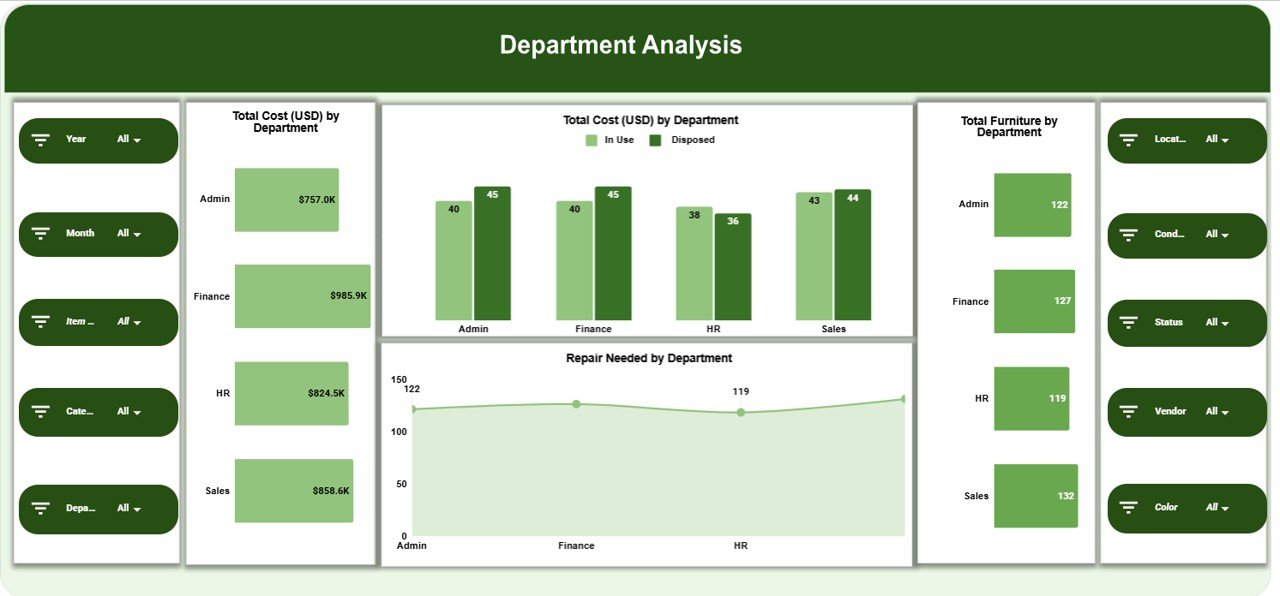
🏢 Department Analysis Section
Department-wise asset usage and condition analysis.
📊 Charts Included:
-
Total Cost (USD) by Department
-
Repair Needed by Department
-
Total Furniture by Department
This helps facilities and finance teams allocate budgets and identify departments with high maintenance demand.
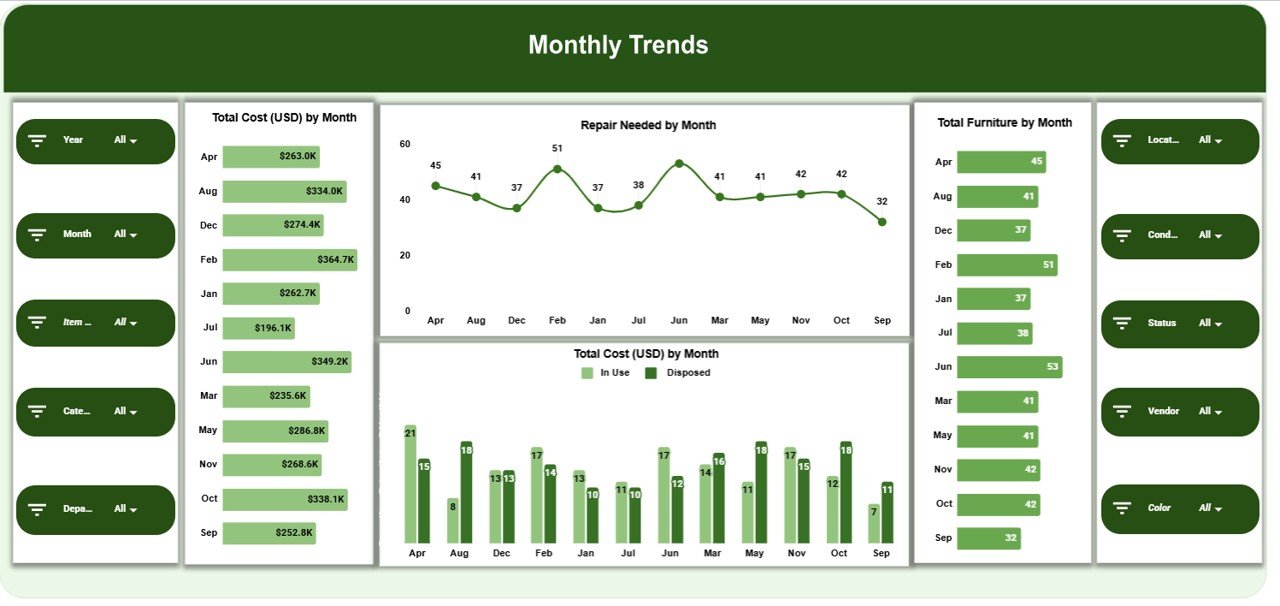
📅 Monthly Trends Section
Track how furniture inventory and costs change over time.
📊 Charts Included:
-
Total Cost (USD) by Month
-
Repair Needed by Month
-
Total Furniture by Month
This supports long-term planning, replacement cycles, and spending trend analysis.
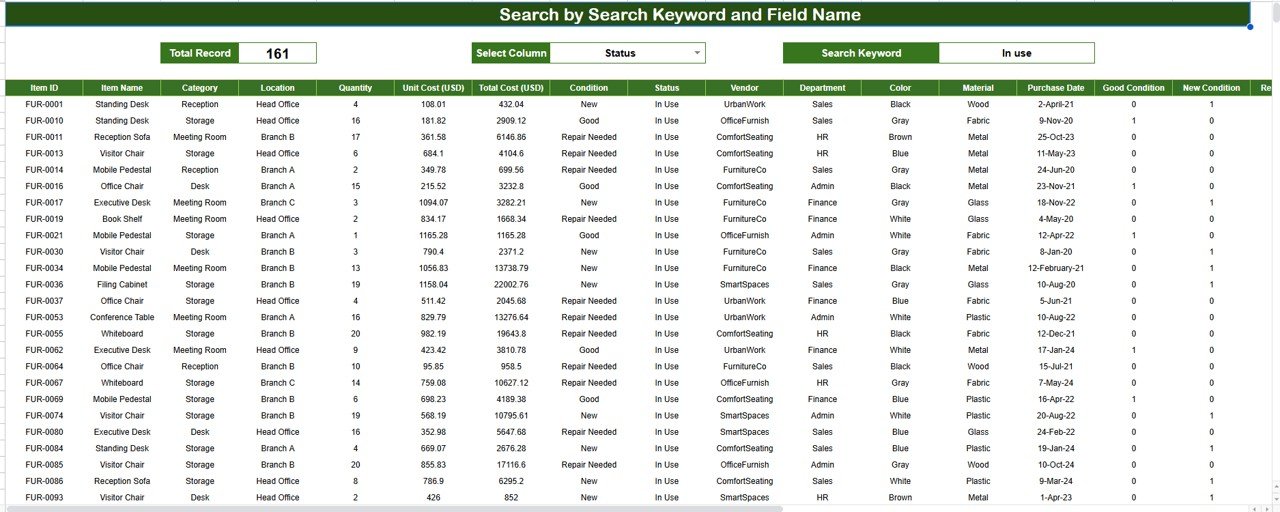
🔍 Search Feature – Search by Keyword and Field Name
The built-in smart search allows users to instantly locate records.
You can search by:
-
Furniture ID
-
Category
-
Vendor
-
Department
-
Location
-
Status
This is extremely useful for:
-
Inventory audits
-
Asset verification
-
Management reviews
-
Facilities inspections
No scrolling. No complex filters. Just instant results.
🧭 How to Use the Dashboard
-
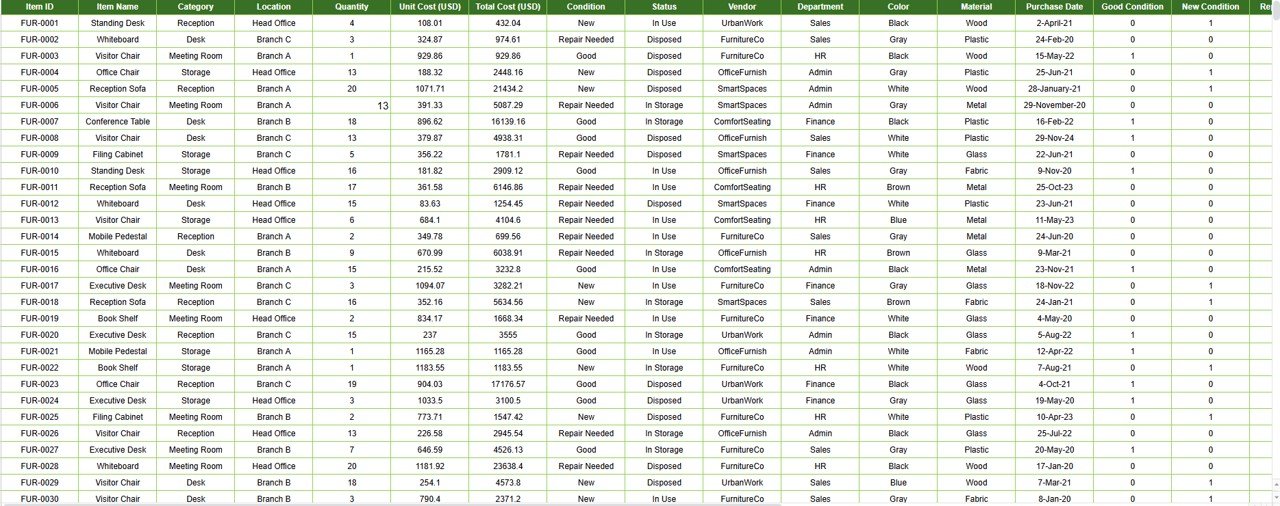
Maintain furniture and infrastructure records in the data sheet
-
Review KPI cards for asset health and cost summary
-
Analyze category, vendor, and department charts
-
Track repairs and disposal trends monthly
-
Use search to locate specific furniture items
-
Support budgeting, audits, and replacement planning
🎯 Who Can Benefit from This Dashboard
-
🏢 Facility & Admin Teams
-
💼 Procurement Teams
-
💰 Finance & Budgeting Teams
-
🧾 Asset & Inventory Managers
-
🧑💼 Operations Leadership
-
🔍 Internal Audit Teams
🔗 Click here to read the Detailed blog post
Watch the step-by-step video tutorial:


Reviews
There are no reviews yet.