Managing office vehicles without real visibility often leads to rising fuel costs, missed maintenance schedules, unused vehicles, and poor accountability. If your organization depends on company vehicles, managing them manually is no longer sustainable.
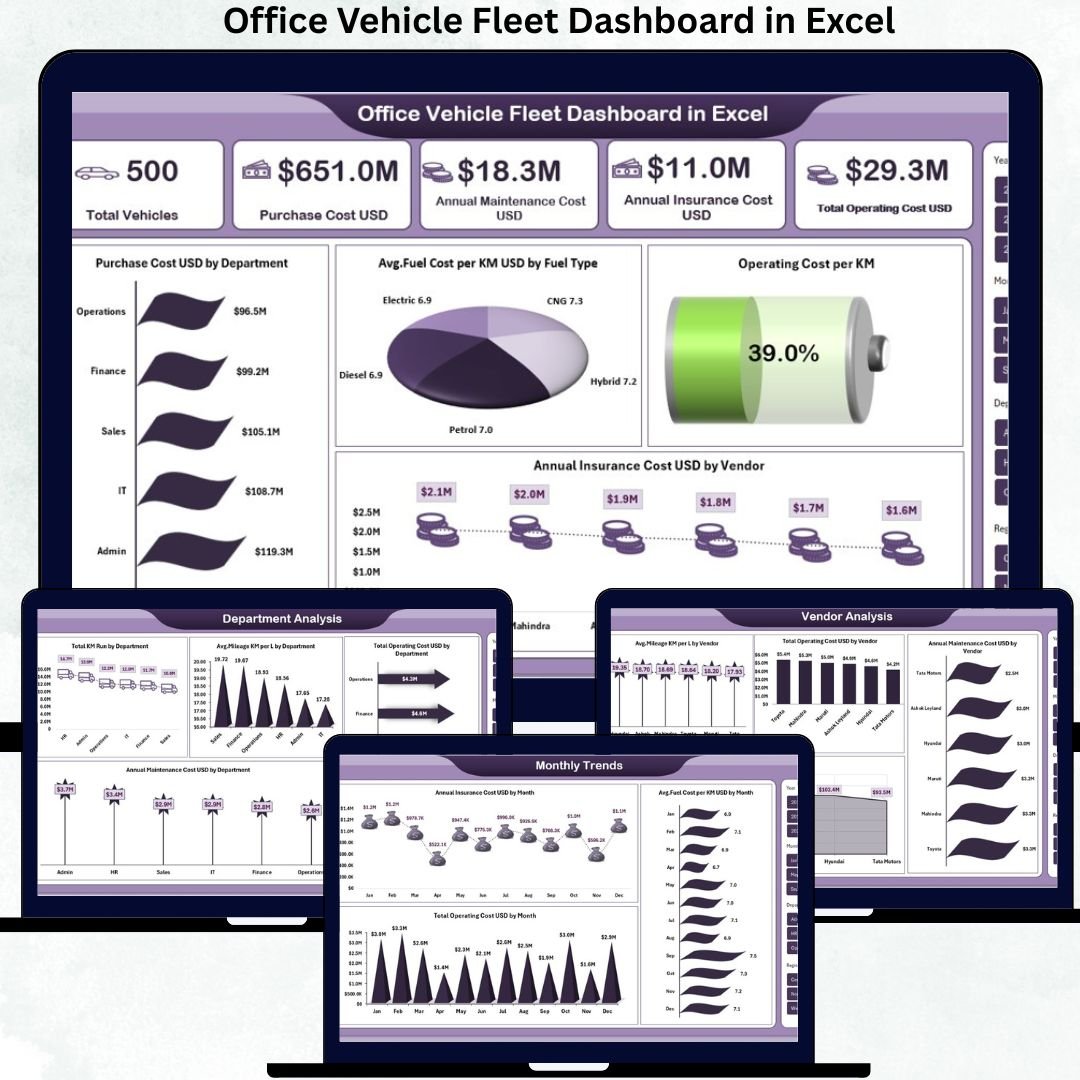
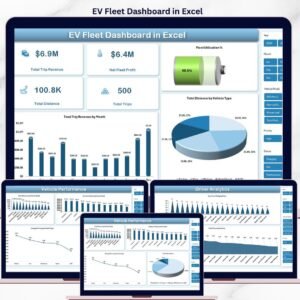
The Office Vehicle Fleet Dashboard in Excel is a powerful, ready-to-use solution that transforms raw fleet data into clear insights, actionable KPIs, and cost-saving intelligence—all within Microsoft Excel. No expensive software. No complex setup. Just instant clarity.
This Excel dashboard acts as a centralized control panel for your entire fleet, helping you monitor costs, usage, efficiency, downtime, and vendor performance across departments, regions, and months.
🔑 Key Features of Office Vehicle Fleet Dashboard in Excel
✅ All-in-One Fleet Visibility
Track vehicle count, purchase cost, fuel spend, insurance, maintenance, and operating cost from a single Excel file.
✅ Department-wise Cost Control
Compare usage, mileage, and operating expenses across departments to improve accountability.
✅ Region & Vendor Performance Analysis
Identify high-cost regions and underperforming vendors with clear visual breakdowns.
✅ Fuel Efficiency & Mileage Tracking
Analyze average mileage and fuel cost per KM by department, region, vendor, and fuel type.
✅ Monthly Trend Analysis
Detect seasonal cost spikes, fuel price impact, and insurance renewal patterns over time.
✅ Excel-Based & Easy to Use
No BI tools or subscriptions required—works completely inside Excel.
✅ Decision-Ready Visuals
Prebuilt KPI cards and charts designed for quick reviews and management reporting.
📦 What’s Inside the Office Vehicle Fleet Dashboard
This ready-made Excel file includes multiple analytical sheets designed to answer real business questions:
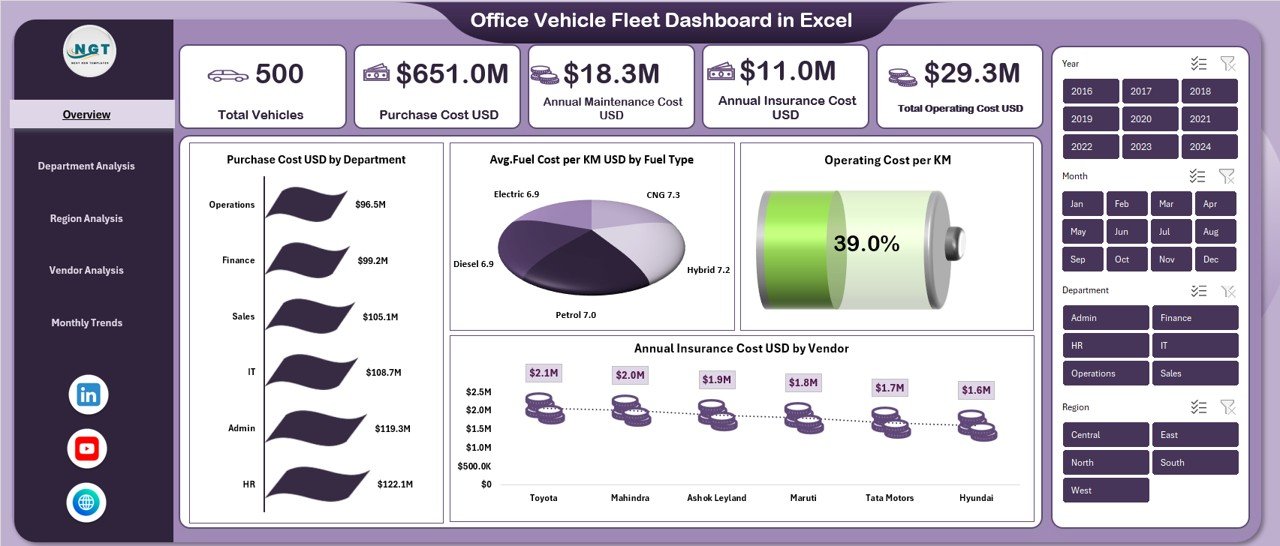
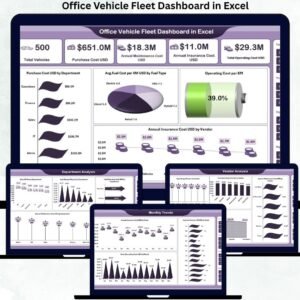
📌 Overview Sheet
Shows total vehicles, purchase cost, annual maintenance cost, insurance cost, total operating cost, and cost efficiency KPIs.
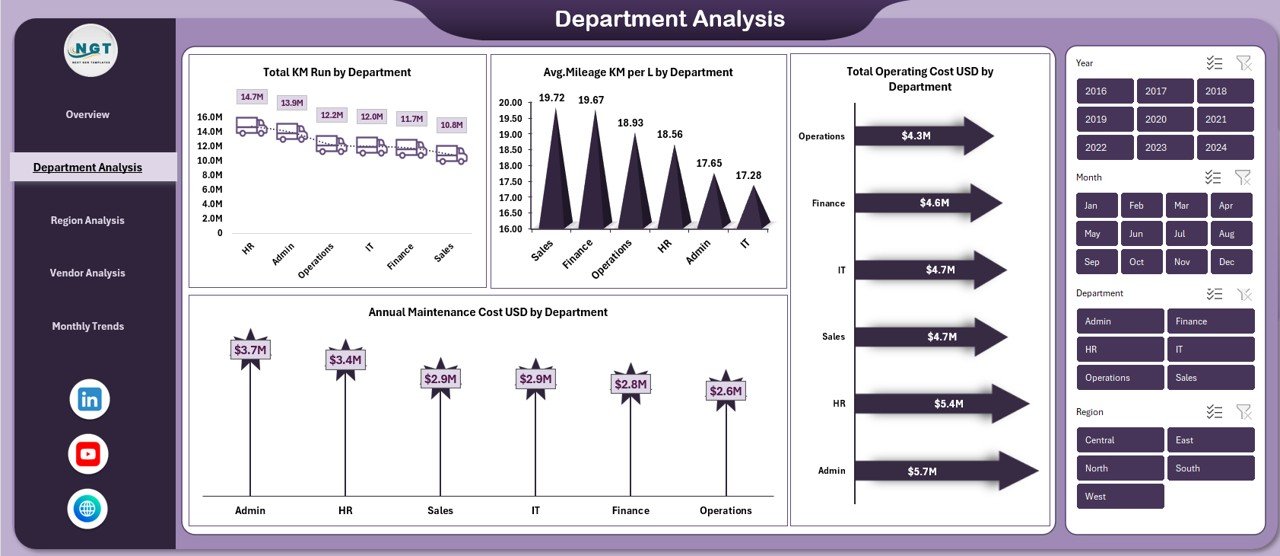
📌 Department Analysis Sheet
Tracks KM run, maintenance cost, mileage, and operating cost by department.
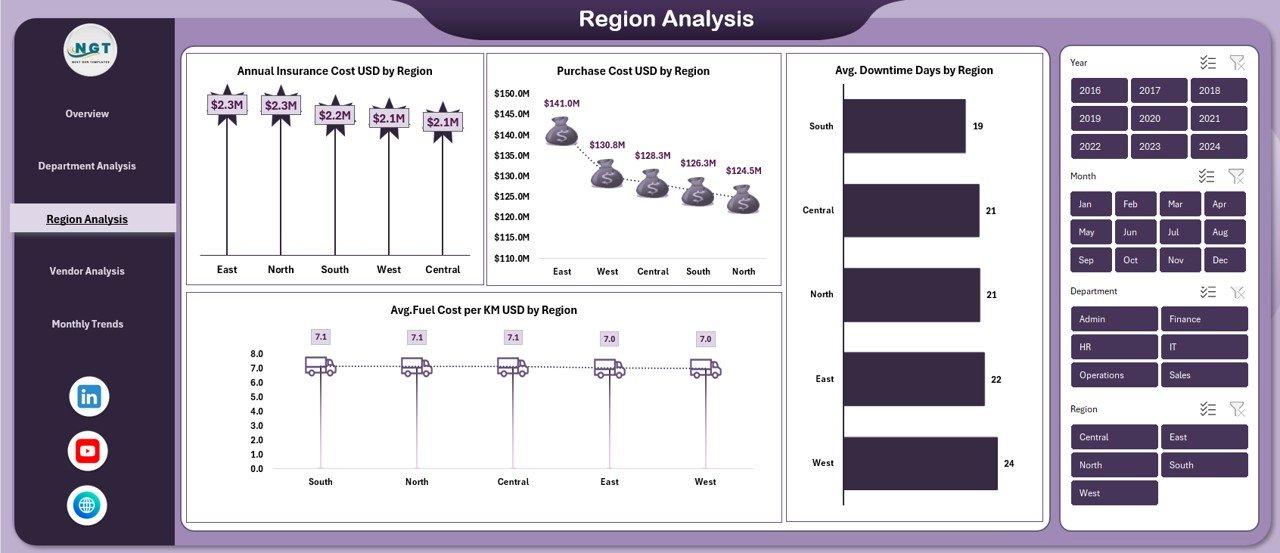
📌 Region Analysis Sheet
Highlights insurance cost, purchase investment, fuel cost per KM, and downtime days by region.
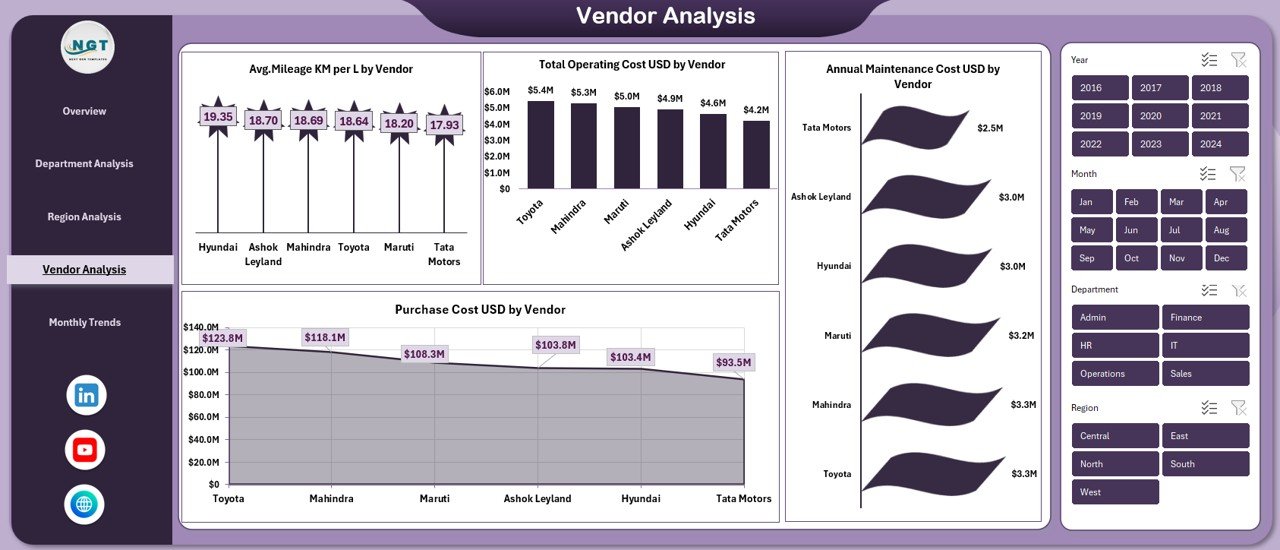
📌 Vendor Analysis Sheet
Evaluates vendors based on mileage, purchase cost, operating cost, and maintenance performance.
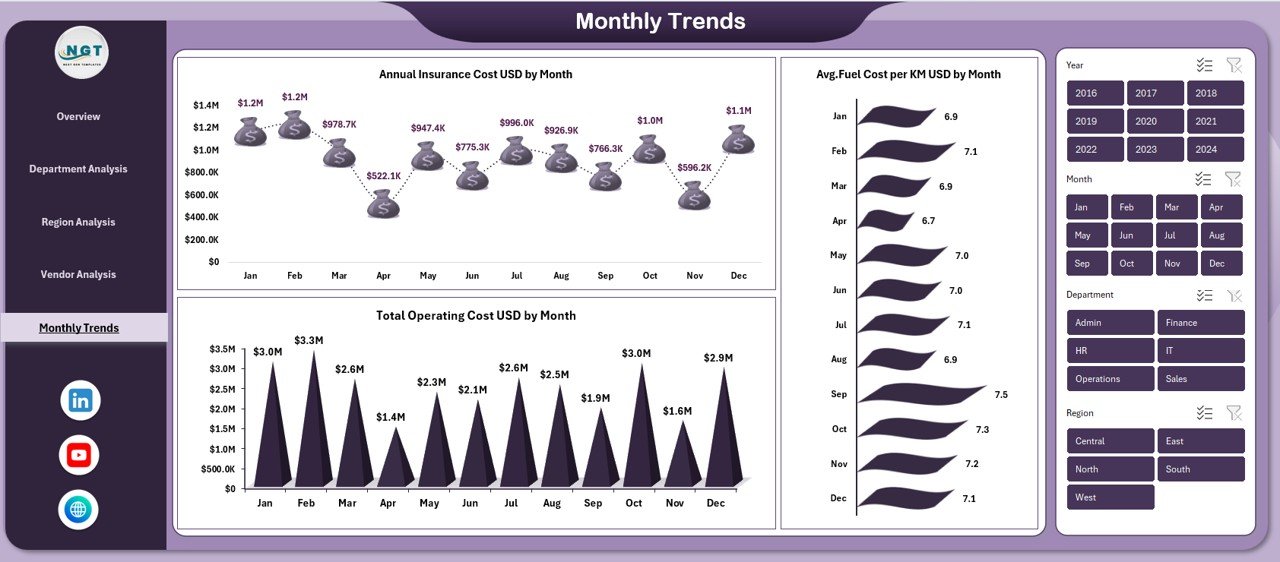
📌 Monthly Trends Sheet
Analyzes insurance, operating cost, and fuel cost trends month by month.
Each sheet is interactive, structured, and optimized for management-level reporting.
🧭 How to Use the Office Vehicle Fleet Dashboard
1️⃣ Enter your structured fleet data (Vehicle ID, fuel cost, maintenance, KM run, insurance, etc.)
2️⃣ Refresh or update data monthly
3️⃣ Instantly view KPIs and charts across all dashboard pages
4️⃣ Identify cost leakages, inefficiencies, and improvement opportunities
5️⃣ Take data-driven actions to optimize fleet performance
No advanced Excel knowledge is required—the dashboard logic is already built for you.
👥 Who Can Benefit from This Office Vehicle Fleet Dashboard?
🚗 Corporate Administration Teams – Gain full visibility into fleet expenses
📊 Finance & Accounts Teams – Control budgets and track cost efficiency
🏭 Operations & Logistics Managers – Optimize vehicle usage and downtime
🏢 Facility & Asset Managers – Monitor asset performance centrally
👥 HR & Transport Coordinators – Improve allocation and usage planning
🏗️ Manufacturing & Service Companies – Manage multi-location vehicle fleets
If your business uses office vehicles, this dashboard becomes an essential control tool.


Reviews
There are no reviews yet.