


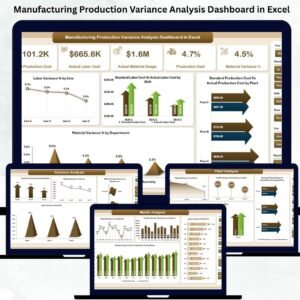
The Manufacturing Production Variance Analysis Dashboard in Excel is a five-page interactive workbook that turns raw production data into labor variance, material variance, and total production cost variance — broken down by plant, department, line, shift, and month. For US controllers, plant managers, and FP&A teams tracking standard vs actual cost, this Excel dashboard template replaces the end-of-month cost-accounting spreadsheet scramble with one automated workbook.
No MES implementation, no SAP DMC custom configuration, no 12-month onboarding — just an .xlsx file that connects five analytical pages to one backend data sheet. Enter your production actuals, and every variance calculation, KPI card, and chart updates automatically.
Why Variance Analysis Matters More Than It Did Five Years Ago
The numbers on why US manufacturers need structured variance visibility right now:
- US manufacturing value-added output hit $2.95 trillion annualized in Q3 2025, 9.5% of US GDP, with 12.69 million workers across 239,265 US manufacturing companies (BEA, BLS, Census Bureau). That’s a lot of standard-vs-actual cost accounting happening quarterly.
- Manufacturing unit labor costs rose 2.4% in 2025 (BLS, March 2026 revision) and manufacturing productivity decreased 2.5% in Q4 2025 with unit labor costs up 9.1%. When costs are rising and productivity is falling, variance visibility stops being a nice-to-have and becomes the difference between margin and loss.
- Full MES implementations cost $200,000–$1,500,000 over 12–18 months (SAP Digital Manufacturing Cloud, Siemens Opcenter, Rockwell Plex, MPDV HYDRA-X). Only 34% of MES buyers choose a solution that fits their needs (Software Advice, 2026).
- This dashboard is a one-time $17.99 purchase — no per-plant licenses, no multi-year implementation, no system integrator. Every controller, plant manager, or Six Sigma lead on your team opens the same
.xlsxfile in Excel they already own.
You don’t need a $500K MES implementation to answer “which plant is blowing its labor budget, which line has material waste, and which shift is off-standard.” You need clean variance formulas, slicers, and page-wise pivots — which is what this template is.

What’s Inside — Five Analytical Pages + Backend Data Sheet
Every slicer filters every page. One data refresh updates every visual. Page navigator jumps you between views in one click.
1️⃣ Overview Page — Complete Variance Snapshot
Executive-level KPIs for plant managers, controllers, and VPs of Operations:
- Labor Variance % — standard vs actual labor cost as a percentage deviation
- Material Variance % — material cost variance expressed as overall production impact
- Total Production Cost Variance — absolute dollar (or INR) variance across the portfolio
- Standard Cost Summary — the planned baseline you’re measuring against
- Actual Cost Summary — what actually happened on the floor
Supporting visuals: Labor Variance % by Line (identify underperforming production lines), Standard vs Actual Labor Cost by Shift (which shifts exceed targets), Standard vs Actual Production Cost by Plant (plantwise performance comparison), and Material Variance % by Department (spot wastage or inefficient material usage).
2️⃣ Department Analysis Page — Performance Across Production, Quality, Maintenance, Engineering
Detailed view of how each department performs against standards, with four core charts: Labor Variance % by Department, Standard vs Actual Labor Cost, Standard vs Actual Production Cost, and Material Usage Variance. This is where you catch the 14% labor overrun in Maintenance before it shows up on the quarterly management report.

3️⃣ Plant Analysis Page — Plant-Wise Variance Evaluation
Every plant operates differently. This page shows which facilities run efficiently and which need intervention: Material Variance % by Plant, Total Production Cost Variance by Plant, Standard vs Actual Labor Cost by Plant, Standard vs Actual Production Cost by Plant. If you’re running 3–12 plants across multiple states, this is the single page your operations VP lands on every Monday.
🏭 Ready to see your real cost variance this quarter? Click Add to Cart for $17.99, download the .xlsx file, and you’ll have your variance dashboard running the same afternoon — no MES, no consultant, no implementation project.
4️⃣ Variance Analysis Page — Deep-Dive Root-Cause Breakdown
This page focuses purely on variances: Production Cost Variance % by Plant, Material Variance % by Line, Material Usage Variance by Department, Labor Variance % by Shift. When the Overview shows you that you have a 7.2% cost variance, this page shows you where the variance is coming from — which specific plant, line, shift, or department is driving the number.
5️⃣ Month Analysis Page — Trend Detection & Forecasting Input
Manufacturing performance shifts month to month with demand, supplier pricing, and workforce availability. This page reveals trends: Material Variance % by Month, Total Production Cost Variance over time, Standard vs Actual Labor Cost monthly, Standard vs Actual Production Cost monthly. Feed these trends into your next annual operating plan, your next BOM price negotiation, and your next labor capacity model.

Backend Data Sheet — Your Single Source of Truth
One structured data tab holds every record: plant, department, line, shift, month, standard labor hours, actual labor hours, standard labor cost, actual labor cost, standard material cost, actual material cost, standard production cost, actual production cost. Every chart, every KPI card, every variance % pulls from this one sheet. Update once, see it everywhere.
Excel Template vs. MES vs. Manual Cost Accounting — The Honest Comparison
Where this template sits in the US manufacturing analytics stack:
| Capability | 📘 This Excel Template | 🏭 Full MES (SAP DMC, Siemens Opcenter, Plex) | 📂 Manual Cost Accounting Spreadsheets |
|---|---|---|---|
| Cost | ✅ $17.99 one-time | $200,000–$1,500,000 + 20% annual support | “Free” — but a senior controller spends 8–20 hours/month on it |
| Time to first variance report | ✅ Same afternoon | 12–18 months implementation | Rebuilt every month from scratch |
| Labor variance tracking | ✅ By plant, dept, line, shift | ✅ Native with machine-level data | Possible, but slow and error-prone |
| Material variance tracking | ✅ By plant, dept, line, month | ✅ Native with BOM integration | Usually a separate workbook |
| Standard vs Actual cost comparison | ✅ Sliced 5 ways | ✅ Advanced with PPV/MUV split | Reconciled manually end-of-month |
| Shift-level performance | ✅ Native slicer | ✅ Real-time from machine data | Rarely tracked at shift granularity |
| Real-time machine data, OEE, genealogy | ❌ Not included — feeds from your data sheet | ✅ Full MESA functional scope | ❌ Impossible at this level |
| Regulatory traceability (21 CFR Part 11, batch records) | ❌ Not a compliance system | ✅ Native for pharma / medical device | ❌ Non-compliant |
| Works offline on laptop | ✅ Excel Desktop | Cloud / server | ✅ Excel Desktop |
| Best for | Controllers, plant managers, Six Sigma leads who need variance visibility without a 12-month MES project | Mid-to-large manufacturers with $50M+ revenue, regulatory compliance needs, and shop-floor digitisation budget | Nobody — just the default before you upgrade |
If you’re running a $5M–$200M manufacturing operation and a full MES doesn’t pencil out yet, this template gives you the variance analytics layer without the MES price tag. If you’re pharma, medical device, or aerospace with Part 11 requirements, you need a full MES — use this template as a bridge or for reporting rollups on top.
Who Uses the Variance Analysis Dashboard
| Role / Team | How They Use It |
|---|---|
| Plant Controllers / Cost Accountants | Monthly standard-vs-actual variance reporting, explain-the-variance for management, close-the-books workflow |
| Plant Managers | Daily/weekly visibility into labor and material variances, shift performance, root-cause for off-standard lines |
| FP&A Analysts & Manufacturing Finance | Multi-plant variance rollup, forecast vs actual drift, feeds quarterly earnings reporting |
| VP of Operations / COO | Monday-morning portfolio review across all plants; which site needs the intervention this week |
| Lean & Six Sigma / CI Leads | Identify kaizen targets by variance magnitude, track improvement projects pre/post intervention |
| Industrial Engineers | Line-level variance analysis, standard-time re-baselining, capacity planning input |
| Quality & Production Engineers | Material usage variance for yield loss / scrap reduction projects; department-level trend tracking |
| Procurement & Supply Chain | Material price variance trend signals for supplier negotiation; BOM cost reconciliation |
How to Use the Variance Analysis Dashboard
- Download and open the Excel file — works in Microsoft Excel 2016 and later (Windows or Mac).
- Open the Data Sheet (the backend tab) — pre-structured with columns for plant, department, line, shift, month, standard and actual labor/material/production costs.
- Enter your production actuals from your ERP or cost-accounting system (SAP, Oracle, Microsoft Dynamics, Plex, QuickBooks Manufacturing, etc.).
- Flip to any dashboard page — Overview, Department, Plant, Variance, or Month — and watch the visuals update automatically.
- Apply slicers to filter by plant, department, line, shift, or month to drill into specific variance drivers.
- Use the page navigator to jump between views in one click during management reviews.
- Customise freely — add your own KPIs (PPV, MUV, scrap rate, yield %), rebrand to your corporate palette, extend the data sheet with cost centres or SKU-level granularity.
Why Choose This Variance Analysis Dashboard
- ✅ One-time $17.99 — no user licences, no annual renewal, no implementation project
- ✅ Five connected analytical pages + backend data sheet, all updating from one data entry point
- ✅ Automated variance formulas — labor, material, total production cost, standard-vs-actual, all calculated for you
- ✅ Interactive slicers for plant, department, line, shift, and month-level filtering
- ✅ Clean KPI cards for instant executive-ready reporting
- ✅ Excel 2016+, Windows or Mac — no cloud dependency, works offline
- ✅ Fully editable — add your own KPIs, rebrand, extend the data schema
- ✅ Video walkthrough included to get you from download to dashboard in under an hour
Explore Related Manufacturing & Operations Templates
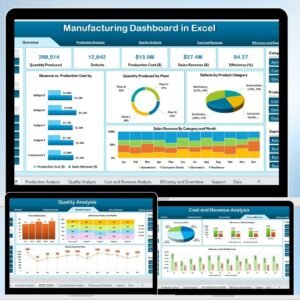
- 🏭 Manufacturing Analytics — Manufacturing Dashboard in Excel (OEE, downtime, defects)
- ⚙️ Power BI Edition — Manufacturing Efficiency Dashboard in Power BI
- 🏗️ Construction & Project Cost — Construction Dashboard in Excel for project-level variance
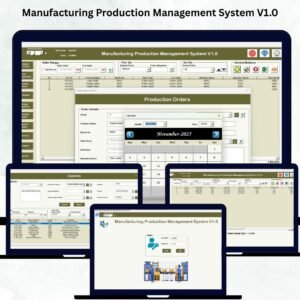
- 📦 Inventory & Material — Inventory Management System V3.0 for BOM & material tracking
- 🛒 Procurement Analytics — Procurement Dashboard in Excel for supplier & material price variance
- 💰 Finance & Audit — Financial Audit Checklist in Excel
- 📊 All Excel Dashboards — browse the Excel Dashboard collection
- 🏭 All Manufacturing Templates — browse Manufacturing dashboards
Frequently Asked Questions
What is the Manufacturing Production Variance Analysis Dashboard in Excel?
It is a ready-to-use .xlsx template that takes your production cost data (standard vs actual labor, material, and total production cost by plant, department, line, shift, and month) and turns it into five interactive analytical pages: Overview, Department Analysis, Plant Analysis, Variance Analysis, and Month Analysis. Every slicer filters every page; one data update refreshes all visuals.
How much does this Variance Analysis Dashboard cost?
The template is priced at $17.99 as a one-time payment (on sale from $24.99). No monthly fees, no per-user licences, no annual renewal. For reference, full manufacturing execution system implementations (SAP Digital Manufacturing Cloud, Siemens Opcenter, Rockwell Plex, MPDV HYDRA-X) run $200,000–$1,500,000 with 12–18 month implementation timelines.
Does this replace a full MES like SAP DMC, Siemens Opcenter, or Plex?
No — this is a variance analytics dashboard, not a full manufacturing execution system. It does not capture real-time machine data, manage work orders, track product genealogy, or handle 21 CFR Part 11 / electronic batch record compliance. If you’re in pharma, medical device, or aerospace with regulatory traceability needs, you need a real MES. If you’re a discrete manufacturer running standard costing and you want a fast, affordable way to surface labor and material variances across plants and departments, this template covers that cleanly for $17.99.
Will this work with my ERP (SAP, Oracle, Microsoft Dynamics, NetSuite, QuickBooks)?
Yes. The dashboard doesn’t integrate with your ERP directly — you export standard-cost and actual-cost data from your ERP (most ERPs have a “Cost Variance” or “Production Cost” report), paste it into the Data Sheet, and the dashboard updates. If your team already exports variance reports monthly, you’re 80% of the way there. A sample dataset ships with the file so you can see the exact format before migrating your own data.
What cost accounting method does this assume — standard costing?
Yes. The variance framework compares standard (planned) costs against actual costs, which is standard costing practice in most US discrete manufacturing. If you use actual costing, weighted-average, or FIFO, you can still use the dashboard — just populate both the “standard” and “actual” columns with your comparison baselines (e.g., prior-period actuals vs current-period actuals, or forecast vs actual).
Can I use this on Mac?
Yes. The dashboard is built in standard Excel (no VBA macros, no Windows-only features) and runs identically on Microsoft Excel for Mac 2016 and later. If you’re on older Mac Excel (2011 or earlier), some pivot features may behave differently — upgrade to a supported version for best results.
How granular can I get — SKU level, machine level, operator level?
Out of the box, the dashboard is structured at plant / department / line / shift / month granularity. You can extend the data sheet with additional columns (SKU, work order, machine ID, operator ID) and add new pivot views for deeper analysis — the dashboard is fully editable and the formulas are transparent, not locked.
How often should I update the dashboard?
Monthly at minimum (aligned to financial close) is the most common cadence. Plants running weekly operations reviews typically update weekly. Some CI-focused teams refresh after every shift for real-time performance tracking — the dashboard supports any cadence as long as you can populate the data sheet.
Can I add Power BI DAX measures or connect this to Power BI?
Yes. The data sheet is a clean tabular structure — import it into Power BI, Tableau, or Qlik as a data source, or use Excel as your analyst layer and Power BI as your exec-reporting layer. Many customers use this template as the analyst’s working file and build Power BI dashboards on top for C-suite consumption.
Is this a one-time purchase or a subscription?
One-time purchase. Pay $17.99 once, download immediately, own the file for life. No recurring fees, no user limits, no cloud dependency.
Get Real Variance Visibility This Quarter
Stop reconciling standard vs actual costs by hand at every month-end close. The Manufacturing Production Variance Analysis Dashboard in Excel gives you a live, interactive view of labor variance, material variance, and total production cost variance — across plants, departments, lines, shifts, and months — from one backend data sheet. Click Add to Cart above for $17.99 and have your variance dashboard running the same afternoon.
📖 Read the detailed Variance Analysis Dashboard walkthrough on our blog
For step-by-step video tutorials on Excel dashboards and manufacturing analytics, visit our YouTube channel: Youtube.com/@PKAnExcelExpert


Reviews
There are no reviews yet.