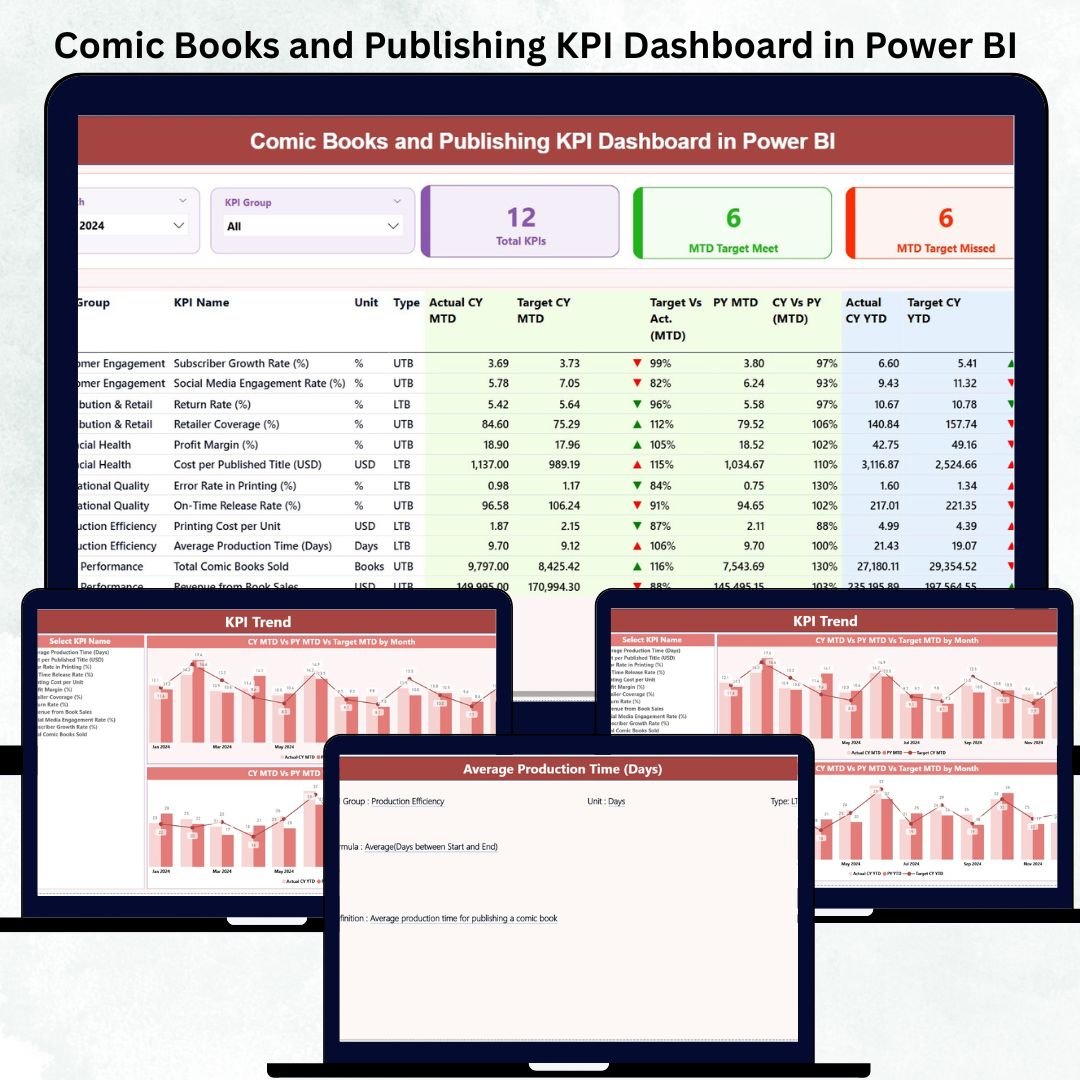
Comic Books and Publishing KPI Dashboard in Power BI The comic book and publishing industry moves fast. Story creation, artwork, editing, printing, distribution, marketing, and sales all happen at the same time — and even a small delay can slow down the entire publishing cycle. Comic Books and Publishing KPI Dashboard in Power BI Managing all these components manually becomes confusing and time-consuming. That’s why publishers, creators, and production teams now use the Comic Books and Publishing KPI Dashboard in Power BI to track every performance indicator in one place.
This fully interactive dashboard converts your Excel data into beautiful visuals, trend charts, and KPI comparisons. Comic Books and Publishing KPI Dashboard in Power BI Whether you manage a small comic team or a large publishing house, this dashboard gives you real-time clarity on your monthly and yearly performance. Comic Books and Publishing KPI Dashboard in Power BI, It helps you analyze story development, artwork completion, sales vs. targets, operational efficiency, financial performance, and overall publishing timelines.
Let’s explore everything inside this powerful dashboard 👇
✨ Key Features of the Comic Books and Publishing KPI Dashboard in Power BI
📊 1. Three Powerful Reporting Pages
Includes Summary, KPI Trend, and KPI Definition pages — giving you a complete 360° view of your publishing operations.
🎯 2. Smart Filters & Instant Insights
Use the Month Slicer and KPI Group Slicer to analyze MTD and YTD performance instantly.
📈 3. Detailed KPI Tracking for Publishing Workflows
Track metrics across content, artwork, production, operations, marketing, and sales.
🔄 4. Excel-Based Data Source
Update Actuals, Targets, and Definitions in Excel — Power BI handles the rest automatically.
📉 5. CY vs PY Comparisons
See how current performance compares with last year to measure real growth.
📘 6. Drill-Through KPI Definition Page
Understand formulas, KPI types, and definitions with a single click.
📦 What’s Inside the Comic Books and Publishing KPI Dashboard in Power BI
🏠 1. Summary Page — Your Main Publishing Control Center
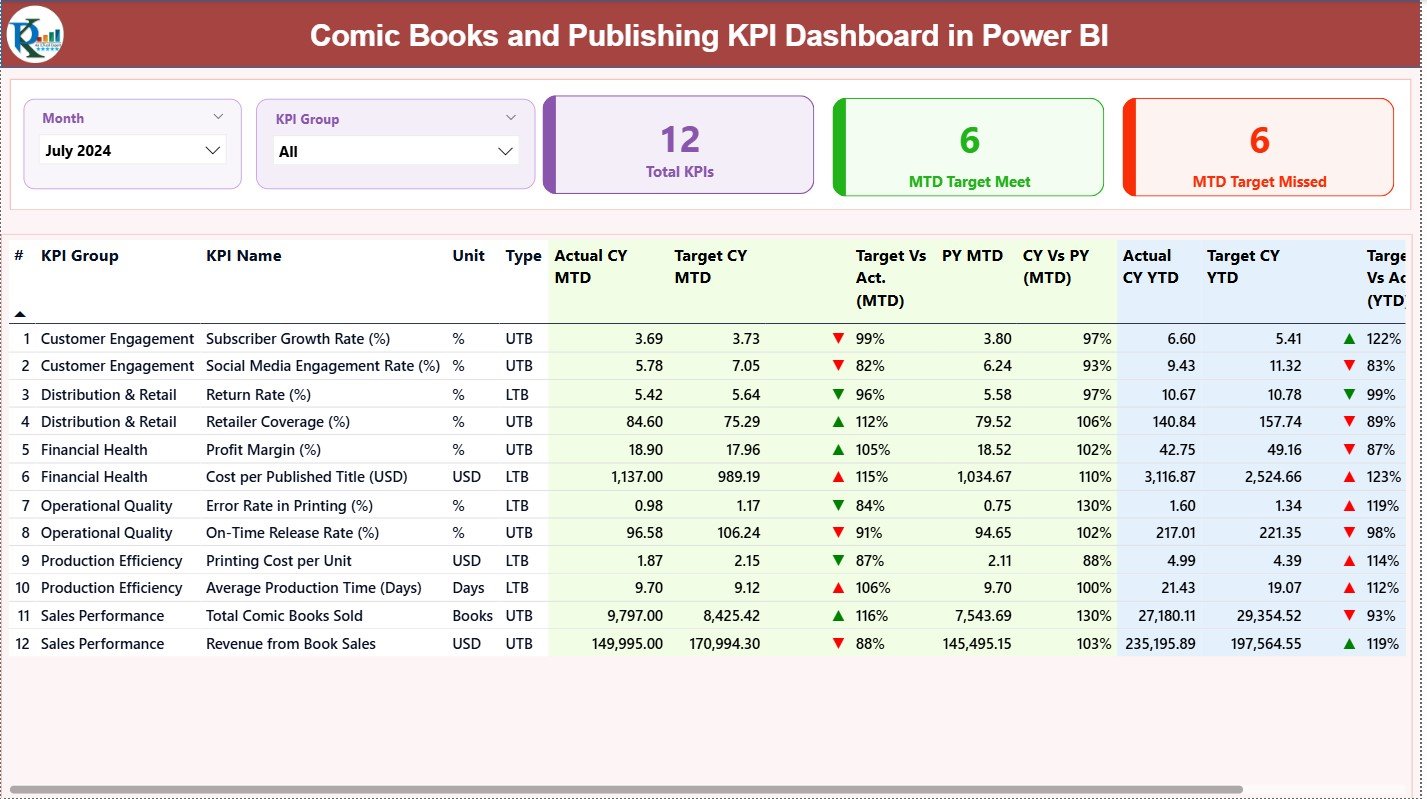
This is the heart of the dashboard. It shows everything you need to assess your publishing performance:
⭐ Top Filters
-
Month Slicer
-
KPI Group Slicer
These help you analyze specific categories like Content, Marketing, Sales, or Operations.
⭐ Three KPI Cards
-
Total KPI Count
-
MTD Target Met Count
-
MTD Target Missed Count
You instantly see how well the publishing team is performing.
⭐ Detailed KPI Table
This comprehensive table includes:
-
KPI Number
-
KPI Group
-
KPI Name
-
Unit (Pages, %, USD, Count)
-
Type: LTB (Lower the Better) / UTB (Upper the Better)
And full MTD & YTD insights:
-
Actual CY MTD & Target CY MTD
-
Target vs Actual % (MTD)
-
CY vs PY (MTD)
-
Actual CY YTD & Target CY YTD
-
YTD indicators (▲▼)
-
CY vs PY (YTD)
This table helps you instantly answer:
✔ Are we on track this month?
✔ Are we meeting yearly targets?
✔ How are we performing vs last year?
✔ Which KPIs need attention?
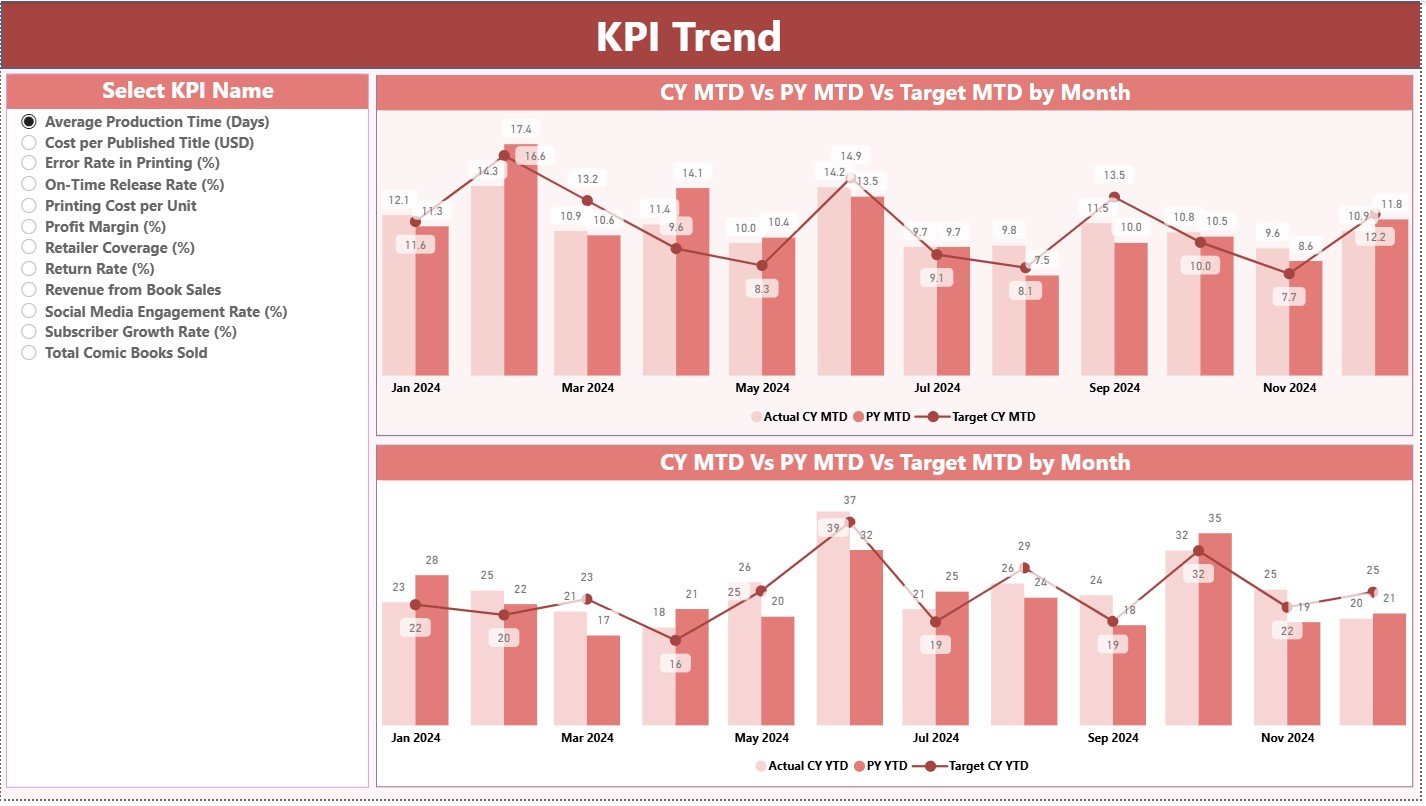
📈 2. KPI Trend Page — Visual Trend Insights Across Months
This page helps you track seasonal patterns and long-term performance.
⭐ What You See
-
Left-side KPI slicer
-
MTD Trend Chart (CY vs PY vs Target)
-
YTD Trend Chart (CY vs PY vs Target)
These trend charts help you analyze:
-
Story completion progress
-
Page creation volume
-
Artwork completion rate
-
Editing cycle speed
-
Sales and marketing trends
These visuals help you plan future releases, campaigns, and production timelines accurately.
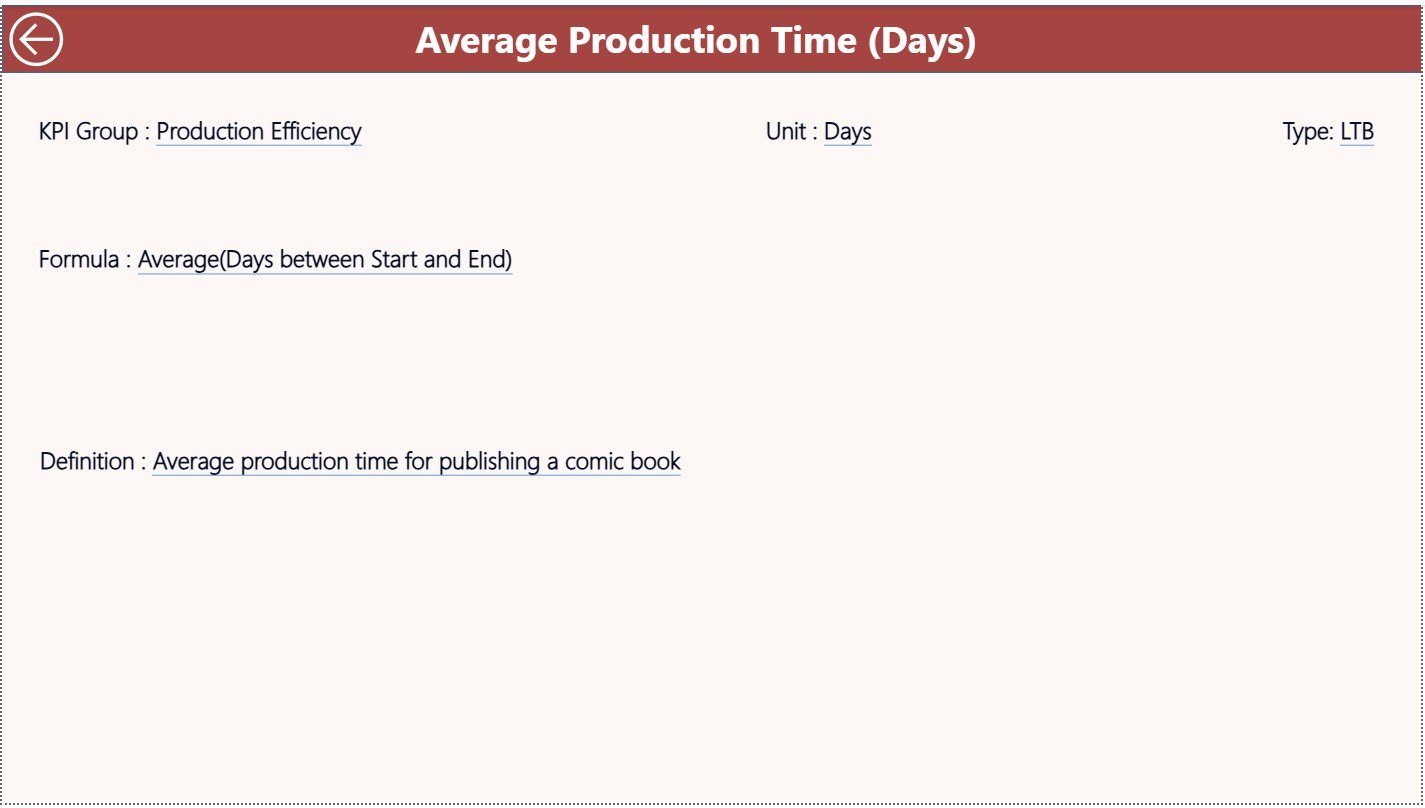
📘 3. KPI Definition Page — Complete KPI Dictionary
This drill-through page shows:
-
KPI Number
-
KPI Group
-
KPI Name
-
Unit
-
Formula
-
KPI Definition
-
Type (LTB/UTB)
Whenever you need clarity on a KPI, drill through from the Summary Page and return using the back button. This keeps your entire team aligned.
🧭 How to Use the Comic Books and Publishing KPI Dashboard in Power BI
🪄 Step 1: Update Excel Data
Enter Actuals, Targets, and Previous Year values in the three Excel sheets.
🔄 Step 2: Refresh Power BI
The dashboard updates instantly with refreshed visuals.
🎯 Step 3: Choose KPIs & Filters
Use the Month and KPI Group slicers to analyze specific areas.
📈 Step 4: Review Monthly vs Yearly Performance
Check MTD and YTD comparisons to see how targets are progressing.
📉 Step 5: Use Trend Charts
Study the MTD & YTD visual trends for planning future strategies.
📘 Step 6: Drill Through for Definitions
Understand formulas and KPI meanings through the definition page.
🎯 Who Can Benefit from This Dashboard?
📚 Comic Publishers & Book Houses
Monitor production, marketing, and sales performance.
✍️ Writers & Story Creators
Track story completion and editing cycles.
🎨 Artists & Designers
Monitor pages created, artwork progress, and load balancing.
📢 Marketing Teams
Track campaign effectiveness and sales KPIs.
🏭 Production Managers
Monitor printing timelines and distribution KPIs.
📊 Sales Teams & Managers
Compare sales vs targets across months and years.


Reviews
There are no reviews yet.