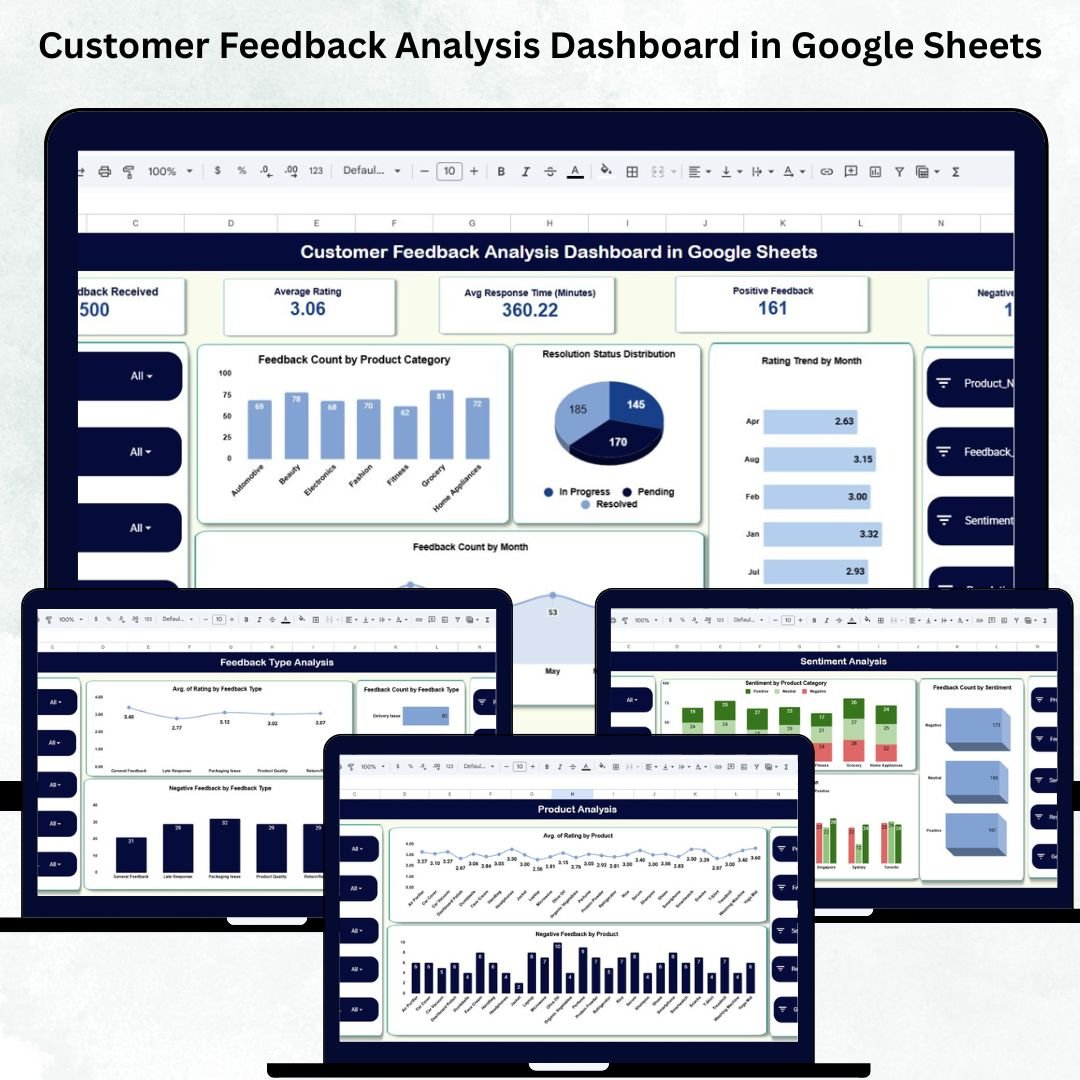
Customer feedback is one of the most valuable assets a business can collect. It reveals customer experience, product performance, market expectations, and areas that need improvement. But when feedback is spread across emails, forms, spreadsheets, and messages, it becomes difficult to organize and impossible to analyze manually. That’s where the Customer Feedback Analysis Dashboard in Google Sheets comes in—your complete, automated, and visually rich solution for understanding customer sentiment and improving decision-making.Customer Feedback Analysis Dashboard in Google Sheets
This dashboard brings together all feedback data into one powerful cloud-based system. It helps you track ratings, sentiment, monthly trends, response time, product-level insights, and feedback type performance. Every card, chart, and section is fully automated, giving your team real-time visibility without requiring technical skills.Customer Feedback Analysis Dashboard in Google Sheets
✨ Key Features of the Customer Feedback Analysis Dashboard in Google Sheets
📌 1. Dynamic KPI Cards for Instant Insights
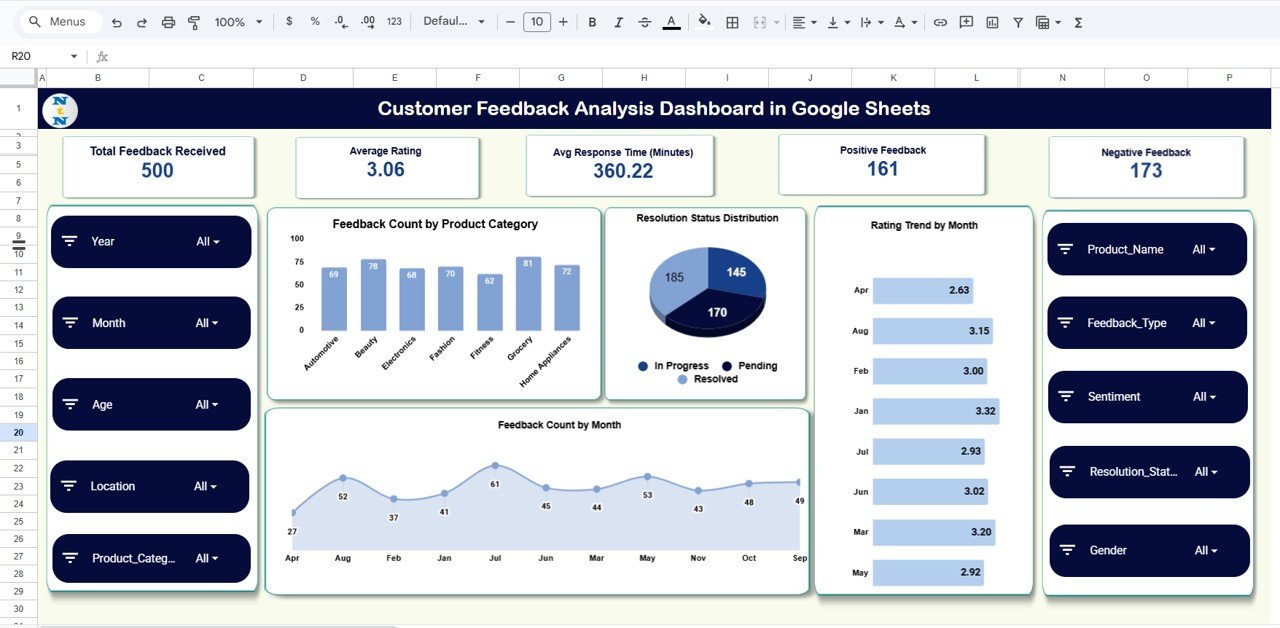
The top section of the dashboard displays five critical customer experience KPIs:
-
Total Feedback Received
-
Average Rating
-
Average Response Time (Minutes)
-
Positive Feedback Count
-
Negative Feedback Count
These cards summarize your overall customer satisfaction in seconds, helping managers understand performance at a glance.
📊 2. Feedback Count by Product Category
This chart highlights which product categories receive the most feedback. It helps businesses:
-
Identify high-interaction products
-
Detect areas with potential problems
-
Prioritize improvements where most customers are affected
High feedback volume can indicate popularity, frequent issues, or active customer engagement.
⏳ 3. Resolution Status Distribution
This visual shows the distribution of:
-
Resolved
-
Pending
-
In-Progress
-
Escalated
It helps evaluate customer support efficiency and highlights workload or bottlenecks in your service process.
⭐ 4. Rating Trend by Month
Track how your monthly average rating changes over time.
This chart helps you identify:
-
Seasonal variations
-
Effects of new product launches
-
Impact of service improvement efforts
-
Months with unusually high or low ratings
It is one of the most important trend indicators for quality and customer satisfaction.
📅 5. Monthly Feedback Count
This chart displays the total feedback received each month.
It helps teams plan workload, understand customer engagement patterns, and identify peak periods.
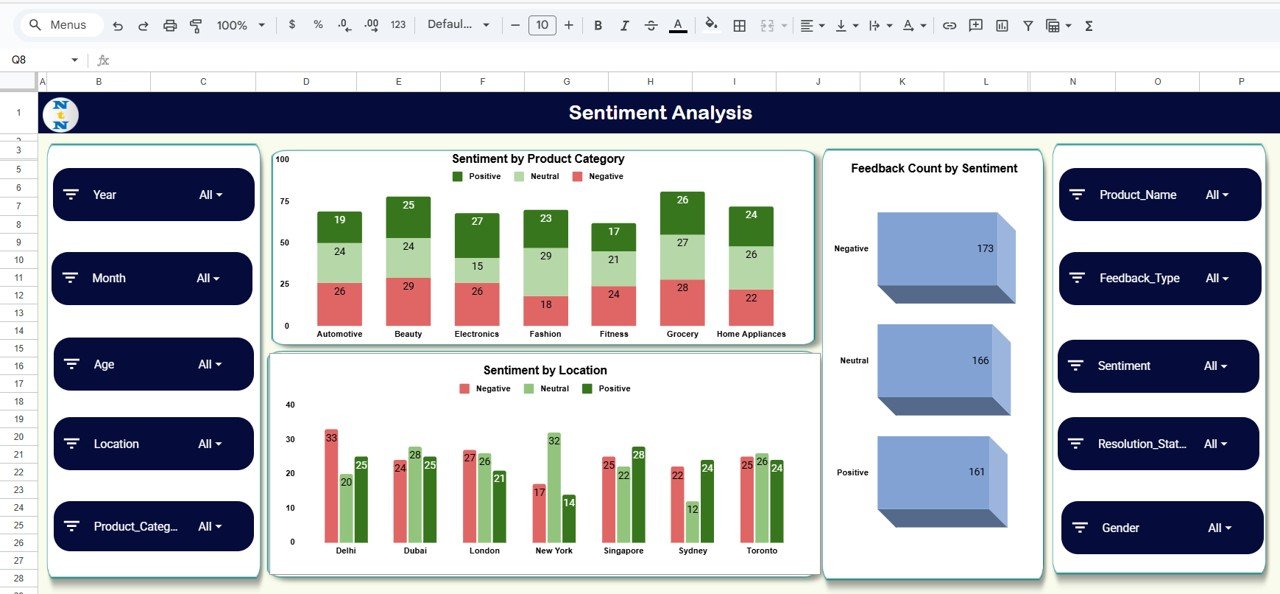
✨ Sentiment Analysis – Understand Customer Emotions
This dashboard includes a full sentiment analysis module that breaks down feedback into Positive, Neutral, and Negative categories.
Charts included:
-
Sentiment by Product Category
-
Feedback Count by Sentiment
-
Sentiment by Location
These visuals help businesses understand emotional trends, detect customer pain points, and identify strong-performing regions.
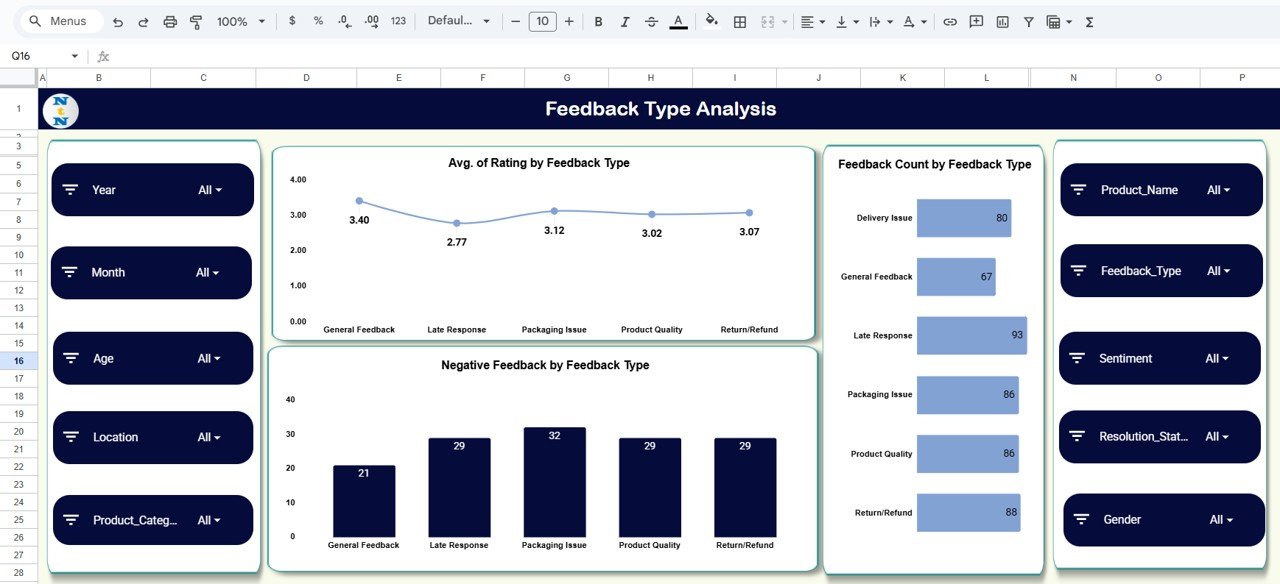
✨ Feedback Type Analysis – Deep Performance Insights
Not all feedback is the same. That’s why the dashboard includes detailed Feedback Type Analysis.
Charts included:
-
Average Rating by Feedback Type
-
Feedback Count by Feedback Type
-
Negative Feedback by Feedback Type
This helps teams understand which feedback categories require immediate attention and which topics customers care about most.
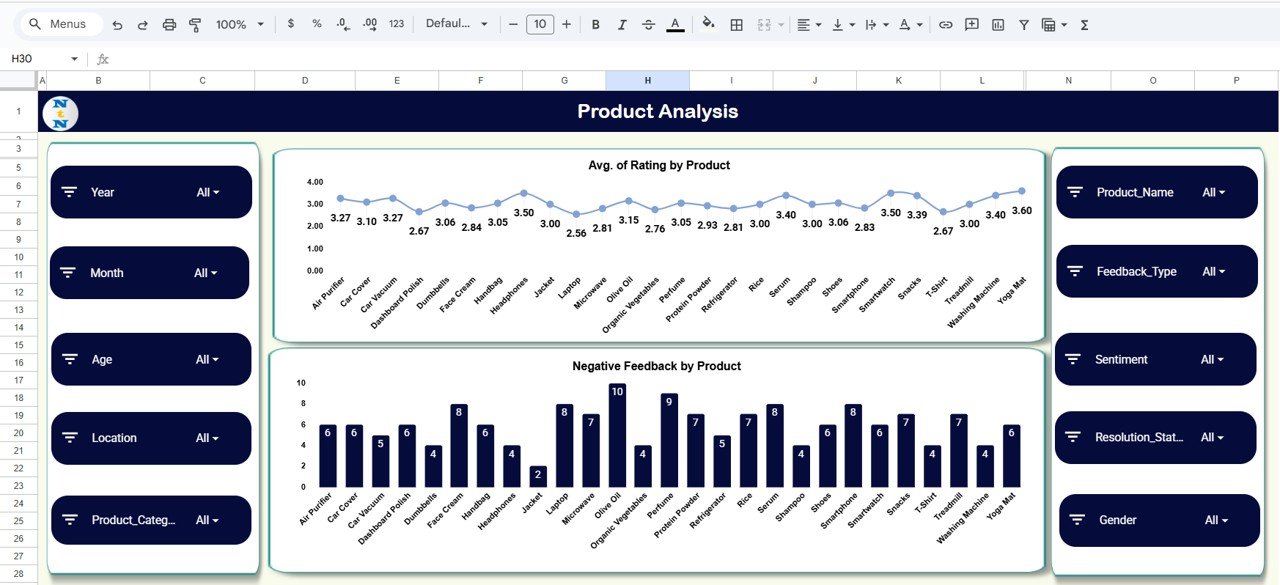
✨ Product Analysis – Improve Products With Data
The Product Analysis Section includes:
-
Average Rating by Product
-
Negative Feedback by Product
This makes it easy for product managers to identify problem products, evaluate quality performance, and prioritize improvements.
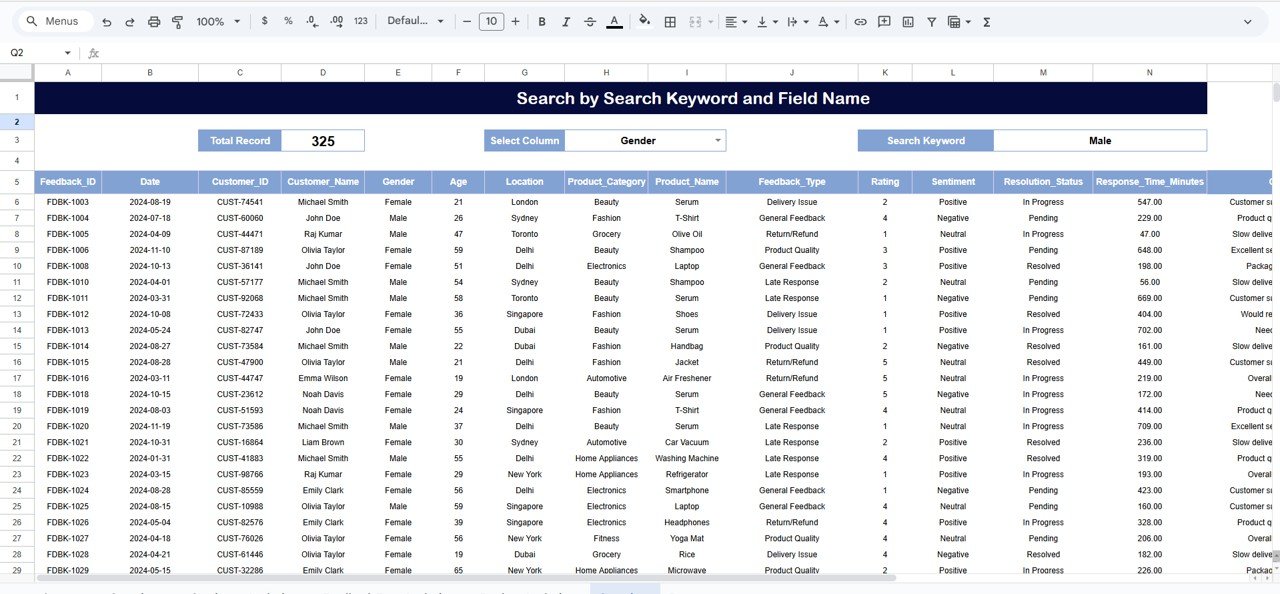
✨ Lightning-Fast Search System
The Search Sheet Tab helps you find customer comments instantly.
You can:
-
Search by any keyword
-
Filter by column
-
Locate feedback faster
-
Perform detailed customer audits
This feature is extremely useful for support teams dealing with escalations or investigation cases.
📦 What’s Inside the Customer Feedback Analysis Dashboard in Google Sheets
This template includes:
-
Automated KPI Cards
-
Product Category Analytics
-
Sentiment Analysis Section
-
Feedback Type Performance
-
Product Quality Analysis
-
Monthly Ratings & Trend Charts
-
Search Sheet (Advanced Filtering)
-
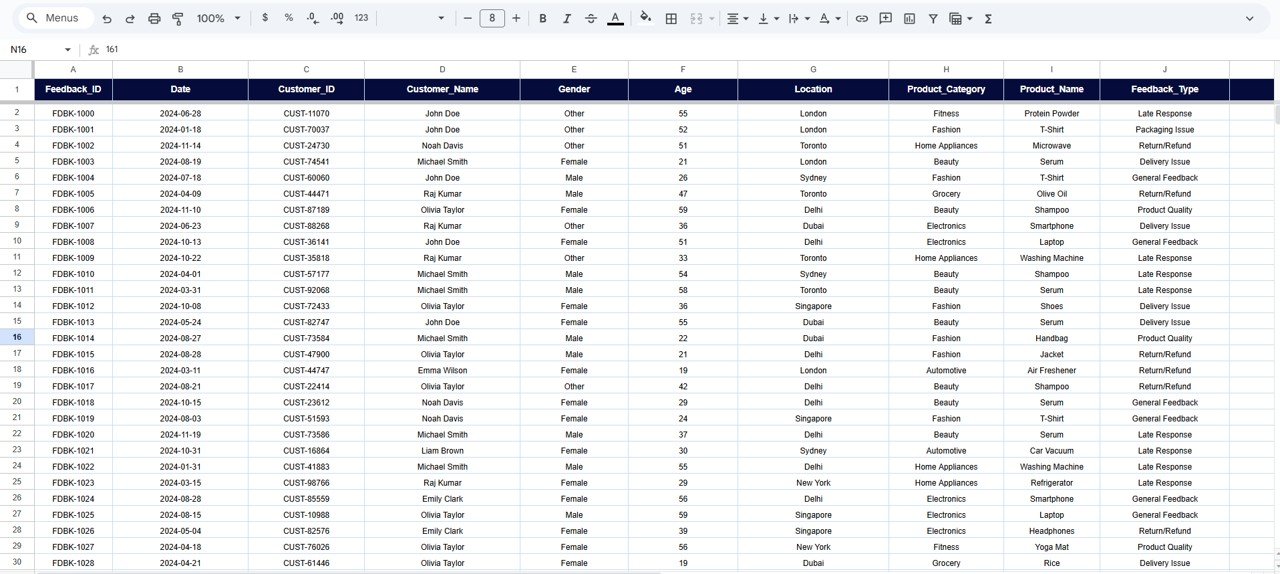
Data Sheet for Complete Feedback Storage
-
Clean, modern dashboard layout
-
Fully cloud-based functionality
Nothing to install, no formulas to build—everything works right out of the box.
🛠 How to Use the Customer Feedback Analysis Dashboard in Google Sheets
Using this dashboard is simple and intuitive:
- Step 1: Enter all feedback data into the Data Sheet
- Step 2: Update product, rating, category, sentiment, and resolution details
- Step 3: The dashboard updates automatically
- Step 4: Analyze sentiment, product categories, and feedback types
- Step 5: Use the search tab to find customer comments instantly
- Step 6: Share the dashboard with team members in real-time
- Because it is built in Google Sheets, teams can collaborate effortlessly from anywhere.
🎯 Who Can Benefit from This Customer Feedback Analysis Dashboard in Google Sheets
This dashboard is perfect for:
-
Customer support teams
-
Product managers
-
Quality assurance teams
-
Marketing & research teams
-
SMEs & startups
-
E-commerce stores
-
SaaS companies
-
Service centers
Anyone who wants to understand customer experience and improve product quality will find this tool extremely valuable.Customer Feedback Analysis Dashboard in Google Sheets
Click here to read the detailed blog post
Watch the step-by-step video Demo:


Reviews
There are no reviews yet.