The translation and localization industry is growing rapidly as businesses expand globally and rely on multilingual communication. Every day, translation agencies, localization teams, and global content departments handle multiple projects, target languages, industries, and payment methods. Because of this complexity, decision-makers need a clear and visual way to track performance. The Translation & Localization Dashboard in Power BI provides exactly that solution.
This ready-to-use Power BI dashboard helps teams analyze performance across languages, industries, projects, costs, revenues, proofreading activities, and monthly trends—all in one place. With automated visuals, slicers, and interactive insights, the dashboard turns raw translation data into meaningful business intelligence.
Let’s explore how this powerful reporting tool works and how it can transform translation operations.
🌍 What Is a Translation & Localization Dashboard in Power BI?
A Translation & Localization Dashboard in Power BI is a modern analytics solution designed for:
✔ Translation agencies
✔ Localization teams
✔ Freelance language service providers
✔ Global content teams
✔ BPO & LSP (Language Service Provider) companies
✔ Proofreading & editing teams
✔ Multilingual project managers
It helps users track the performance of:
• Revenue
• Translation cost
• Proofreading cost
• Profit margin
• Paid invoice percentage
• Client satisfaction
• Industry performance
• Project type performance
• Source & target language metrics
• Monthly financial trends
Instead of manually creating spreadsheets or static reports, this Power BI dashboard gives you automated intelligence that updates in seconds.
📊 Key Features of the Translation & Localization Dashboard in Power BI
The dashboard contains five insight-rich analytical pages, each supported by slicers that help users filter the data for deeper analysis.
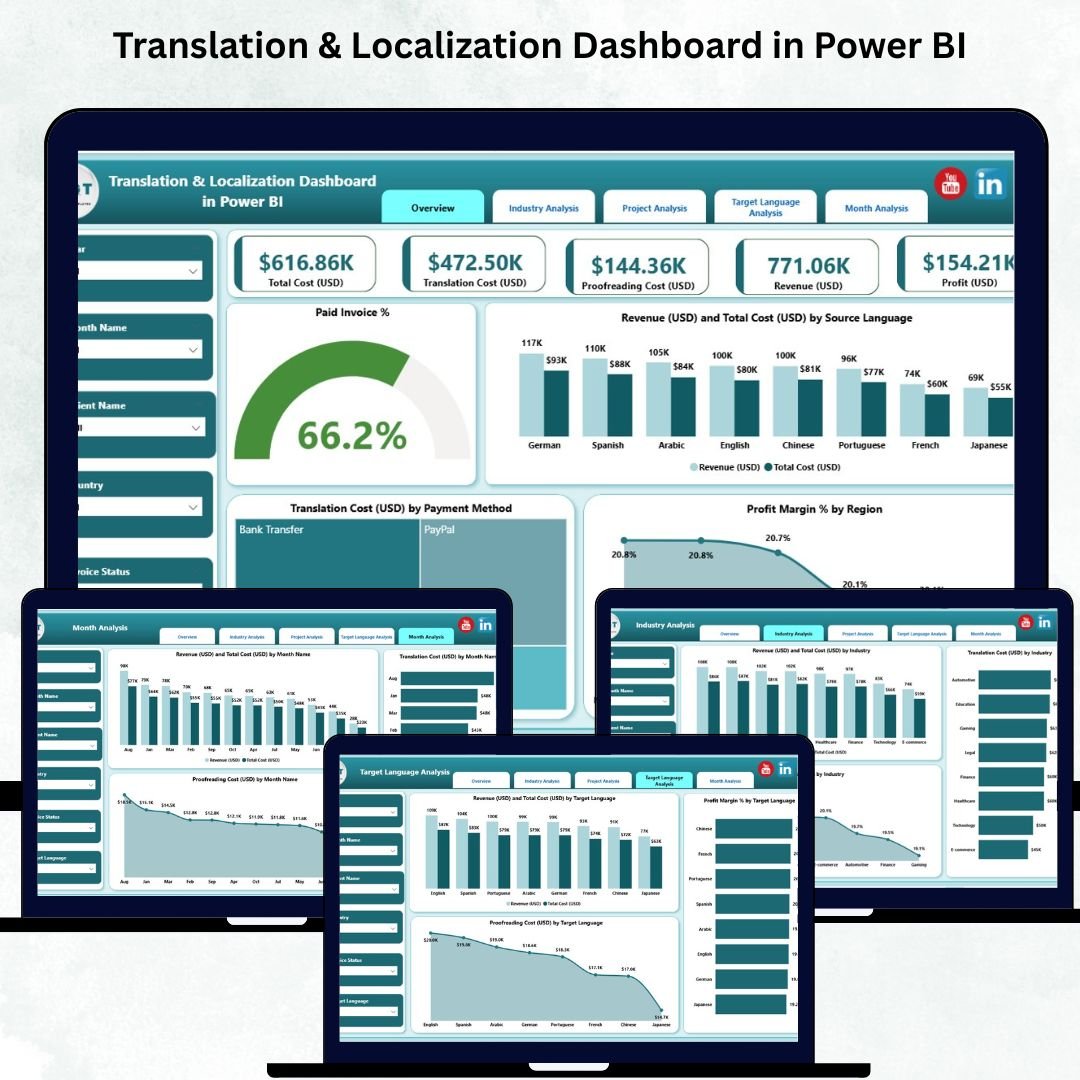
1️⃣ Overview Page – The Central Performance Hub
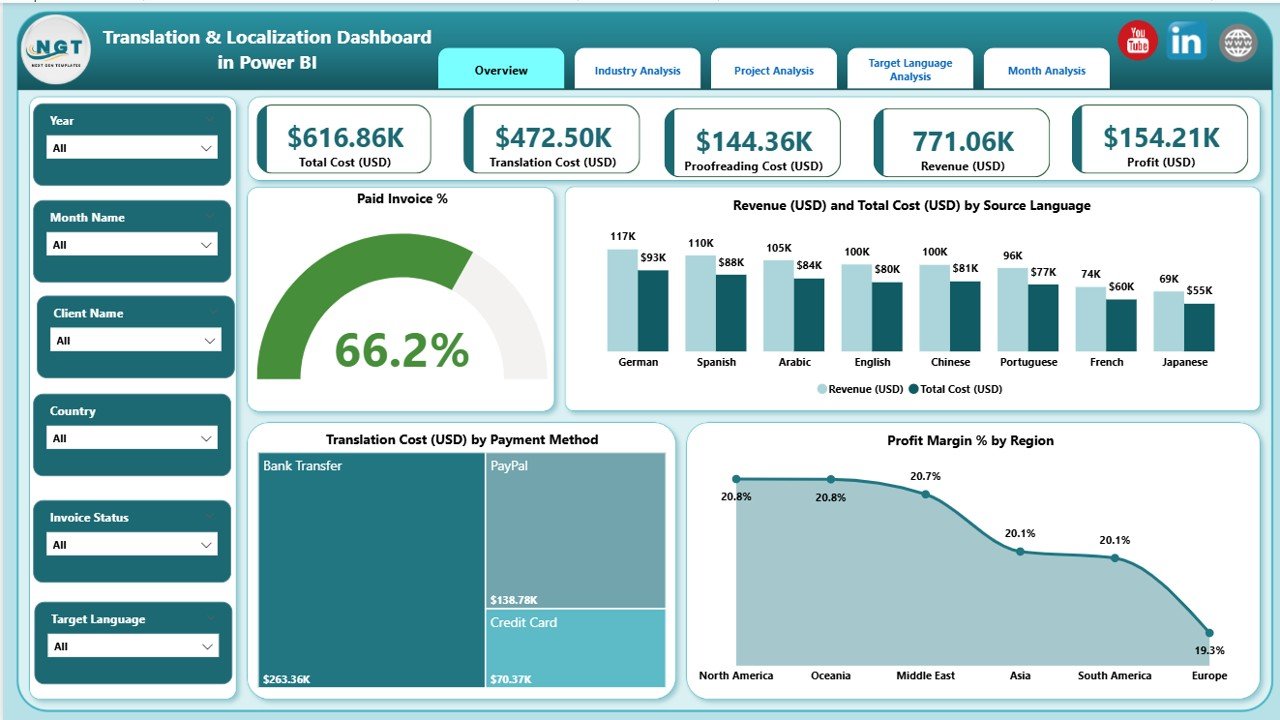
The Overview Page provides a complete snapshot of translation business performance. It includes:
✔ KPI Cards
• Paid Invoice %
• Revenue (USD)
• Total Cost (USD)
• Profit Margin %
These high-level KPIs help you evaluate financial health instantly.
✔ Charts on the Overview Page
The page includes four impactful visuals:
-
Paid Invoice %
-
Revenue (USD) & Total Cost (USD) by Source Language
-
Translation Cost (USD) by Payment Method
-
Profit Margin % by Region
This allows users to understand profitability by region, compare costs across payment methods, and analyze revenue behavior across source languages.
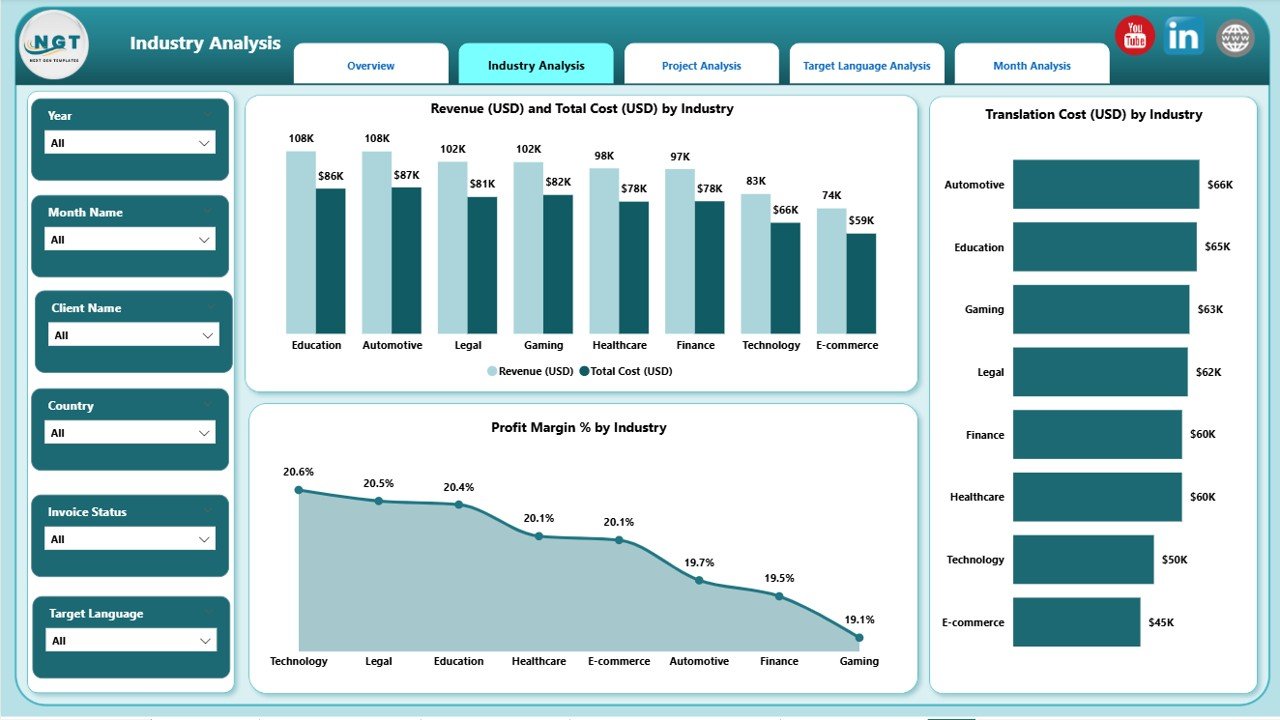
2️⃣ Industry Analysis – Track Performance Across Sectors
Different industries have unique translation requirements—legal, medical, technical, e-commerce, finance, and more. This page gives translation teams a detailed breakdown.
✔ Charts on Industry Analysis Page
• Revenue (USD) & Total Cost (USD) by Industry
• Translation Cost (USD) by Industry
• Profit Margin % by Industry
This helps users identify:
✔ Most profitable industries
✔ High-cost industries
✔ Sectors that need pricing adjustments
✔ Strong and weak-performing markets
It’s an essential page for agencies working with multiple sectors.
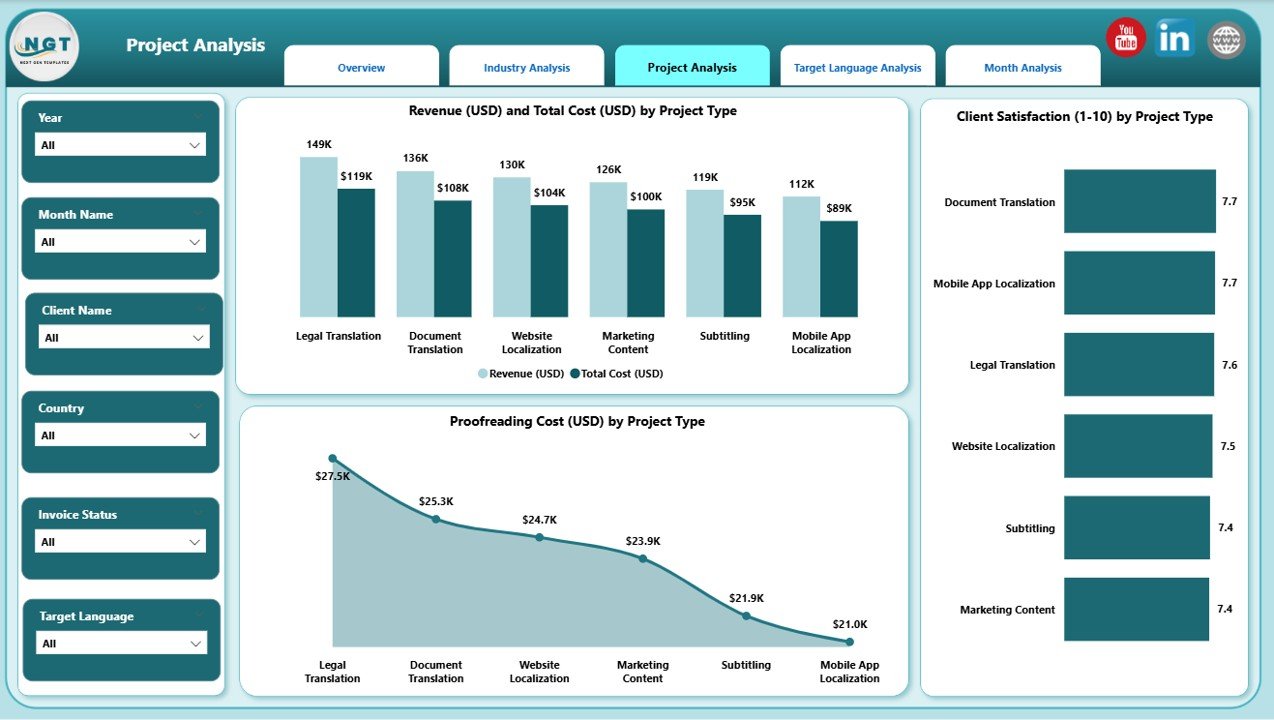
3️⃣ Project Analysis – Compare Project Types with Ease
Every translation agency manages various project types: document translation, website localization, software localization, technical manuals, marketing content, legal contracts, subtitles, and more.
This page highlights key metrics by project type.
✔ Charts in Project Analysis
• Revenue (USD) & Total Cost (USD) by Project Type
• Client Satisfaction by Project Type
• Proofreading Cost (USD) by Project Type
This helps agencies understand:
✔ Which project types generate more revenue
✔ Where profit declines
✔ Which project types need better workflows
✔ Where proofreading cost is higher
It improves project planning, pricing decisions, and resource allocation.
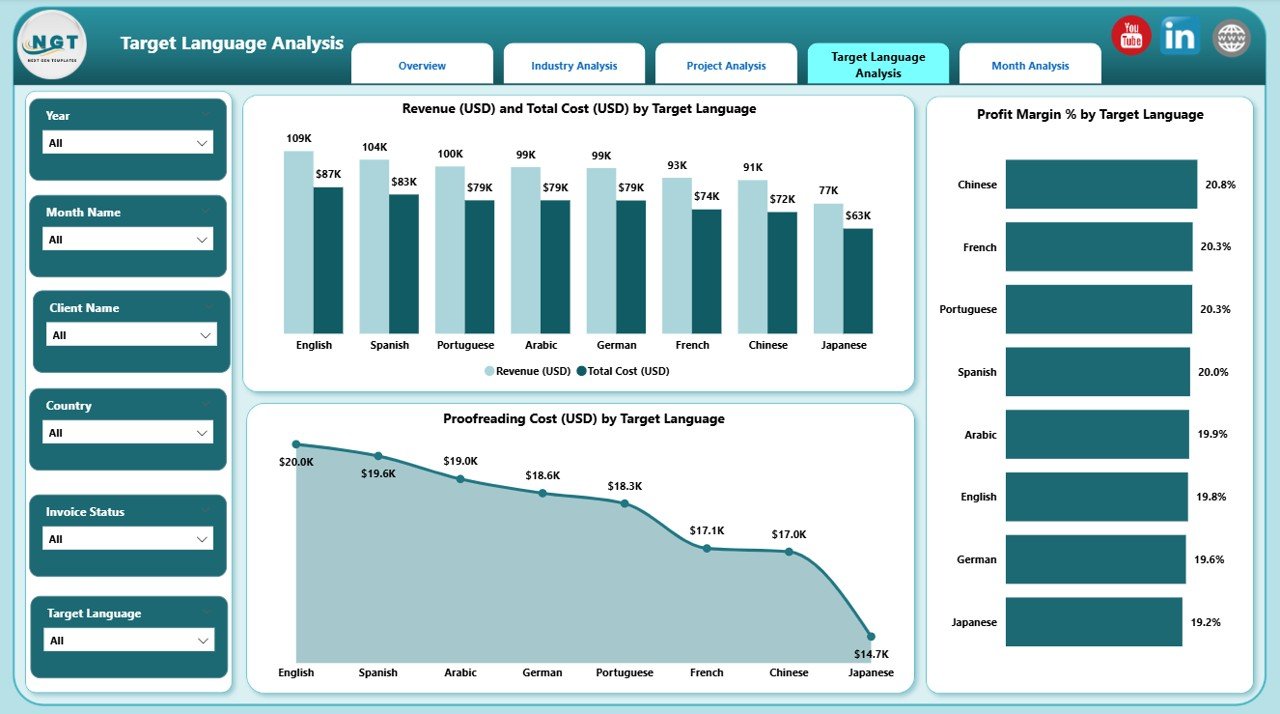
4️⃣ Target Language Analysis – Understand Target Language Profitability
Target languages determine workload, cost, translator expertise, and pricing. This page gives deep insights into target-language performance.
✔ Charts in Target Language Analysis
• Revenue (USD) & Total Cost (USD) by Target Language
• Profit Margin % by Target Language
• Proofreading Cost (USD) by Target Language
This helps teams identify:
✔ High-value target languages
✔ Languages with higher proofreading requirements
✔ Languages with lower profit margin
✔ Regional language demand trends
Perfect for multilingual operations and global content teams.
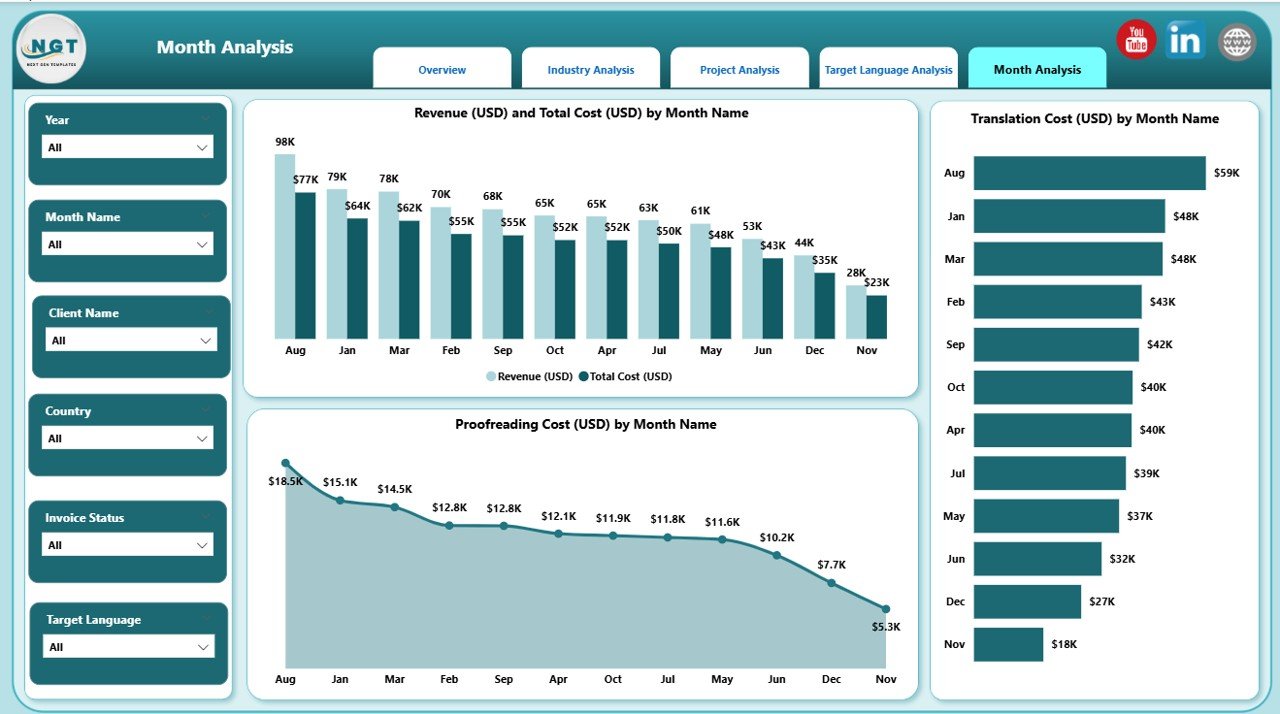
5️⃣ Monthly Trends – Understand Financial Changes Over Time
Translation demand often fluctuates based on release cycles, product launches, marketing campaigns, financial periods, and seasonal content needs.
The Monthly Trends Page includes:
• Revenue (USD) & Total Cost (USD) by Month
• Translation Cost (USD) by Month
• Proofreading Cost (USD) by Month
This helps users:
✔ Track month-over-month growth
✔ Understand seasonal translation patterns
✔ Compare expenses and profitability
✔ Improve forecasting and budgeting
🌟 Advantages of the Translation & Localization Dashboard in Power BI
✔ Real-time visibility into translation operations
✔ Better profitability tracking across languages, projects, and industries
✔ Data-based decision-making for pricing and outsourcing
✔ Improved client satisfaction by identifying performance gaps
✔ Accurate cost management for translation & proofreading
✔ Easy tracking of invoice, revenue, and payment metrics
✔ Enhanced planning for global localization strategies
✔ Fully automated reporting—no manual Excel reports needed
🧠 Best Practices to Use This Dashboard
✔ Refresh your data regularly
✔ Track high-cost languages and industries
✔ Compare profit margin across project types
✔ Use slicers to drill down into specific metrics
✔ Review monthly trends for financial planning
✔ Monitor proofreading cost to improve quality processes
📝 Conclusion
The Translation & Localization Dashboard in Power BI is the smartest way to manage multilingual translation performance. With five detailed analytical pages, interactive slicers, and automated visuals, this dashboard gives you a complete 360-degree view of your translation operations.
Whether you manage a small translation agency or a large global localization team, this dashboard helps you make faster decisions, improve profit margins, and deliver higher-quality work.
🔗 Click here to read the Detailed blog post
Visit our YouTube channel to learn step-by-step video tutorials


Reviews
There are no reviews yet.