

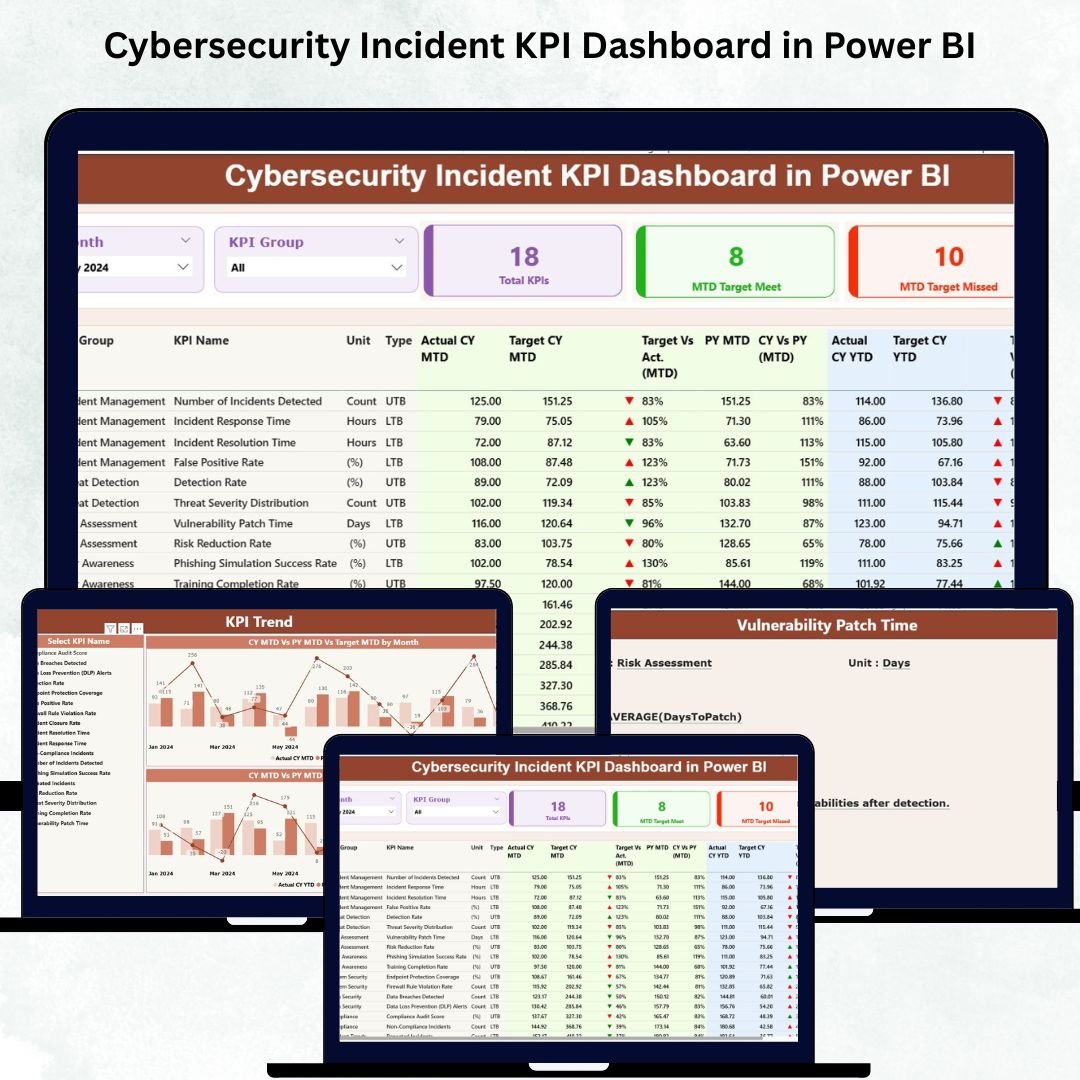
A fast-changing cyber environment requires organizations to monitor performance with precision. Security incidents continue to grow, and teams must detect threats quickly, respond efficiently, and maintain compliance. Without a centralized view, cybersecurity leaders rely on scattered reports, making decision-making slow and unclear.
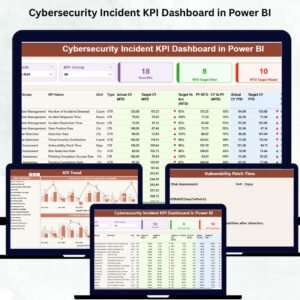
The Cybersecurity Incident KPI Dashboard in Power BI solves this challenge. It converts your Excel-based security data into clean, interactive, and real-time visuals that highlight the health of your security operations. Whether you manage SOC teams, monitor vulnerabilities, or track incident response KPIs, this dashboard offers everything you need in one place.
This ready-to-use Power BI dashboard helps IT leaders, cybersecurity analysts, SOC managers, auditors, and CISOs gain complete visibility across Month-to-Date (MTD) and Year-to-Date (YTD) performance.
⭐ Key Features of the Cybersecurity Incident KPI Dashboard in Power BI
1️⃣ Summary Page – Your Main Security Health View
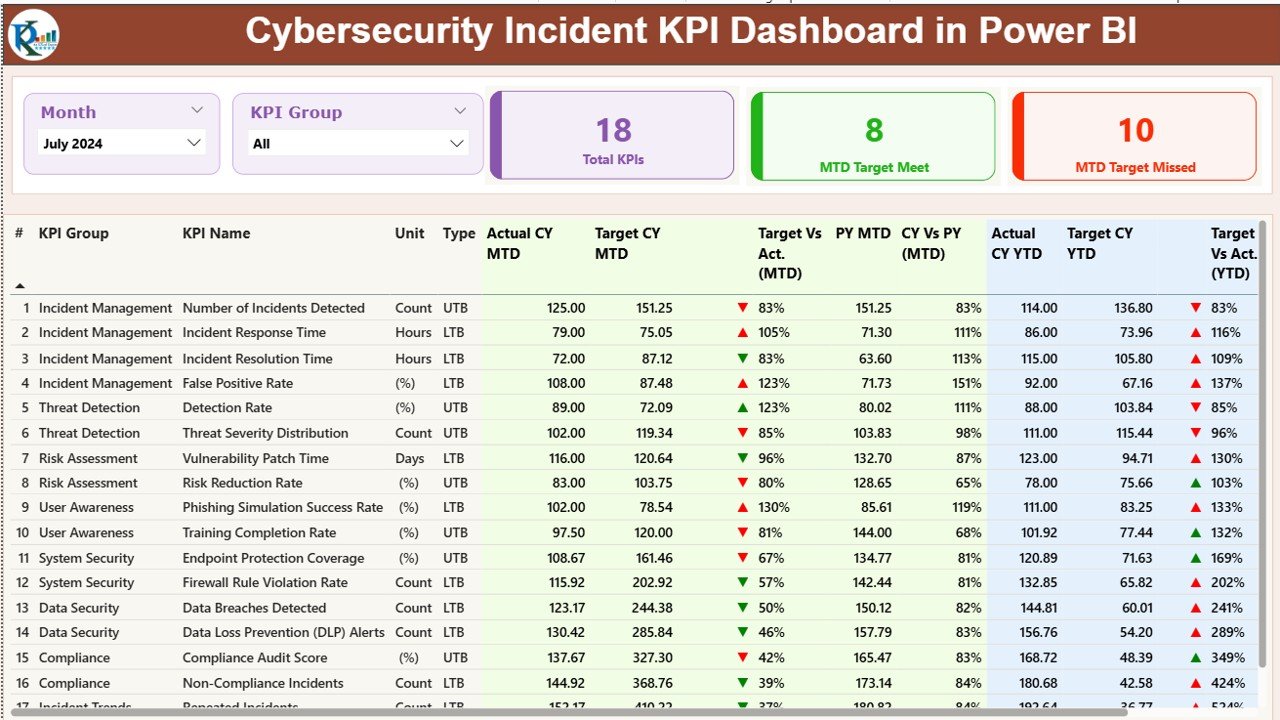
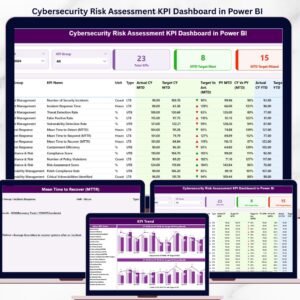
The Summary Page works as the central command center of the dashboard. A Month slicer and KPI Group slicer allow full control and filtering flexibility.
You will find three KPI cards at the top:
-
Total KPI Count
-
MTD Target Met
-
MTD Target Missed
Below these, a detailed KPI table displays:
-
KPI Number
-
KPI Group
-
KPI Name
-
Unit
-
Type (UTB / LTB)
-
Actual CY MTD Vs Target CY MTD
-
MTD Icons (▲ good performance / ▼ poor performance)
-
Previous Year MTD Comparison
-
Actual CY YTD Vs Target CY YTD
-
YTD Icons
-
Previous Year YTD Comparison
Every KPI is highlighted visually so managers instantly understand where attention is needed.
2️⃣ KPI Trend Page – Visualizing Performance Over Time
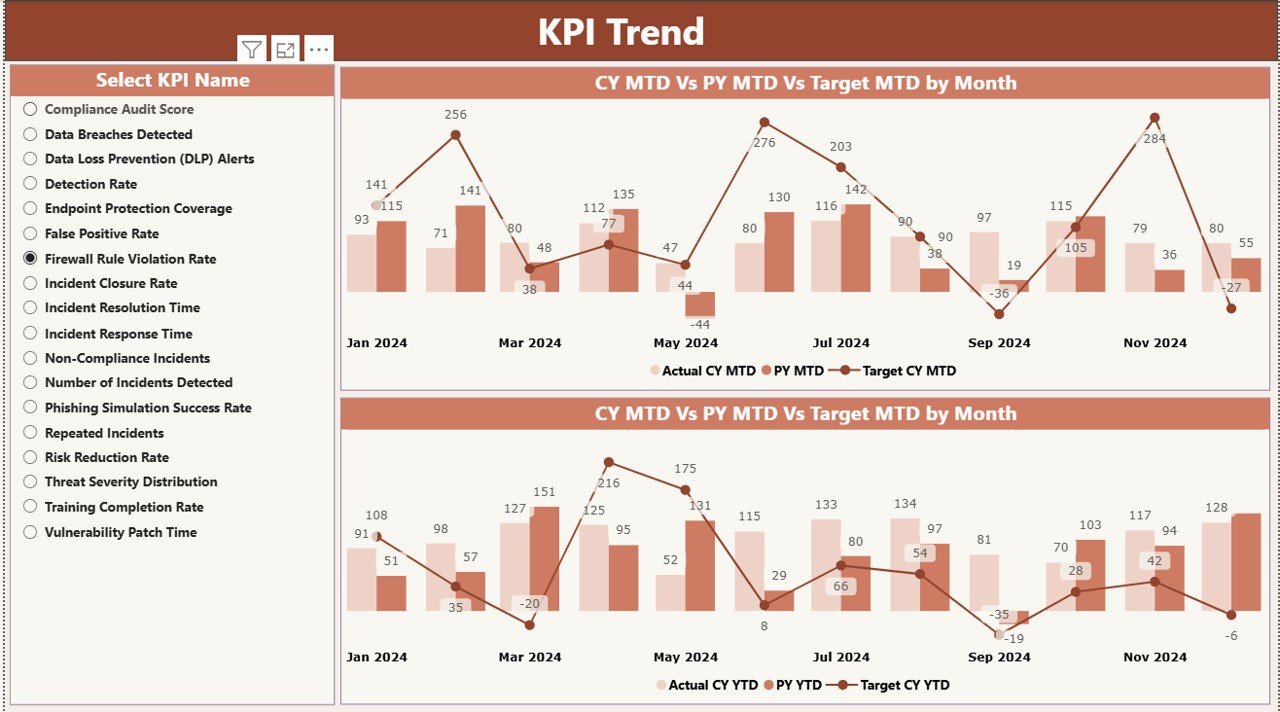
This page includes a KPI Name slicer and two Combo Charts:
-
Chart 1: Current Year vs Previous Year vs Target (MTD)
-
Chart 2: Current Year vs Previous Year vs Target (YTD)
These charts help identify:
✔ Threat patterns
✔ Detection speed trends
✔ Resolution improvements
✔ Seasonal threat behavior
It gives teams a clear month-by-month performance view.
3️⃣ KPI Definition Page – Understanding How KPIs Work
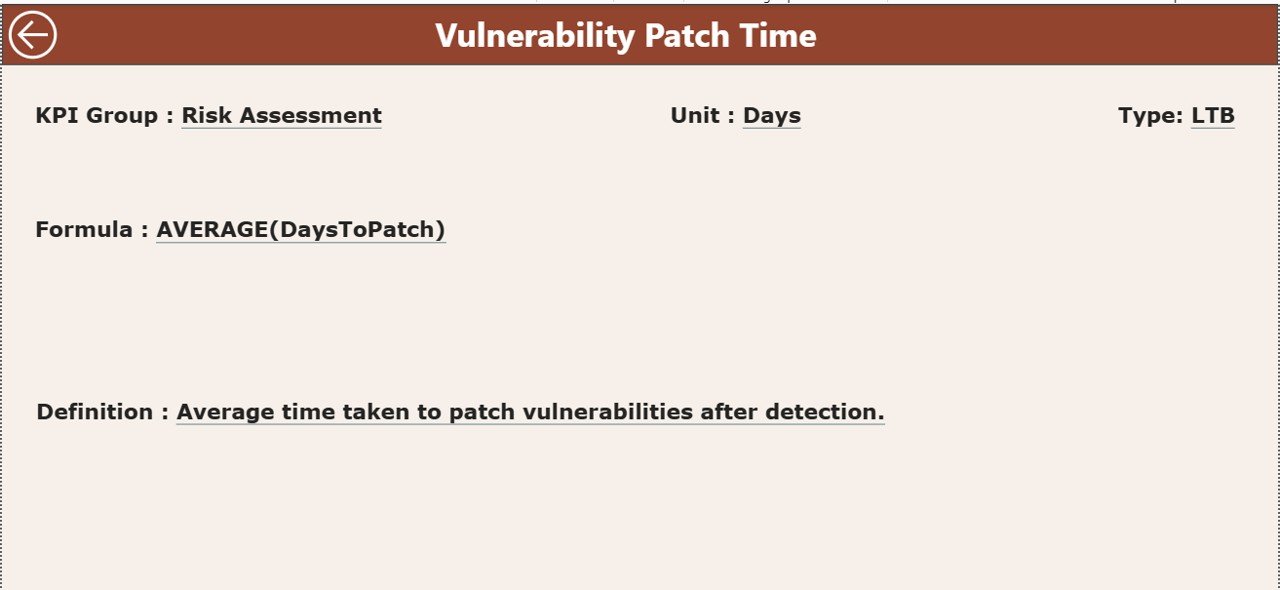
This hidden drill-through page provides full clarity for every KPI:
-
KPI Number
-
KPI Group
-
Unit
-
KPI Definition
-
Formula
-
Type (UTB or LTB)
Users simply right-click any KPI in the Summary Page to open its definition. A back button brings them back instantly.
📂 Excel-Based Input Data Structure
This dashboard runs on a clean and simple Excel file that includes three sheets:
✔ Input_Actual Sheet
-
KPI Name
-
Month (1st day of month)
-
Actual MTD
-
Actual YTD
✔ Input_Target Sheet
-
KPI Name
-
Month
-
Target MTD
-
Target YTD
✔ KPI Definition Sheet
-
KPI Number
-
KPI Group
-
KPI Name
-
Unit
-
Formula
-
Definition
-
Type (UTB / LTB)
Updating these sheets refreshes the entire dashboard instantly.
🔐 Why Organizations Need This Cybersecurity Dashboard
-
Cyber threats evolve rapidly
-
Manual reports slow down security decisions
-
KPIs must be tracked accurately for compliance
-
Security teams require real-time performance signals
This dashboard provides the immediate visibility that cyber leaders need to operate efficiently and safely.
⭐ Advantages of the Cybersecurity Incident KPI Dashboard
-
🛡 Real-time incident visibility
-
⚡ Faster decision-making
-
🔁 Clear MTD & YTD comparisons
-
✔ PY (Previous Year) performance visibility
-
📊 Trend monitoring for long-term improvement
-
🔍 Full KPI transparency
-
📈 Support for audits, compliance, and reporting
-
🧩 Easy Excel updates—no technical skills required
-
🔄 Automated Power BI refresh
-
📱 Mobile-friendly views
🧠 Best Practices
-
Update MTD & YTD data monthly
-
Use slicers for deep insights
-
Compare CY vs PY regularly
-
Investigate all ▼ red icons immediately
-
Keep KPI definitions updated
-
Validate data accuracy before refresh
-
Share reports with SOC teams & management
🎯 Who Should Use This Dashboard?
-
SOC Teams
-
Cybersecurity Analysts
-
IT Managers
-
CISOs
-
Risk & Compliance Teams
-
ISMS Auditors
-
Incident Response Teams
🔚 Conclusion
A Cybersecurity Incident KPI Dashboard in Power BI gives organizations a structured and powerful way to monitor incidents, track risk levels, measure response efficiency, and compare performance with targets. With its interactive pages—Summary, KPI Trends, and KPI Definitions—security leaders gain complete clarity and real-time visibility. This helps them strengthen their security posture, reduce risk, and respond faster to threats.
This dashboard is a must-have tool for any organization that wants to stay secure, compliant, and proactive in a world of evolving cyber threats.
🔗 Click here to read the Detailed blog post
Visit our YouTube channel to learn step-by-step video tutorials














Reviews
There are no reviews yet.