

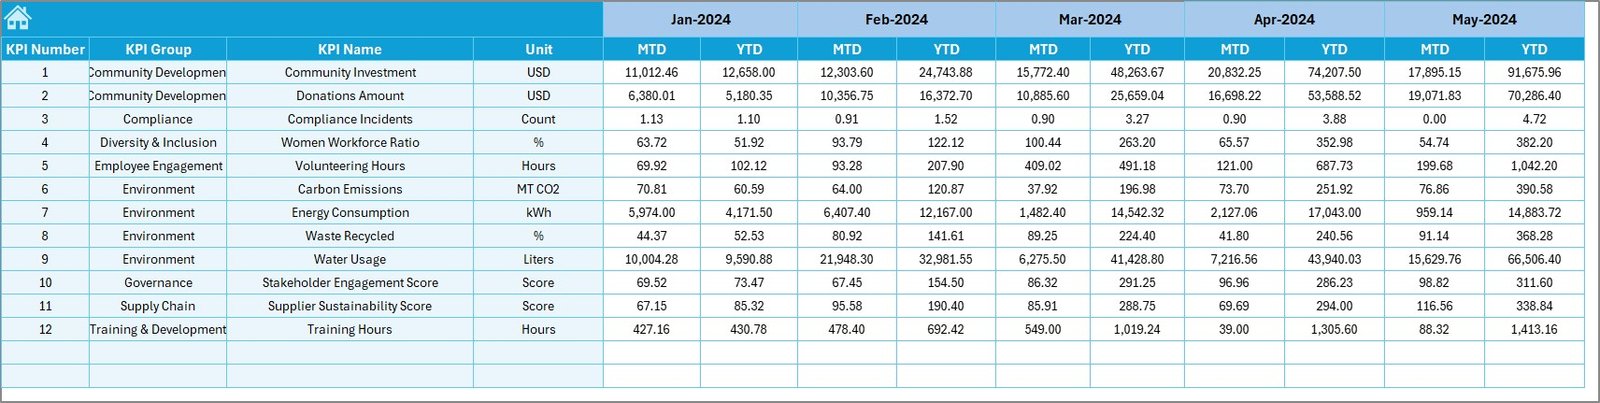



Managing Corporate Social Responsibility (CSR) performance is no longer optional—it’s a necessity for every modern organization that values sustainability, ethical practices, and community impact. If you want to track CSR metrics effortlessly, improve reporting quality, and make smarter decisions, the Corporate Social Responsibility (CSR) KPI Dashboard in Excel is the perfect tool for you. This ready-to-use Excel dashboard transforms raw CSR data into clear visual insights, helping teams measure performance month-by-month and year-to-date with complete accuracy and confidence.
This powerful dashboard gives you one integrated platform to monitor CSR performance across environmental, social, and governance indicators. With interactive charts, automated comparisons, and intuitive navigation, your team gets complete clarity on achievements, gaps, trends, and improvement opportunities. Whether you’re a CSR manager, sustainability head, or part of the leadership team, this template makes CSR tracking effortless and impactful.
✨ Key Features of the Corporate Social Responsibility (CSR) KPI Dashboard in Excel
📊 Fully Automated CSR Insights
The dashboard updates instantly based on the selected month, giving you real-time CSR performance.
📅 MTD & YTD Tracking
Monitor Month-to-Date and Year-to-Date performance for every CSR KPI with just one click.
🎯 Actual vs Target Comparison
Quickly see where you are meeting targets and where improvement is needed.
📈 Current Year vs Previous Year Performance
Understand long-term progress using year-on-year comparisons.
📌 Easy Navigation with Summary Page
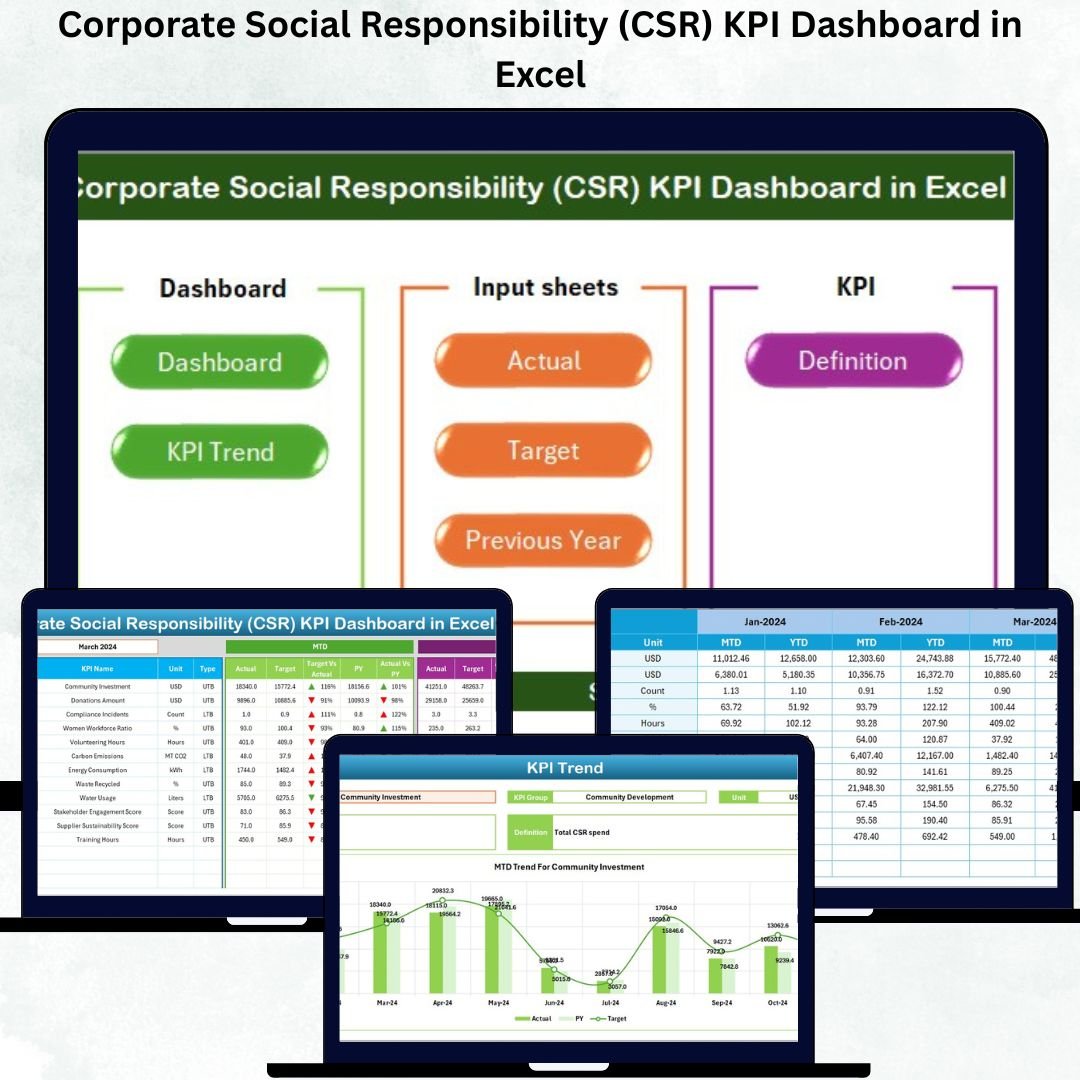
Jump to any worksheet—Dashboard, Trend, Inputs, Targets, or Definitions—with dedicated button controls.
📉 Trend Visualization
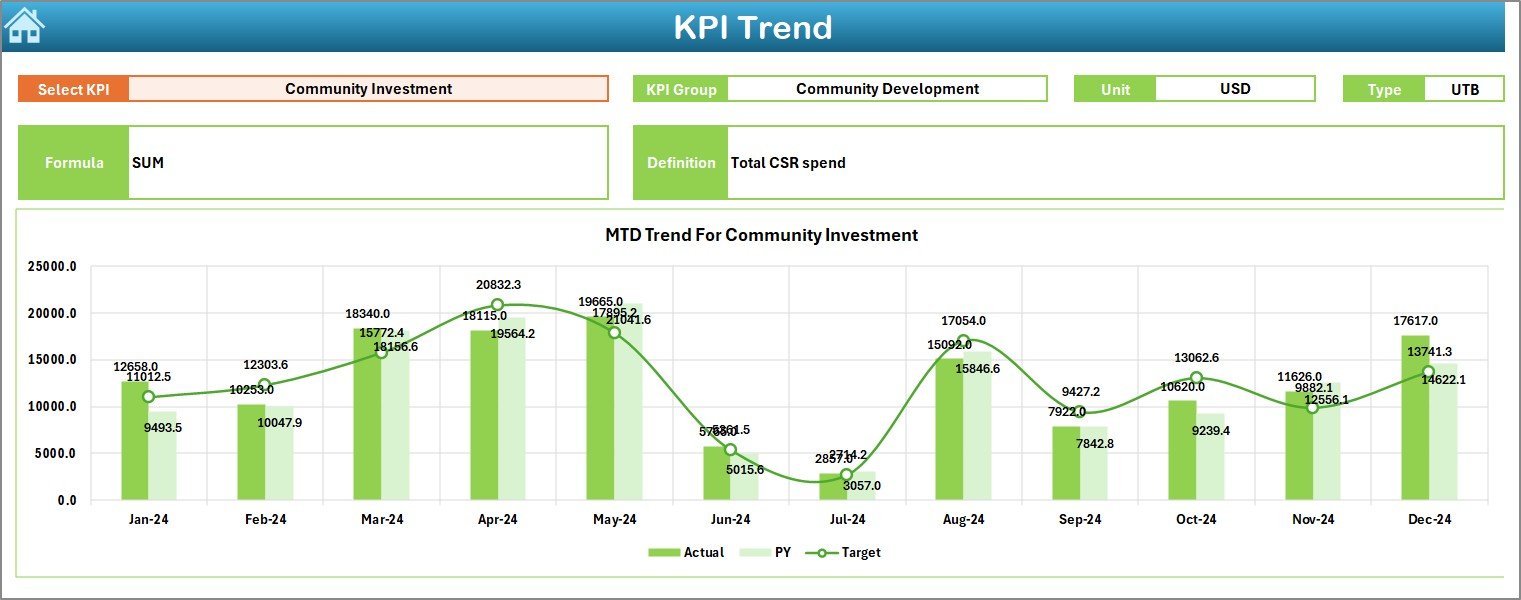
Analyze KPI trends using interactive charts for Actual, Target, and Previous Year values.
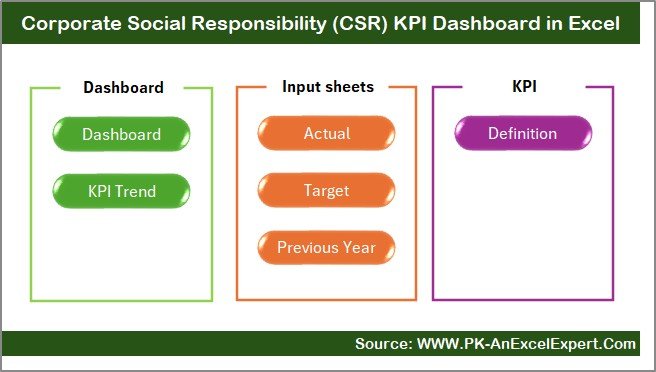
📂 What’s Inside the CSR KPI Dashboard in Excel
This dashboard includes 7 smartly designed worksheets, each created to simplify CSR reporting:
1️⃣ Summary Page
A central navigation hub with buttons to visit all key sections.
2️⃣ Dashboard Sheet
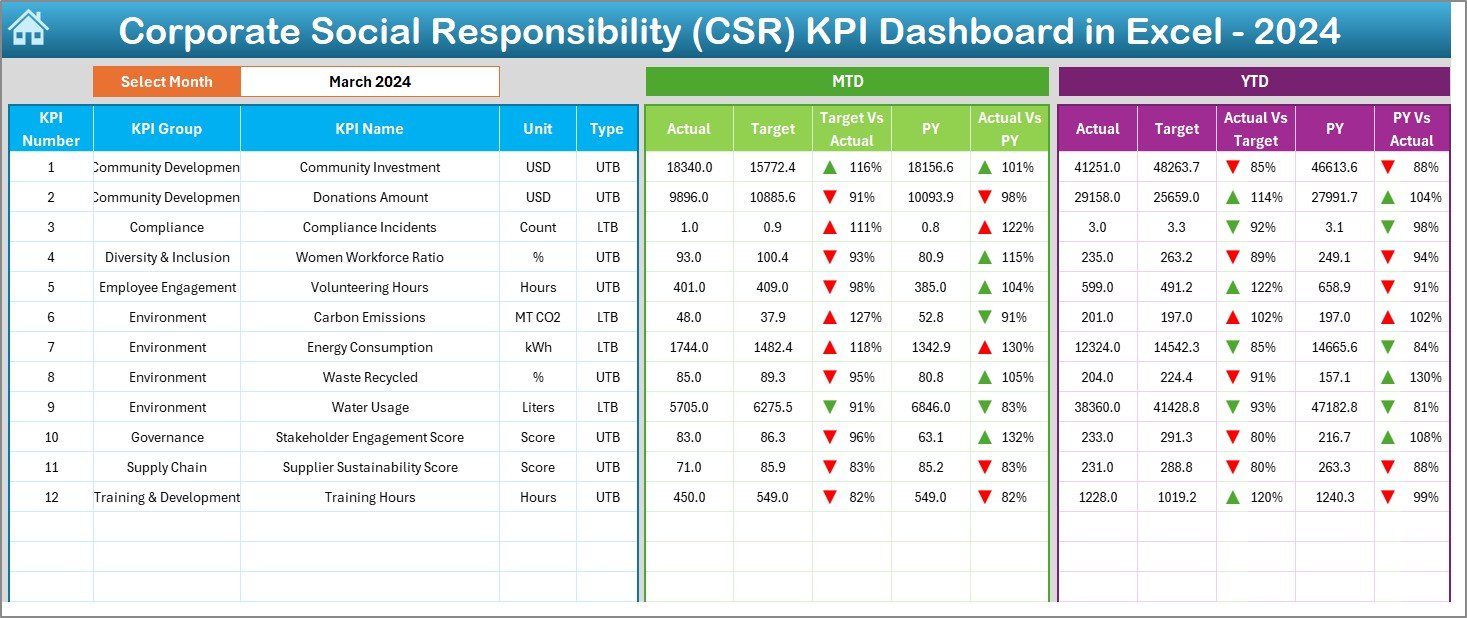
A visually rich page showing MTD, YTD, PY comparisons, and trend arrows (↑ ↓ →) for instant performance evaluation.
3️⃣ Trend Sheet
Select any KPI and view its formula, definition, type, and trend charts.
4️⃣ Actual Numbers Input
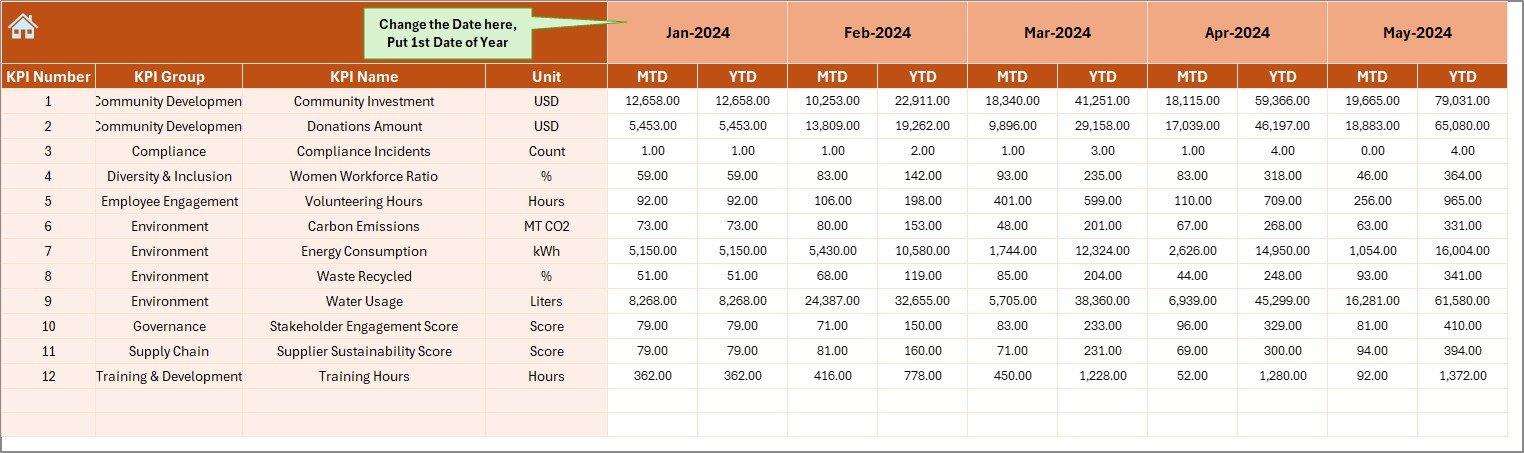
Enter all monthly CSR performance values in a clean structured format.
5️⃣ Target Sheet
Set monthly MTD and YTD CSR targets for each KPI.
6️⃣ Previous Year Sheet
Store last year’s CSR results to compare performance improvements.
7️⃣ KPI Definition Sheet
Your CSR knowledge library—listing KPI names, formulas, units, groups, and definitions.
📝 How to Use the CSR KPI Dashboard in Excel
🔹 Step 1: Enter Actual Data
Go to the “Actual Numbers Input” sheet and update MTD and YTD values each month.
🔹 Step 2: Update Targets
Use the “Target Sheet” to define your monthly CSR expectations.
🔹 Step 3: Add Last Year’s Values
Enter previous year numbers to automatically enable year-on-year comparisons.
🔹 Step 4: Select a Month
Use the dropdown on the Dashboard to switch between months and analyze performance instantly.
🔹 Step 5: Use Trend Sheet for Deep Analysis
Choose a KPI to view complete details and performance charts.
🔹 Step 6: Share Reports Easily
Export charts or screenshots for management review, sustainability reports, or board presentations.
👥 Who Can Benefit from This CSR KPI Dashboard
🏢 CSR Managers & Sustainability Leaders
Get complete visibility into CSR program performance.
👩💼 HR & Employee Welfare Teams
Track training hours, wellness activities, and social impact engagements.
📈 Finance & Compliance Teams
Monitor governance practices, ethical sourcing, and audit scores.
🏭 Operations & Facility Managers
Analyze environmental KPIs such as emissions, waste, and conservation metrics.
🧑💼 Senior Leadership & Stakeholders
Gain clear insights into sustainability achievements and areas needing improvement.
This dashboard supports every department involved in CSR initiatives—making it a must-have tool for transparent reporting and strategic planning.
Click here to read the Detailed blog post
Watch the step-by-step video tutorial:
Visit our YouTube channel to learn step-by-step video tutorials
Compatibility and Requirements
- Works in Microsoft Excel desktop (Excel 2016 or later, or Microsoft 365).
- You pick the month from a dropdown on the Dashboard sheet. Microsoft explains dropdowns in Create a drop-down list.
Frequently Asked Questions
Which worksheets are included?
Seven worksheets: Summary Page, Dashboard, Trend, Actual Numbers Input, Target, Previous Year and KPI Definition.
How do I update the dashboard each month?
Enter your MTD and YTD values in the Actual Numbers Input sheet and your goals in the Target sheet. Then select the month from the dropdown on the Dashboard sheet and it updates.
Can I compare this year with last year?
Yes. Enter last year’s CSR results in the Previous Year sheet and the Dashboard shows them next to your actuals and targets, with trend arrows.
How do I look at one KPI in detail?
Open the Trend sheet and select a KPI. It shows the formula, definition and type, plus trend charts for Actual, Target and Previous Year values.
Is there a Power BI or Google Sheets version?
Yes. See the Corporate Social Responsibility (CSR) KPI Dashboard in Power BI and the Corporate Social Responsibility KPI Dashboard in Google Sheets.
Related CSR Templates
- Corporate Social Responsibility (CSR) KPI Dashboard in Power BI: the same KPIs in Power BI
- Corporate Social Responsibility KPI Dashboard in Google Sheets: the Google Sheets edition
- Corporate Social Responsibility Dashboard in Excel: another CSR dashboard layout in Excel
- Corporate Social Responsibility Report in Excel: a report view for CSR results
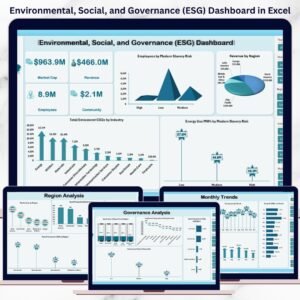
- Environmental, Social, and Governance (ESG) Dashboard in Excel: an ESG view of your metrics
Browse all Excel KPI dashboards.






Reviews
There are no reviews yet.