

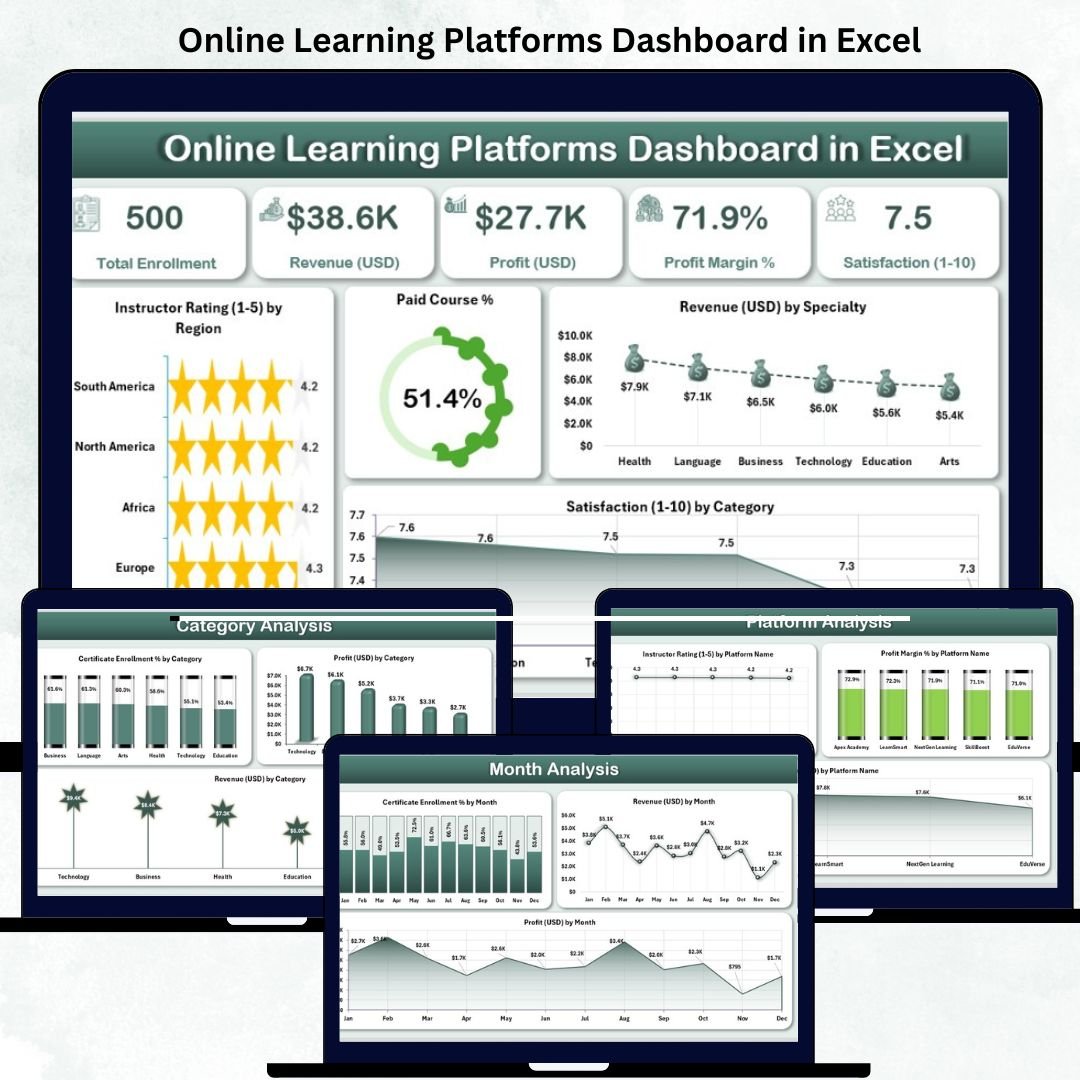

In the fast-growing digital education landscape, success depends on understanding data — enrollments, instructor performance, learner satisfaction, and revenue. The Online Learning Platforms Dashboard in Excel turns this overwhelming data into clear, actionable insights, all within the familiar Microsoft Excel environment. 📊
This ready-to-use dashboard empowers e-learning companies, course creators, and educational institutions to monitor performance, optimize profitability, and improve learner experiences through automated visuals, dynamic slicers, and insightful KPIs.
🌟 Key Features of the Online Learning Platforms Dashboard in Excel
🏠 1️⃣ Overview Page – Central Performance Snapshot
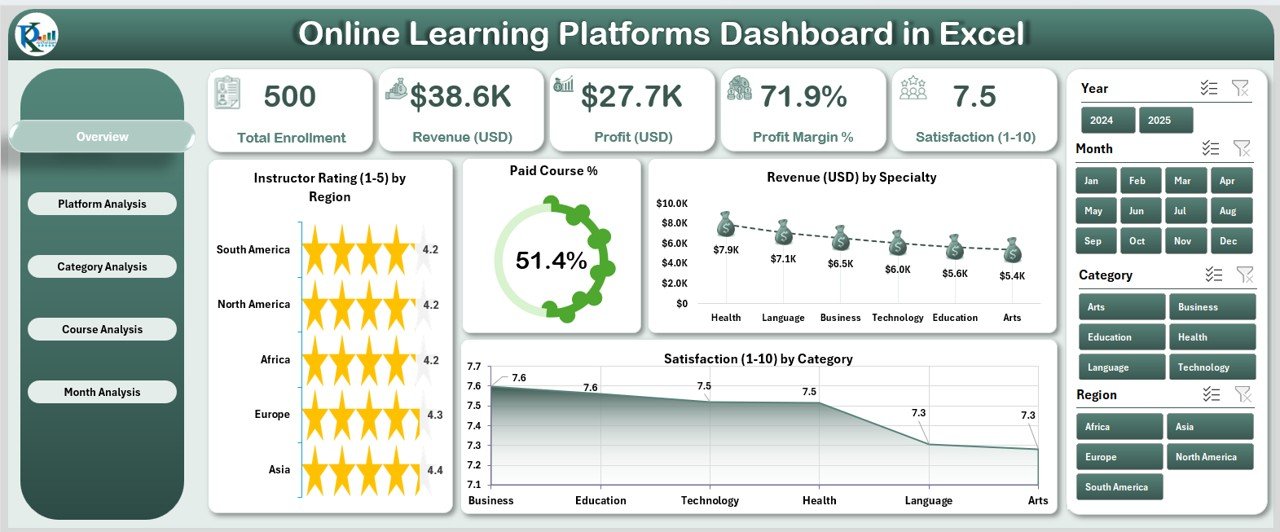
Your main control center for tracking e-learning metrics.
Includes:
🎯 Slicers on the right for easy filtering by Time, Platform, or Category.
💡 Five KPI Cards:
Total Revenue (USD)
Paid Course %
Instructor Rating
Certificate Enrolment Rate
Satisfaction Score
📊 Charts: Instructor Rating by Region, Paid Course %, Revenue by Specialty, and Satisfaction by Category.
💬 Purpose: Quickly identify top-performing courses, regions, and instructors at a glance.
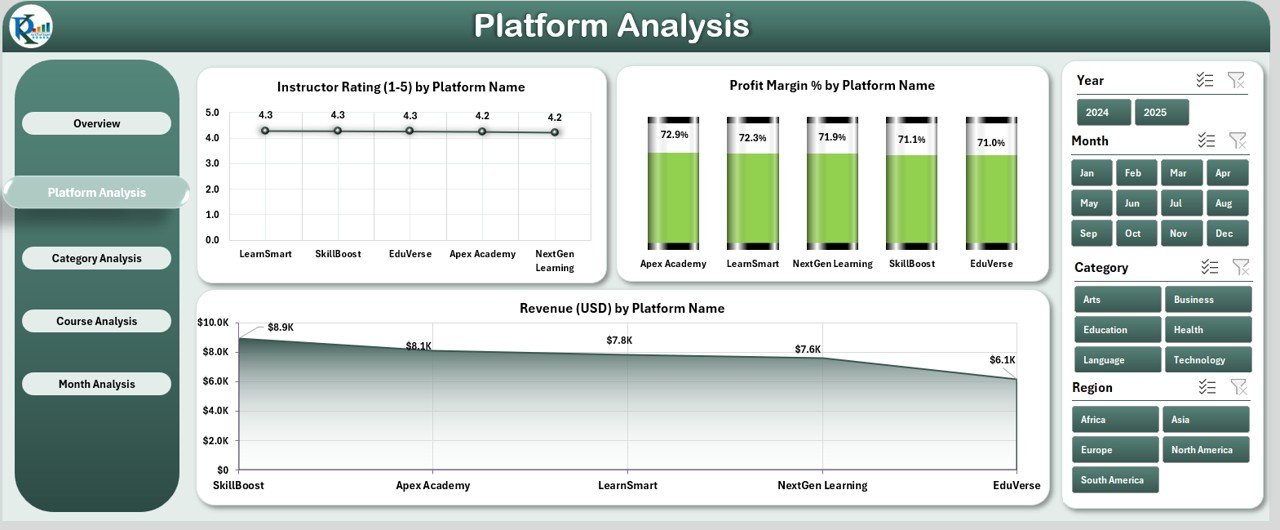
💻 2️⃣ Platform Analysis Page – Platform-Wise Comparison
Analyze how each learning platform contributes to business growth.
Visuals Include:
Instructor Rating by Platform
Profit Margin % by Platform
Revenue (USD) by Platform
📈 Outcome: Discover which platforms deliver the highest ROI and where to improve marketing or content strategies.
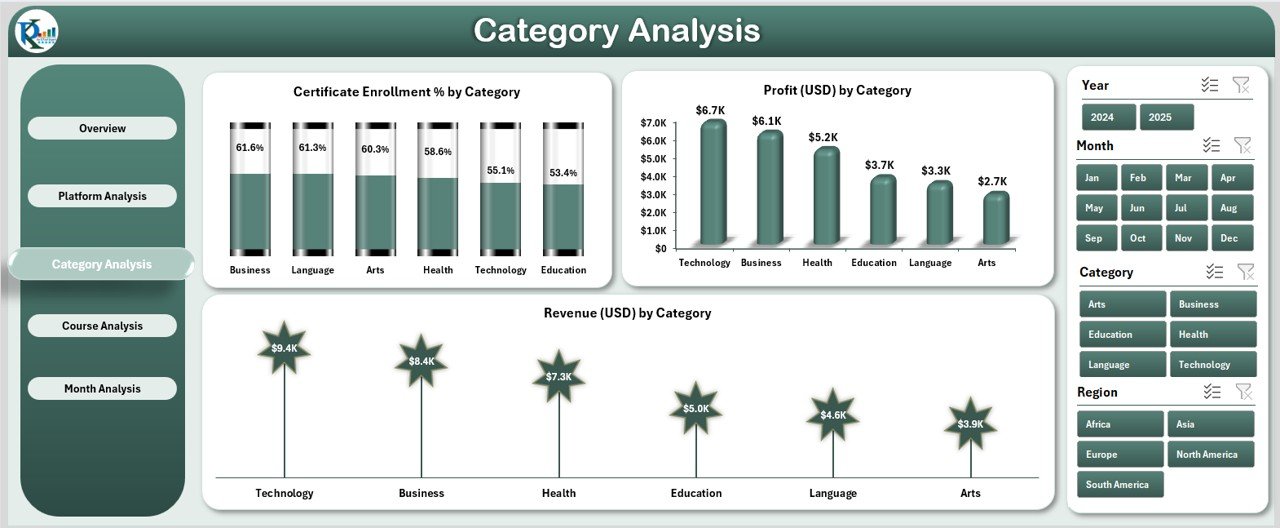
📚 3️⃣ Category Analysis Page – Subject Performance Insights
Evaluate how different learning categories perform in terms of enrolment, profit, and revenue.
Charts Include:
Certificate Enrolment % by Category
Profit (USD) by Category
Revenue (USD) by Category
💡 Purpose: Pinpoint high-demand subjects and allocate resources effectively.
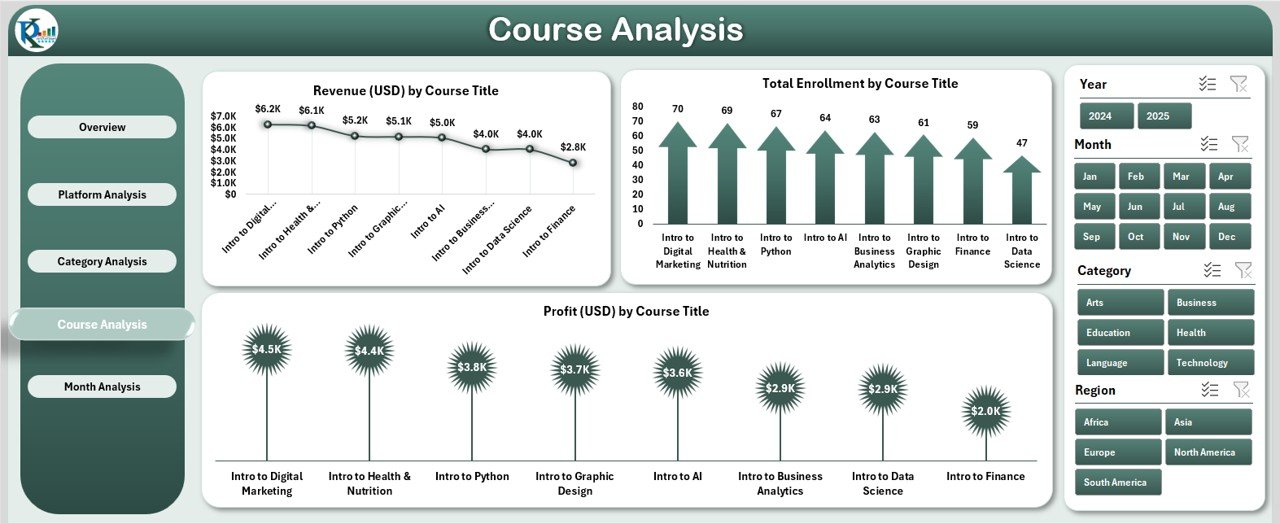
🎓 4️⃣ Course Analysis Page – Individual Course Breakdown
Track performance metrics at the course level.
Charts Displayed:
Revenue (USD) by Course Title
Total Enrolment by Course Title
Profit (USD) by Course Title
📊 Outcome: Identify which courses generate the most income, the highest enrollments, and the best margins.
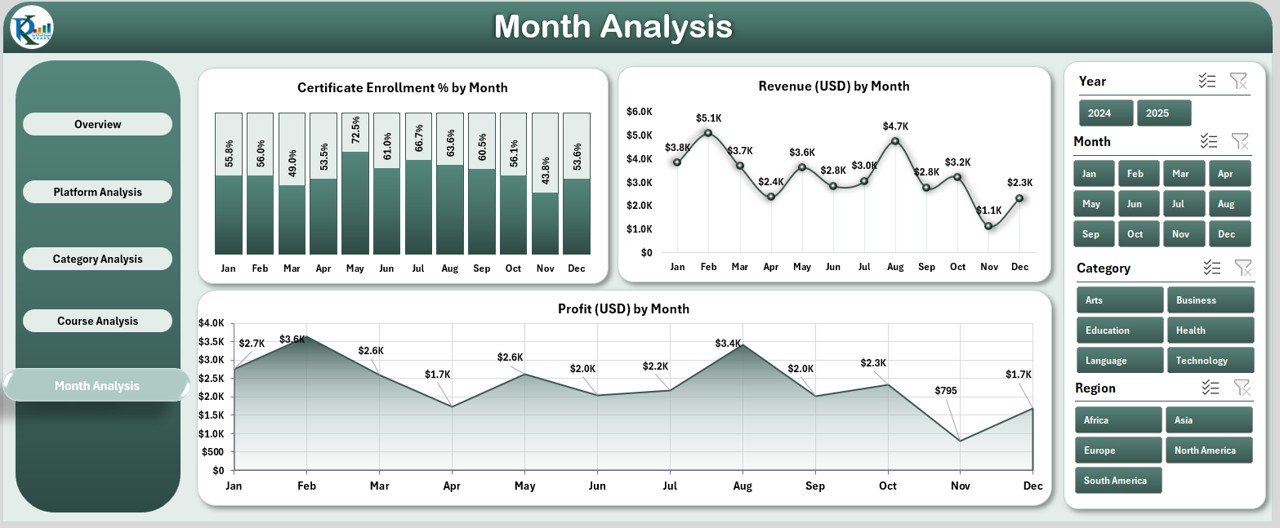
📅 5️⃣ Month Analysis Page – Time-Based Trends
Monitor growth and seasonality over time.
Charts Include:
Certificate Enrolment % by Month
Revenue (USD) by Month
Profit (USD) by Month
🧭 Benefit: Analyze seasonal trends, measure marketing effectiveness, and forecast upcoming performance.
⚙️ Support & Data Sheets
📑 Support Sheet: Backend automation logic for slicers, lookups, and chart interactivity.
📊 Data Sheet: Stores raw data such as course titles, platform names, ratings, and profits — the foundation of all analytics.
💼 Advantages of the Online Learning Platforms Dashboard
✅ Centralized Data Analysis: All metrics in one file — no more switching between multiple reports.
✅ Real-Time Insights: Charts and KPIs auto-update as data changes.
✅ Fully Customizable: Add KPIs like Completion Rate or Refund Rate.
✅ Cost-Effective: Excel-based analytics—no complex software required.
✅ Enhanced Decision-Making: Identify top courses and optimize content strategy.
✅ Instructor Evaluation: Compare ratings and feedback across instructors.
✅ Learner Satisfaction: Track and improve engagement through data insights.
✅ Scalable Design: Works for startups, institutions, or global e-learning companies.
🧠 Why Every E-Learning Business Needs This Dashboard
In the competitive world of online education, data drives growth. This Excel dashboard empowers you to:
Visualize profitability and growth patterns.
Compare platform and course performance.
Improve learner experience through data-backed insights.
Align goals with real-time KPIs.
Make smarter, faster strategic decisions.
In short — it turns Excel into your analytics powerhouse.
💡 How to Use the Dashboard
1️⃣ Input Data: Enter course, revenue, and enrolment info in the Data Sheet.
2️⃣ Refresh Pivots: Update pivot tables for live visuals.
3️⃣ Use Slicers: Filter results by platform, category, or time.
4️⃣ Analyze: Review trends and insights across pages.
5️⃣ Act: Identify underperformers, refine marketing, and boost revenue.
🧩 Customization Options
Add KPIs like Completion Rate or Learner Growth %.
Change slicers to show Instructor, Region, or Platform.
Modify color schemes to match your branding.
Expand to multi-year reporting for deeper trend analysis.
🧭 Best Practices
✅ Keep data clean and consistent.
✅ Refresh weekly or monthly.
✅ Focus visuals on key KPIs.
✅ Protect sensitive information.
✅ Maintain a backup file.
🏁 Conclusion
The Online Learning Platforms Dashboard in Excel is more than a spreadsheet — it’s a strategic analytics hub for your e-learning business.
Whether you’re an instructor, EdTech founder, or training manager, this dashboard delivers real-time insights that help you grow revenue, improve satisfaction, and scale operations confidently.
📈 Turn your data into decisions. Empower your online learning journey with Excel.
### Click here to read the Detailed blog post
Visit our YouTube channel for step-by-step tutorials
Watch the step-by-step video tutorial:
Compatibility and Requirements
- Works in Microsoft Excel desktop (Excel 2016 or later, or Microsoft 365).
- Pivot tables feed the charts, and slicers filter by time, platform or category. Microsoft explains slicers in Use slicers to filter data.
Who Uses This Dashboard
E-learning companies, course creators, instructors, EdTech founders, training managers and educational institutions that sell or run online courses.
Frequently Asked Questions
Which pages are included?
Overview, Platform Analysis, Category Analysis, Course Analysis and Month Analysis, plus a Support Sheet and a Data Sheet.
Which KPIs are on the Overview page?
Total Revenue (USD), Paid Course %, Instructor Rating, Certificate Enrolment Rate and Satisfaction Score.
Can I compare platforms and courses?
Yes. The Platform page shows instructor rating, profit margin % and revenue by platform, and the Course page shows revenue, enrolment and profit by course title.
How do I update it?
Enter course, revenue and enrolment data in the Data Sheet, then refresh the pivot tables.
Is there a Power BI or Google Sheets version?
Yes. See the Online Learning Platforms Dashboard in Power BI and the Online Learning Platforms Dashboard in Google Sheets.
Related Online Learning Templates
- Online Learning Platforms Dashboard in Power BI: the same dashboard in Power BI
- Online Learning Platforms Dashboard in Google Sheets: the Google Sheets edition
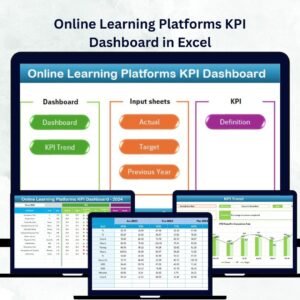
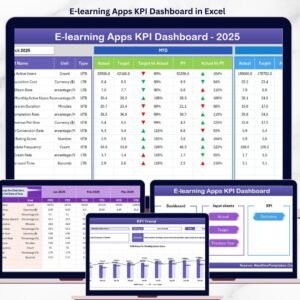
- Online Learning Platforms KPI Dashboard in Excel: monthly e-learning KPIs against targets in Excel
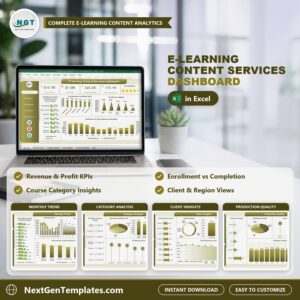
- E-learning Content Services Dashboard in Excel: a dashboard for e-learning content services
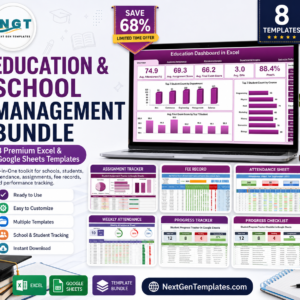
- Education & School Management Bundle: 8 education templates for Excel and Google Sheets
Browse all Excel dashboards or the Excel education templates.















Reviews
There are no reviews yet.