

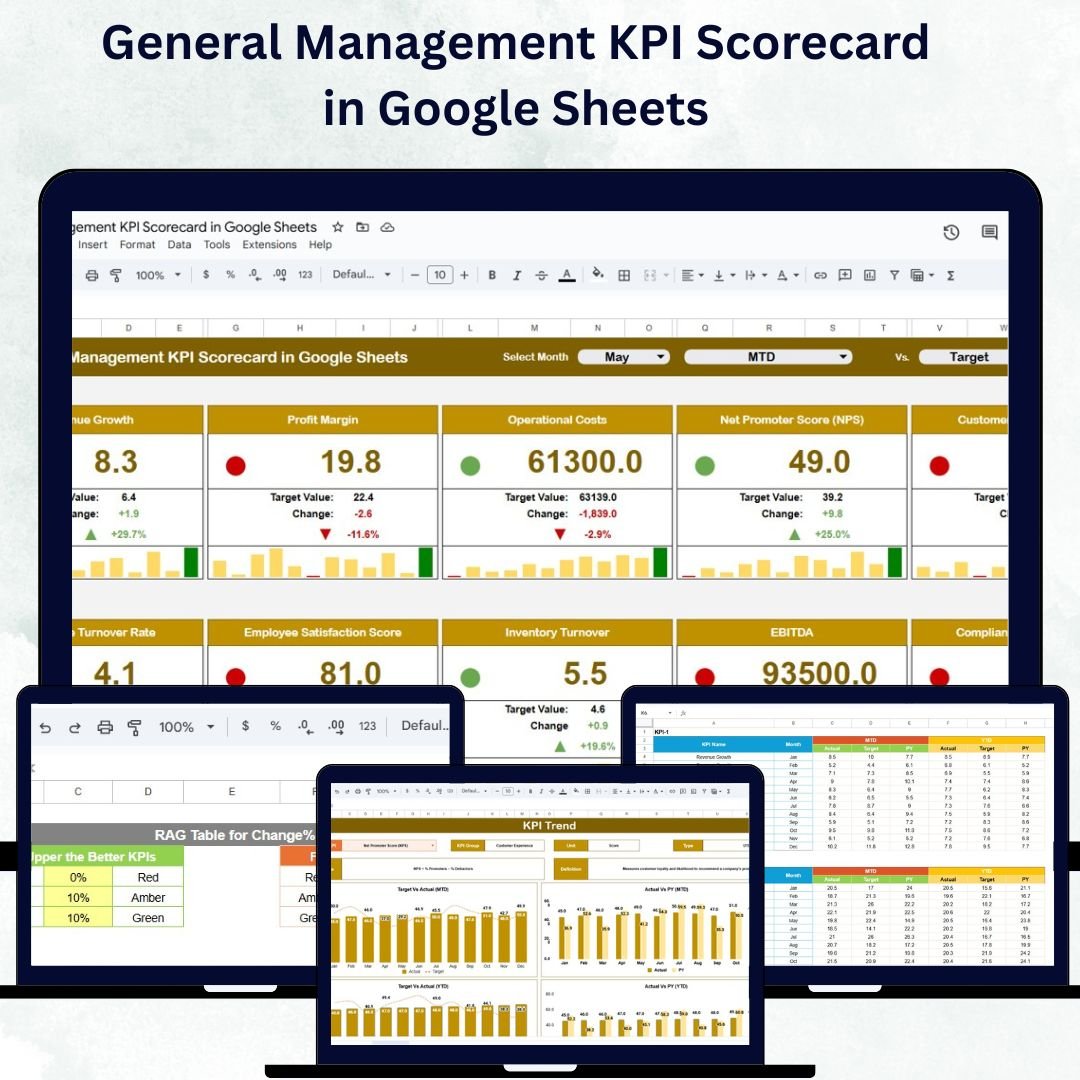
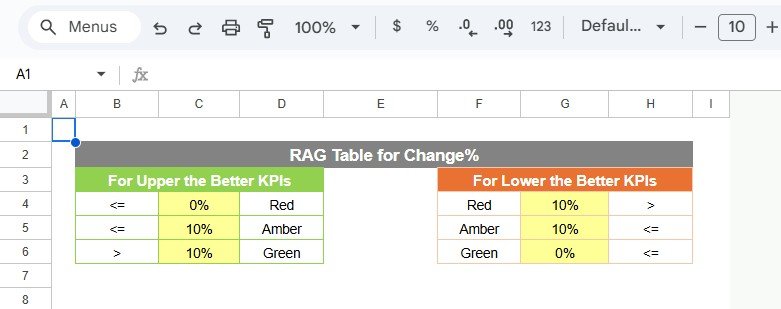

In every organization, success depends on how well you measure and manage performance. The General Management KPI Scorecard in Google Sheets provides a ready-to-use, visual, and data-driven solution to track, analyze, and improve business performance across departments.
This template consolidates multiple key performance indicators (KPIs) into one interactive scorecard — allowing managers and executives to monitor progress toward strategic goals in real time. With clear visuals, dynamic dropdowns, and automated comparisons, it eliminates guesswork and enables data-backed decision-making.
Built in Google Sheets, this scorecard offers collaboration, flexibility, and simplicity for businesses of any size.
🔑 Key Features of the General Management KPI Scorecard in Google Sheets
📋 Scorecard Sheet
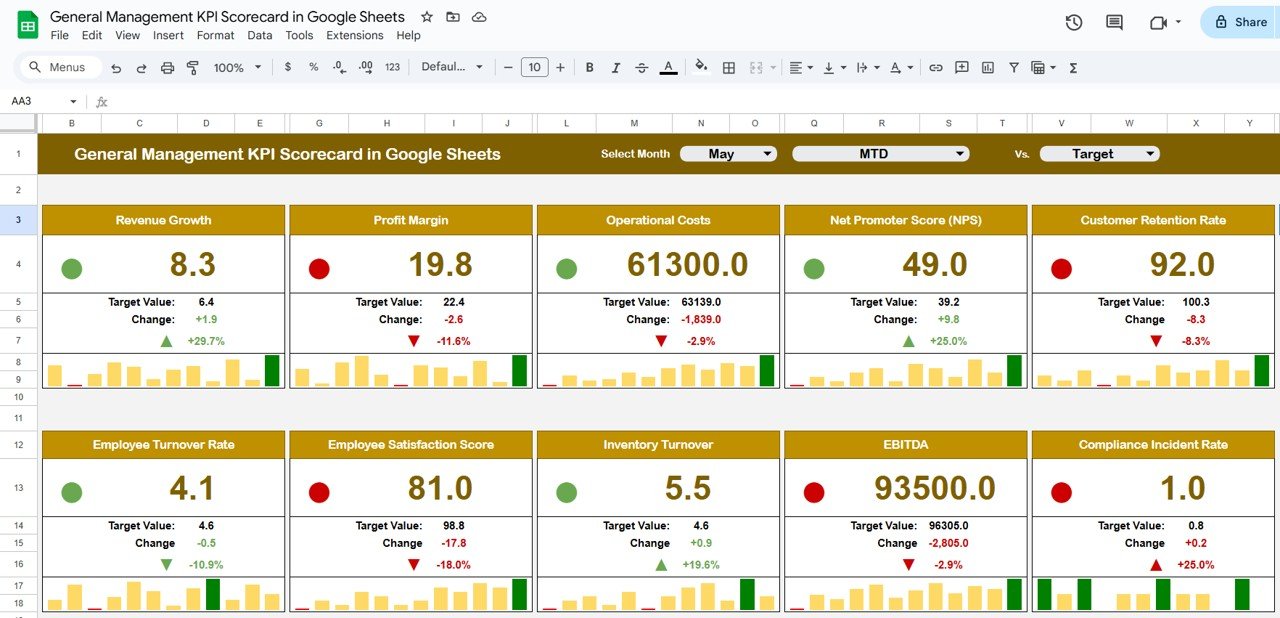
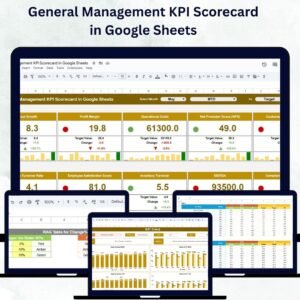
The main dashboard where all KPI results come together:
🎯 Dropdown Menus: Select Month, MTD (Month-to-Date), or YTD (Year-to-Date) to view filtered data
📈 Actual vs Target Values: Compare real performance against organizational goals
🟢🔴 Visual Indicators: Color-coded conditional formatting highlights KPIs meeting or missing targets
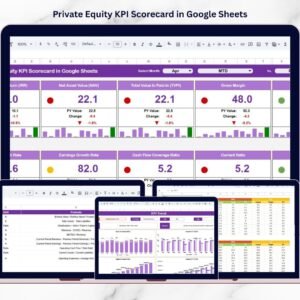
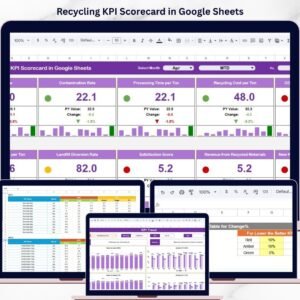
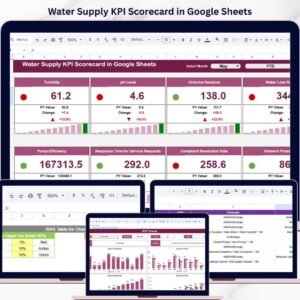
🧭 Comprehensive Overview: View 10 KPIs side-by-side for fast performance evaluation
🕒 Dynamic Updates: Reflects new data instantly as entered in the input sheet
This sheet gives managers a clear snapshot of overall performance, ensuring focus on the most important business metrics.
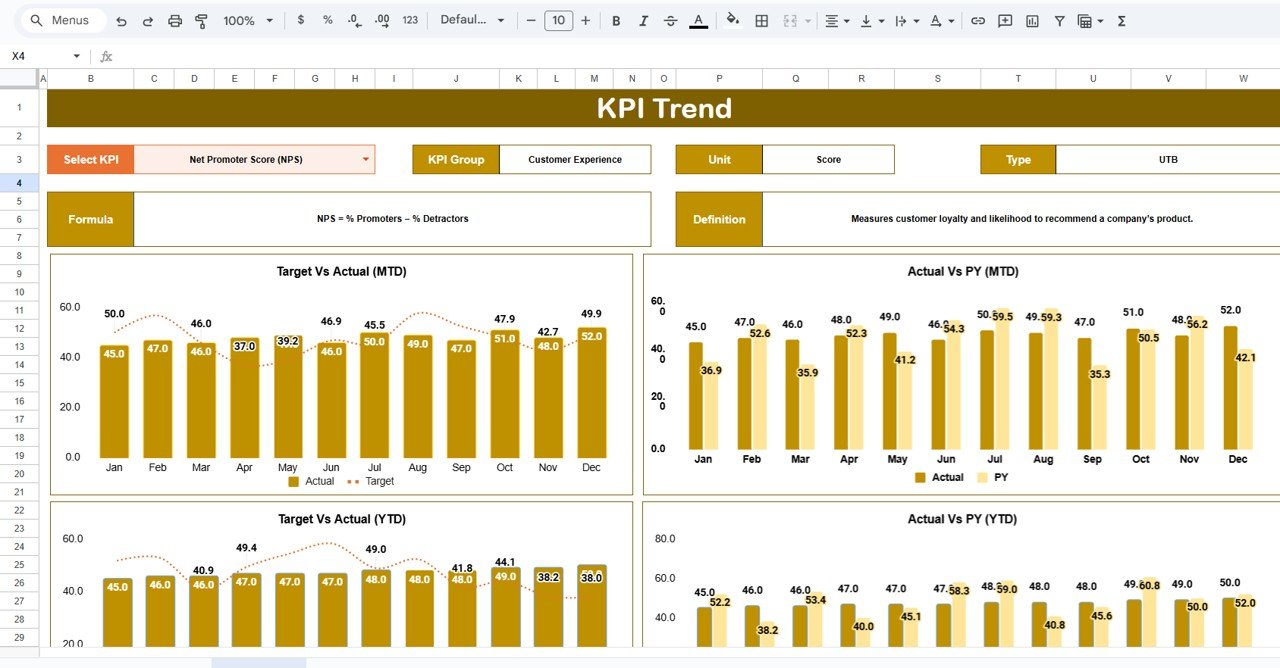
📊 KPI Trend Sheet Tab
Get deeper insights into KPI trends and historical performance:
Select KPI from dropdown (Range C3)
View KPI Group, Unit, Type (LTB or UTB), Formula, and Definition
Analyze monthly and yearly trends for Actual, Target, and Previous Year data
Visual trend charts identify performance fluctuations
Perfect for strategic reviews and presentations, this sheet helps visualize progress toward long-term goals.
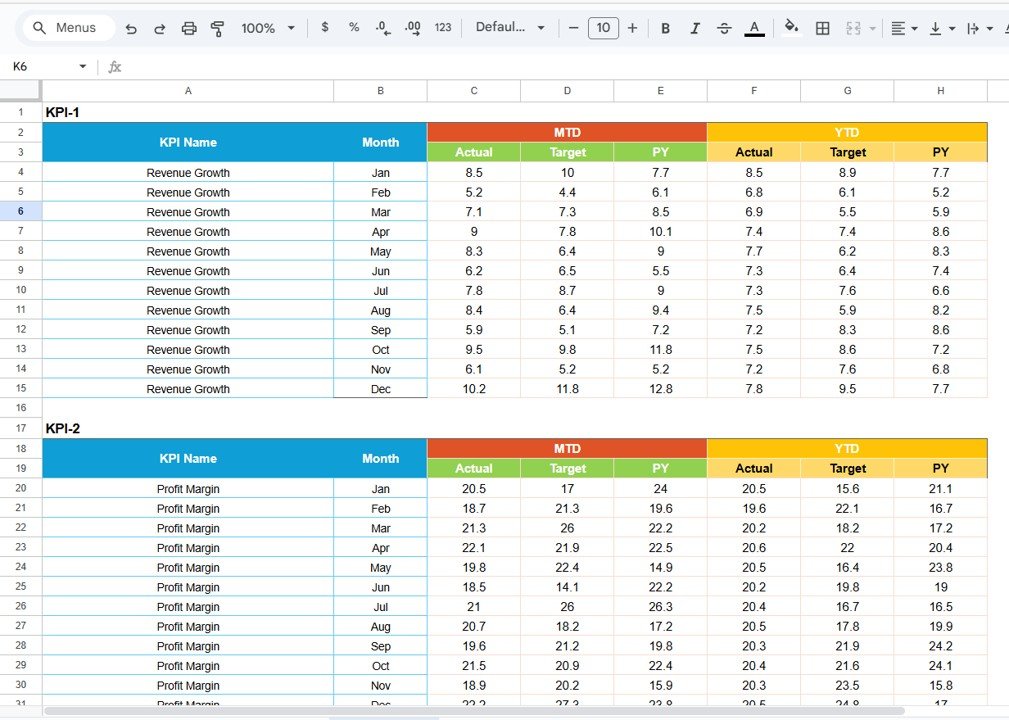
🧮 Input Data Sheet
The foundation of the scorecard — where all actual and target data is maintained:
Enter MTD, YTD, Target, and PY values for each KPI
Flexible and simple layout for quick updates
Acts as the main data source powering all visualizations
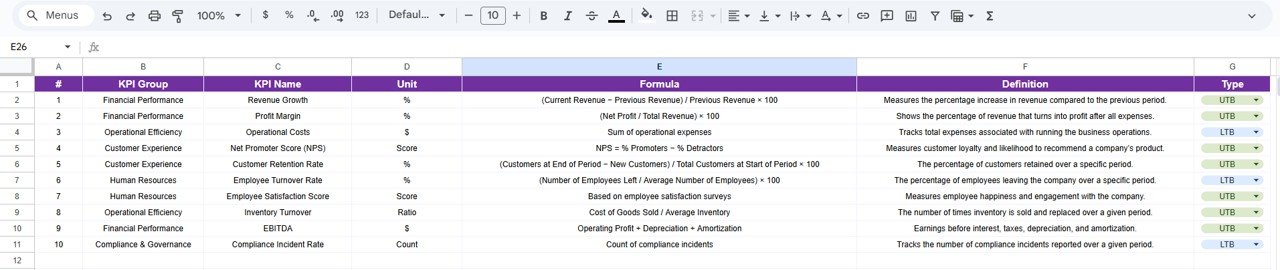
📖 KPI Definition Sheet Tab
Ensure clarity and consistency with a structured KPI reference:
Record KPI Name, Group, Unit, Formula, Definition, and KPI Type (Upper-the-Better or Lower-the-Better)
Standardizes understanding across departments
Helps avoid confusion in performance measurement
This makes the scorecard ideal for cross-functional performance management.
💡 Advantages of Using the General Management KPI Scorecard
✅ Centralized Tracking: Manage all KPIs from one unified dashboard
📊 Real-Time Insights: Instantly see progress against MTD, YTD, and target values
🎨 Visual Clarity: Use color-coded visuals and charts to quickly identify trends
📈 Trend Analysis: Compare monthly data and detect improvement areas
⚙️ Customizable Design: Add or modify KPIs as per organizational needs
👥 Collaborative Access: Multiple users can update and review simultaneously
📅 Accurate Data: Structured inputs ensure consistent and reliable reporting
The scorecard helps organizations transform raw data into actionable intelligence, driving better alignment and accountability.
🧠 Best Practices for Using the Scorecard
Update Regularly: Keep Input Data current for accurate insights
Set SMART Targets: Ensure all KPIs have clear and measurable goals
Analyze Trends Monthly: Use the KPI Trend sheet for continuous improvement tracking
Leverage Visual Indicators: Color-coded signals instantly show where attention is needed
Customize KPIs: Tailor the sheet to your company’s departments and goals
Schedule Reviews: Conduct monthly or quarterly scorecard reviews with teams
🏢 How This KPI Scorecard Helps Organizations
Monitor Departmental Performance: Evaluate productivity across HR, Finance, Operations, and Sales
Make Data-Driven Decisions: Base strategic choices on real-time KPI insights
Track Strategic Goals: Align teams toward measurable business outcomes
Identify Weak Spots: Highlight underperforming metrics for immediate action
Enhance Accountability: Assign ownership for each KPI to ensure progress
The General Management KPI Scorecard in Google Sheets empowers business leaders to manage performance intelligently — helping them achieve greater efficiency, transparency, and results.
👥 Who Can Benefit from This Scorecard
🏢 Executives & Directors: Track company-wide KPIs and overall performance
👨💼 Department Managers: Monitor and optimize operational metrics
📊 HR & Finance Teams: Align people and financial goals with business outcomes
📈 Analysts: Conduct trend and variance analysis with ease
💼 Small Business Owners: Simplify data-driven performance monitoring
🔗 Click here to read the Detailed blog post
Watch the step-by-step video Demo:
🔗 Visit our YouTube channel to learn step-by-step video tutorials
Compatibility and Requirements
- Works in Google Sheets. You need a free Google account and a web browser.
- You pick the month, MTD or YTD from dropdown menus on the Scorecard sheet, and the KPI on the KPI Trend sheet. Google explains dropdowns in Create an in-cell dropdown list.
Frequently Asked Questions
Which sheets are included?
Four sheets: Scorecard, KPI Trend, Input Data and KPI Definition.
How many KPIs does the scorecard show?
The Scorecard sheet shows 10 KPIs side by side, with actual values compared against targets.
How do I update the scorecard?
Enter the MTD, YTD, Target and previous year (PY) values for each KPI in the Input Data sheet. The Scorecard and the trend charts update from that data.
How do I see the trend for one KPI?
Open the KPI Trend sheet and select the KPI from the dropdown in cell C3. It shows the KPI group, unit, type (LTB or UTB), formula and definition, plus monthly and yearly trends for Actual, Target and Previous Year.
Is there an Excel version?
Yes. See the General Management KPI Scorecard in Excel.
Related General Management Templates
- General Management KPI Scorecard in Excel: the same scorecard in Excel
- General Management KPI Dashboard in Google Sheets: a dashboard view of the same area
- General Management KPI Dashboard in Excel: the dashboard in Excel
- HR KPI Scorecard in Google Sheets: a scorecard for HR metrics
- KPI Scorecard Mega Pack: 12 scorecard templates in one download
Browse all Google Sheets KPI dashboards.













Reviews
There are no reviews yet.