In the fast-paced world of retail, e-commerce, and logistics, managing product returns efficiently is vital to maintaining profitability and customer trust. The Returns Management KPI Dashboard in Power BI provides the perfect solution — an intelligent, data-driven platform that transforms return data into actionable business insights.
Built with Microsoft Power BI and powered by Excel data, this ready-to-use dashboard helps organizations track, analyze, and optimize their return processes in real time. It centralizes Month-to-Date (MTD) and Year-to-Date (YTD) metrics, giving you complete visibility into return trends, operational costs, and performance against targets — all in one visual interface.
⚙️ Key Features of the Returns Management KPI Dashboard in Power BI
This dashboard consists of three powerful analytical pages — each designed to simplify return analytics and decision-making.
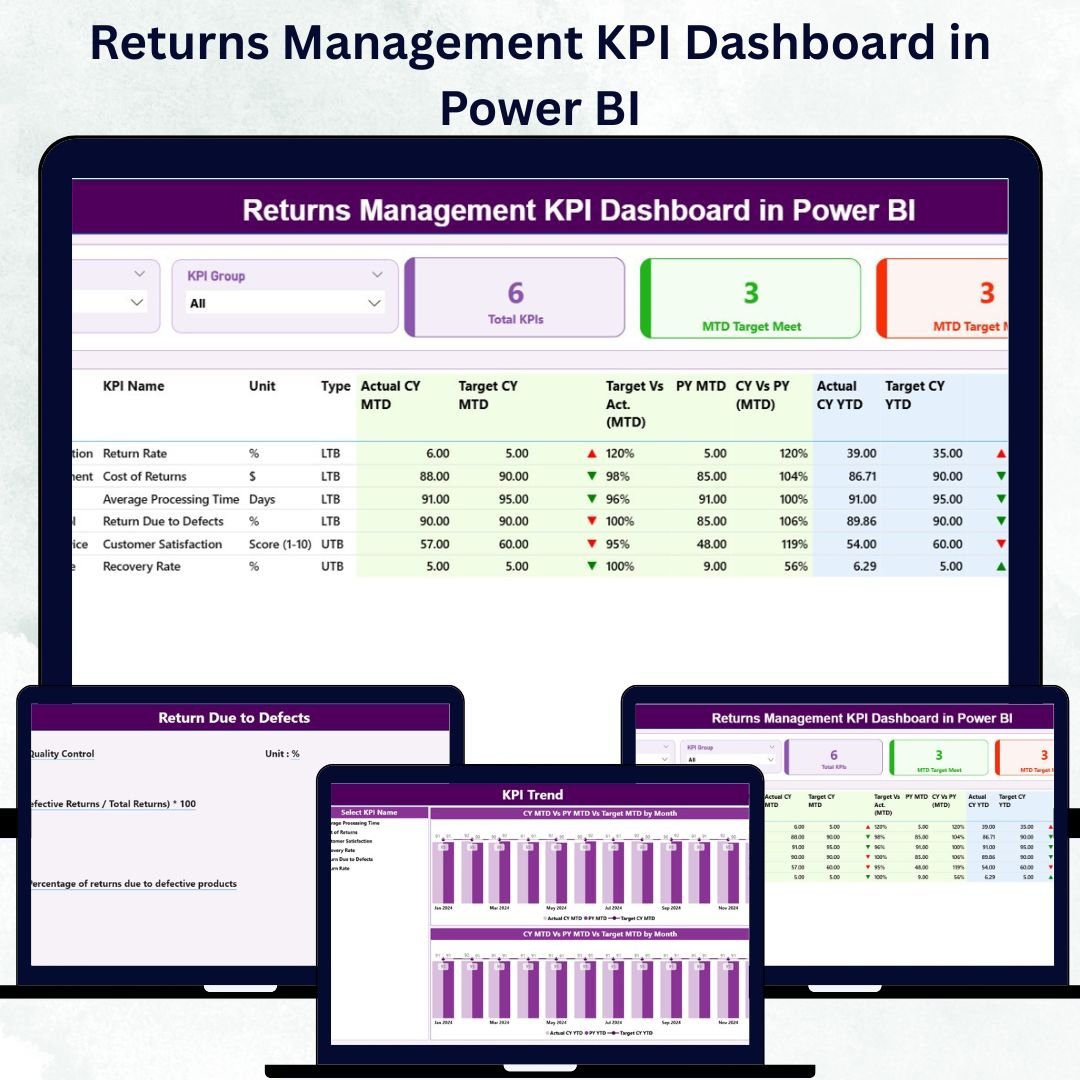
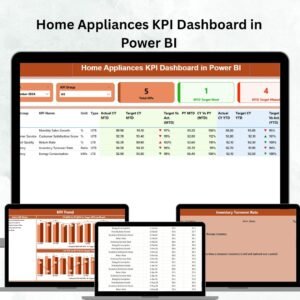
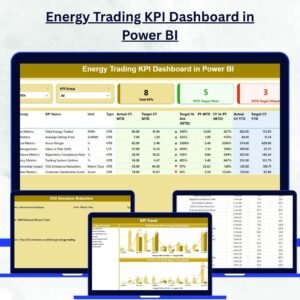
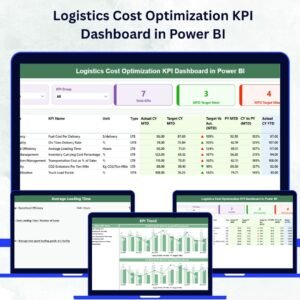
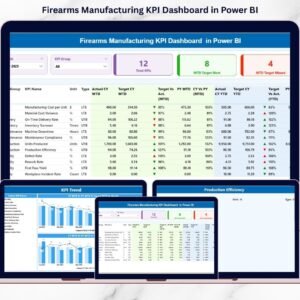
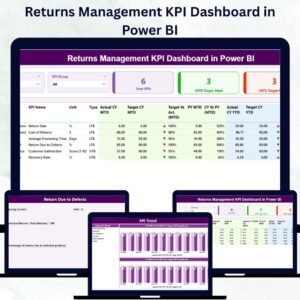
🧭 1️⃣ Summary Page – The Central Overview

The Summary Page provides a bird’s-eye view of the organization’s return performance.
Highlights:
-
Interactive Slicers: Filter by Month or KPI Group for precise analysis.
-
KPI Cards: Instantly view Total KPIs Count, MTD Target Met Count, and MTD Target Missed Count.
-
Detailed KPI Table: Displays key fields such as KPI Number, Group, Unit, Type (LTB/UTB), Actuals, Targets, and Performance Icons (▲/▼).
-
Comparison Metrics: MTD and YTD actuals versus targets, with visual indicators for quick interpretation.
This page gives management a snapshot of overall efficiency — allowing them to pinpoint areas of success or concern instantly.
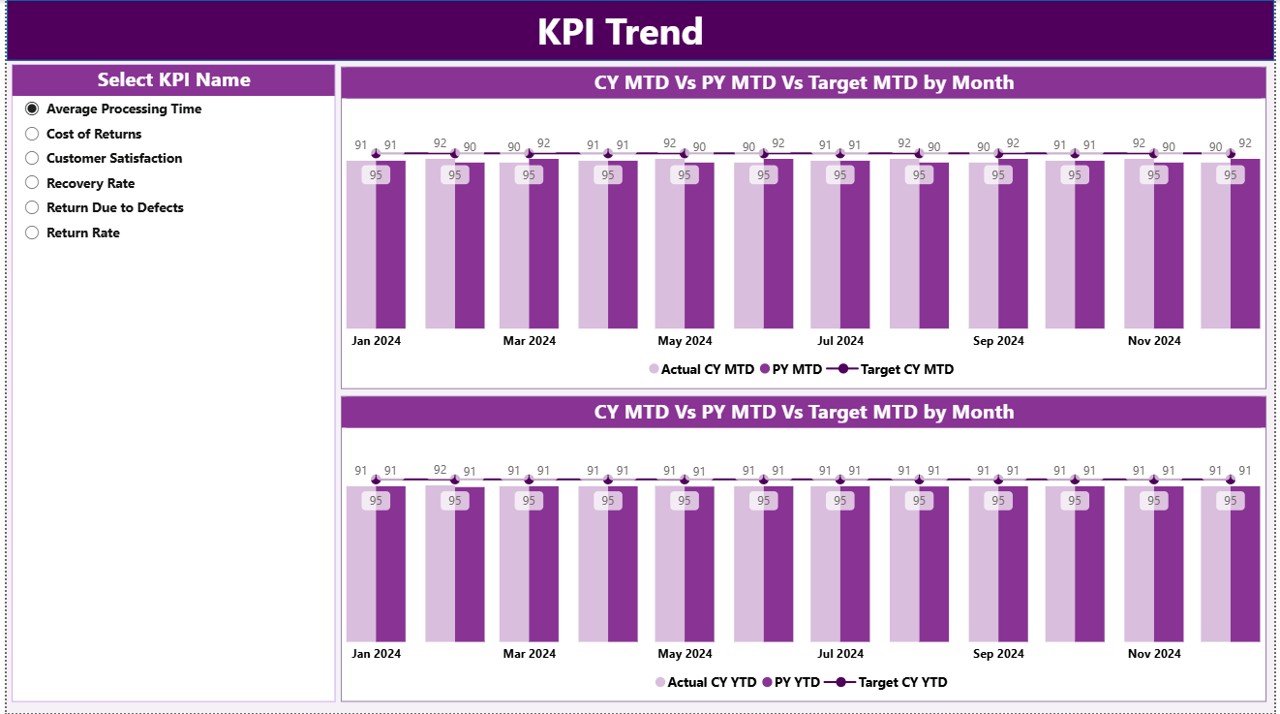
📈 2️⃣ KPI Trend Page – Track Progress Over Time
The KPI Trend Page is where data comes to life through dynamic charts.
Visual Elements Include:
-
Combo Charts: Compare Actual vs Target vs Previous Year for both MTD and YTD.
-
KPI Slicer: Choose any KPI to analyze performance patterns.
-
Trend Analysis: Understand fluctuations, seasonal variations, and long-term trends.
With this page, managers can forecast issues, identify recurring inefficiencies, and plan strategic improvements based on data trends.
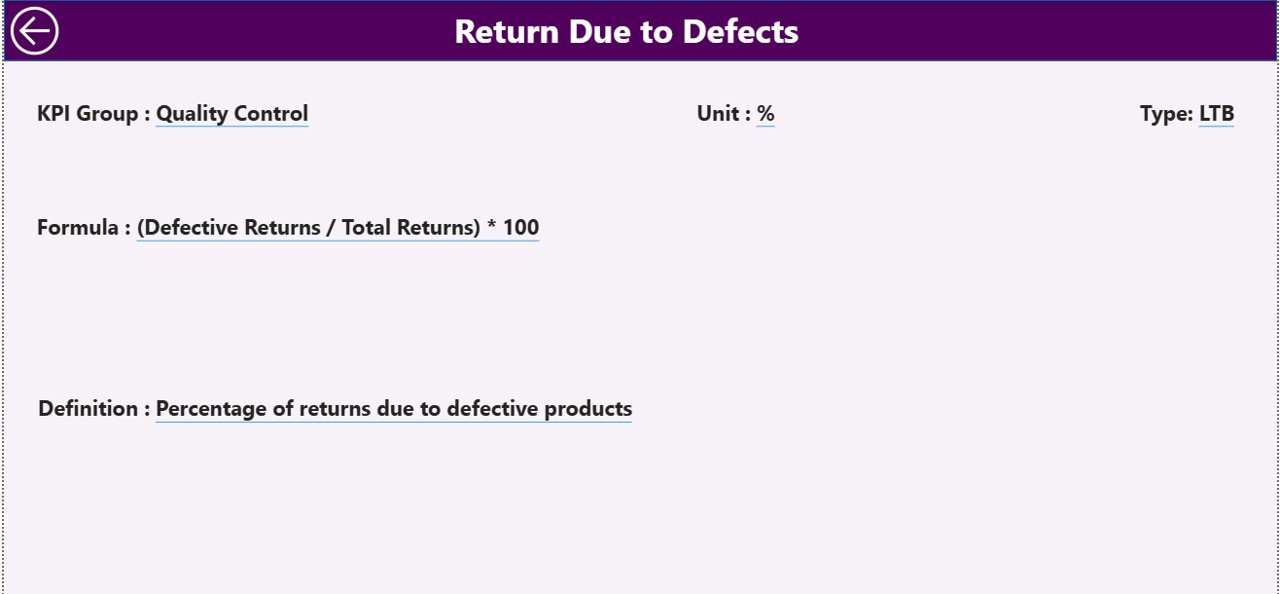
🧾 3️⃣ KPI Definition Page – Drill into Details
For complete KPI transparency, the KPI Definition Page lets users drill down from the Summary Page for detailed insights.
You’ll Find:
-
KPI Formula
-
KPI Definition
-
KPI Type (LTB/UTB)
A built-in Back Button returns users to the main dashboard seamlessly, ensuring a smooth navigation experience.
📊 Excel Data Structure Behind the Dashboard
The dashboard integrates three structured Excel sheets that serve as its foundation:
1️⃣ Input_Actual Sheet:
Holds the monthly and yearly actual performance data.
Columns: KPI Name, Month, MTD Number, YTD Number.
2️⃣ Input_Target Sheet:
Stores performance targets for benchmarking.
Columns: KPI Name, Month, MTD Target, YTD Target.
3️⃣ KPI Definition Sheet:
Defines each KPI with essential metadata.
Columns: KPI Number, Group, Name, Unit, Formula, Definition, Type (LTB or UTB).
These sheets are easy to update — once refreshed, Power BI automatically recalculates all visuals and metrics.
🌟 Why Businesses Need the Returns Management KPI Dashboard
Efficient returns management isn’t just about refunds — it’s about improving logistics, reducing costs, and building customer loyalty. This dashboard provides:
✅ Centralized Visibility: One place for all KPI tracking and analysis.
✅ Real-Time Performance Monitoring: Instantly identify MTD and YTD trends.
✅ Data-Driven Decisions: Replace guesswork with accurate insights.
✅ Improved Accountability: Clear ownership through defined KPI formulas.
✅ Time Savings: Automates reports, reducing manual work and human error.
💼 Advantages of the Returns Management KPI Dashboard in Power BI
✔️ Enhanced Decision-Making – Evaluate results against targets instantly.
✔️ Visual Tracking – Use color-coded icons and arrows to monitor success or decline.
✔️ Historical Comparison – Track improvement across months and years.
✔️ Automation – Data refreshes directly from Excel for always-current reports.
✔️ Customizable – Add or modify KPIs as your business evolves.
✔️ Scalable & Accessible – Works for any industry, from retail to manufacturing.
📦 Industries That Benefit
🏬 Retail & E-commerce: Analyze return rates and refund time.
🏭 Manufacturing: Identify production or quality-related issues.
🚛 Logistics: Track reverse logistics and delivery efficiency.
📱 Electronics: Monitor warranty claims and repair cycles.
👕 Apparel: Manage size-related or regional return patterns.
🧠 Best Practices for Maximum Efficiency
✅ Keep Excel data structured and consistently updated.
✅ Maintain uniform KPI naming conventions.
✅ Use visual indicators (colors/arrows) for clarity.
✅ Leverage the KPI Trend Page for predictive analysis.
✅ Automate data refresh using Power BI gateways.
By following these steps, your dashboard remains accurate, efficient, and business-ready.
📈 Practical Use Case
A global e-commerce brand used this dashboard to identify that most returns came from one product line with higher defect rates. With this insight, they improved packaging and vendor QC, reducing returns by 30% in three months.
That’s the power of combining data transparency with Power BI intelligence.
🎯 Conclusion
The Returns Management KPI Dashboard in Power BI is a must-have analytics solution for companies aiming to streamline their returns process. With real-time visuals, MTD and YTD tracking, and Excel-driven automation, it turns raw data into actionable insights — helping teams cut costs, improve efficiency, and build lasting customer trust.
From retail to logistics, this dashboard empowers every stakeholder to make confident, data-backed decisions that drive profitability and operational excellence.
🔗 Click here to read the Detailed Blog Post
🎥 Visit our YouTube channel for tutorials
🔗 YouTube.com/@PKAnExcelExpert


Reviews
There are no reviews yet.