Running a childcare center means balancing child safety, staff performance, compliance, and operational efficiency every single day. Without a clear reporting system, administrators often rely on scattered spreadsheets, manual updates, or guesswork. This leads to delays in decision-making and difficulty tracking whether goals are truly being met.
The Childcare Center KPI Dashboard in Power BI solves this challenge by transforming raw Excel data into interactive, real-time insights. It provides administrators and managers with a central hub to monitor KPIs such as staff efficiency, compliance metrics, service quality, and operational performance. With this dashboard, you gain visibility into month-to-date (MTD), year-to-date (YTD), and previous year comparisons—ensuring decisions are guided by facts, not assumptions.
✨ Key Features of Childcare Center KPI Dashboard in Power BI
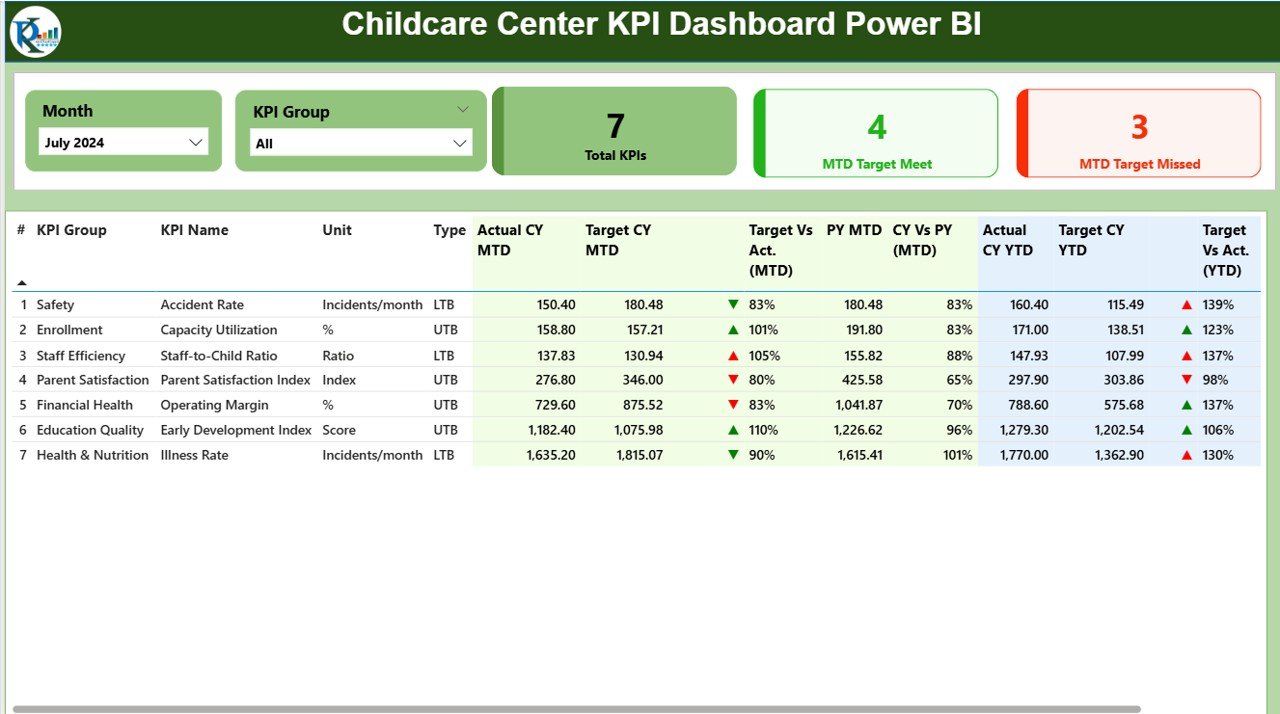
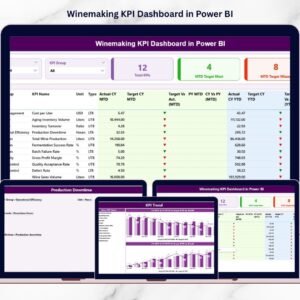
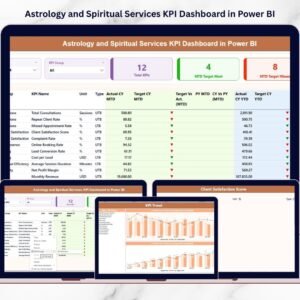
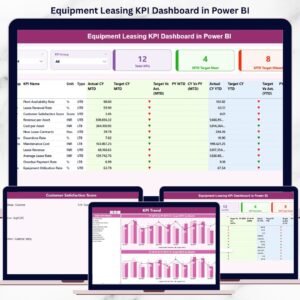
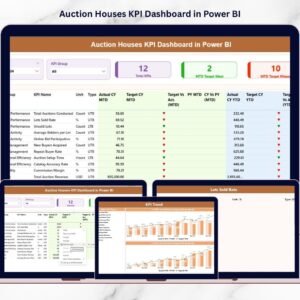
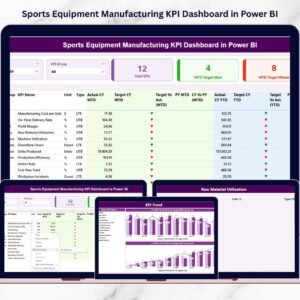
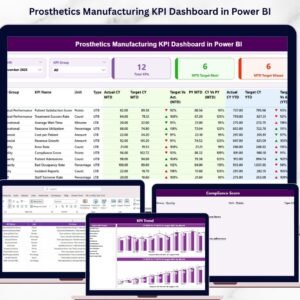
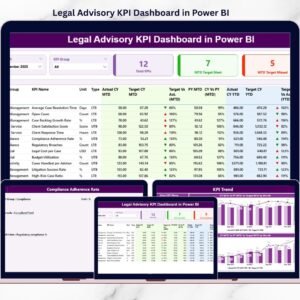
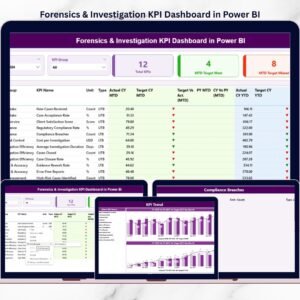
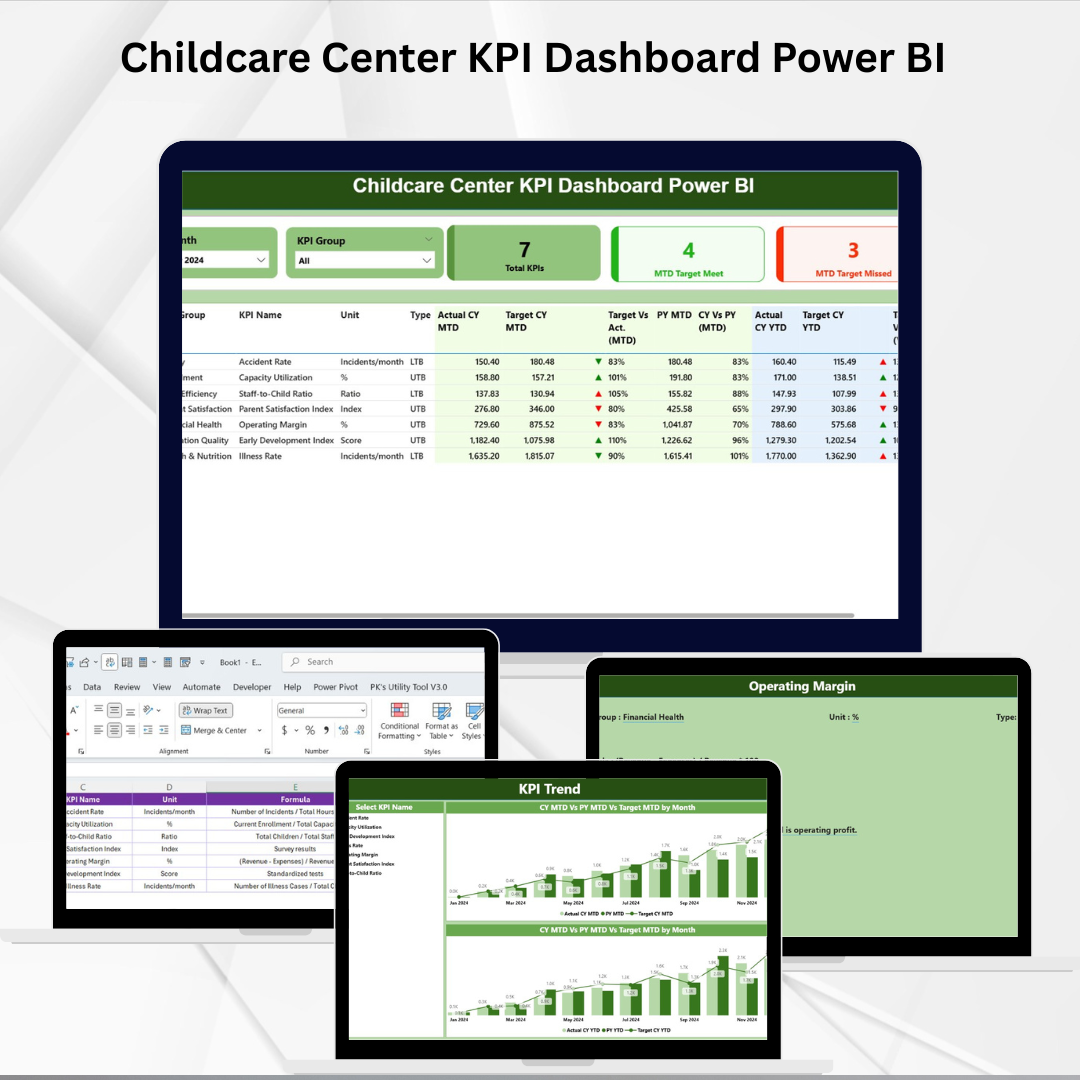
🏠 Summary Page – The central hub with slicers for filtering, KPI cards for quick highlights, and a detailed KPI table for performance breakdowns.
📊 KPI Cards – Instantly view total KPIs, how many targets are met, and how many are missed.
📋 Detailed KPI Table – Comprehensive metrics include Actuals, Targets, Variance %, Year-on-Year (YOY) comparisons, and status icons (green ▲ / red ▼).
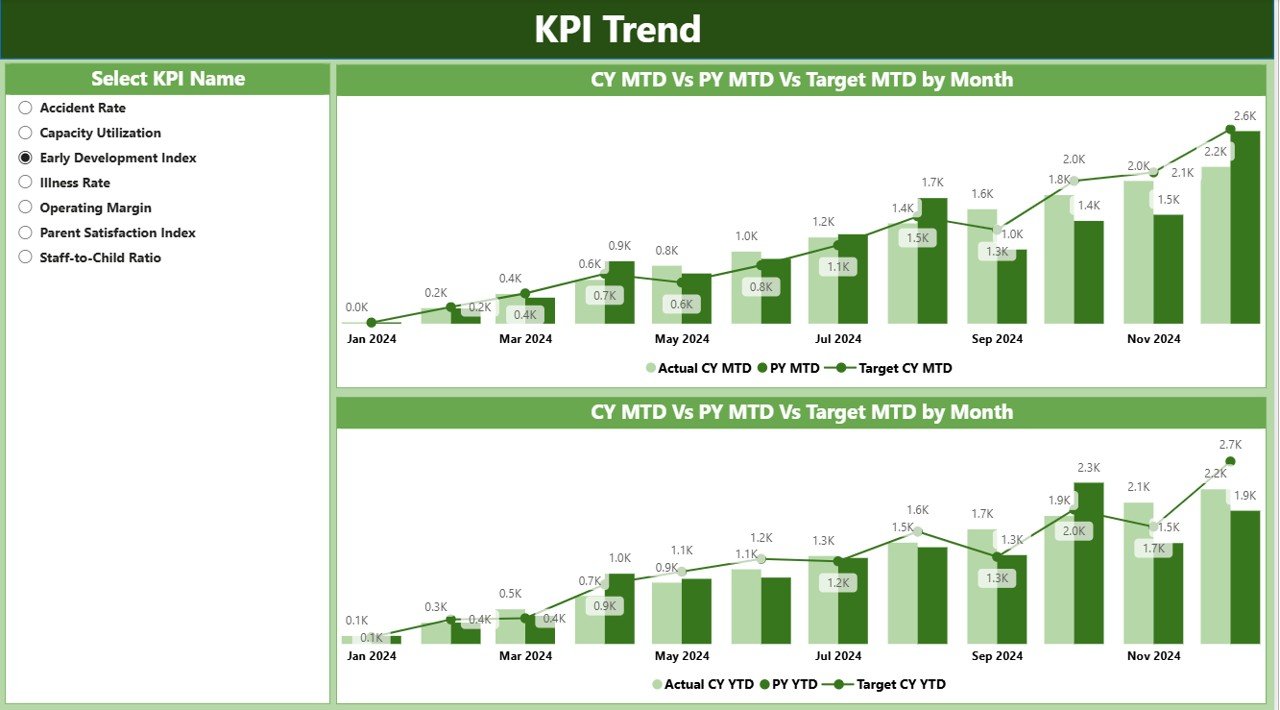
📈 KPI Trend Page – Visualize MTD and YTD patterns with combo charts. Select a specific KPI and track its performance over time.
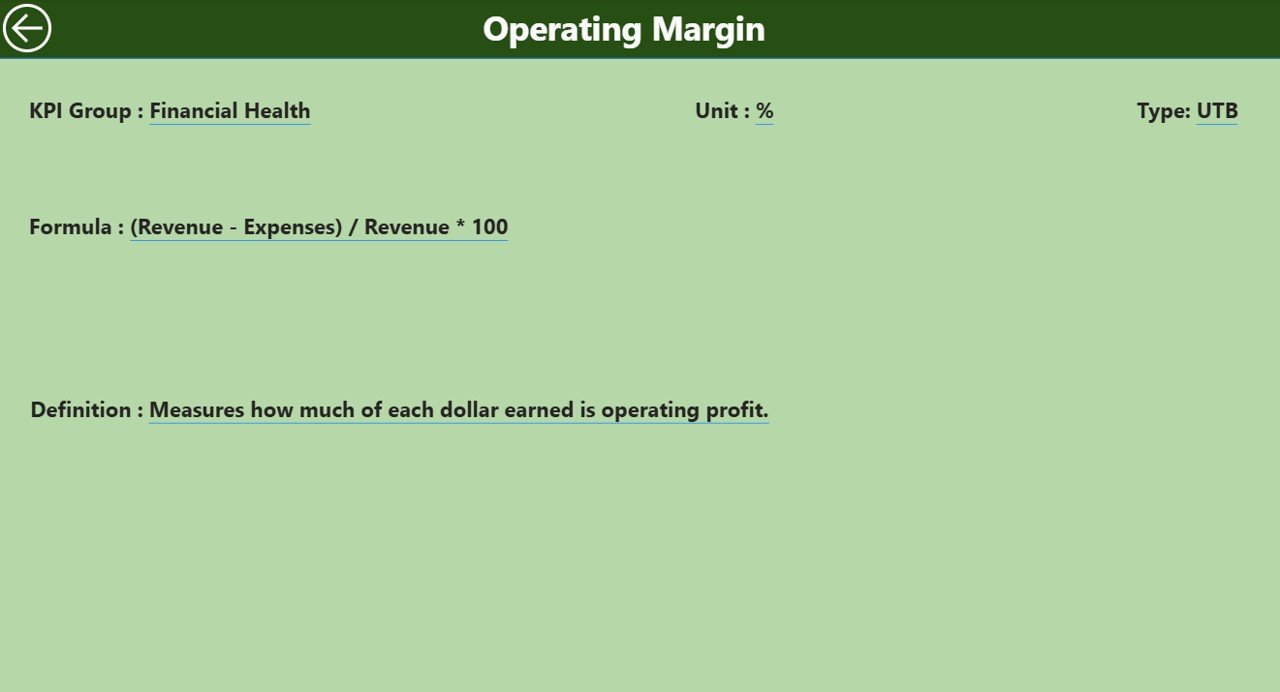
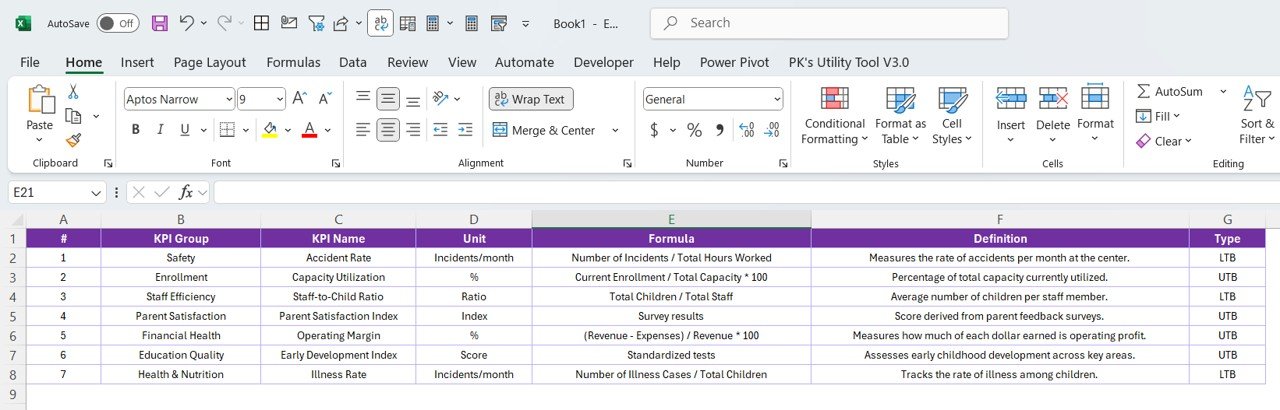
📘 KPI Definition Page – Drill-through feature that explains KPI number, group, unit, formula, type (UTB or LTB), and definition. Keeps reporting transparent and consistent.
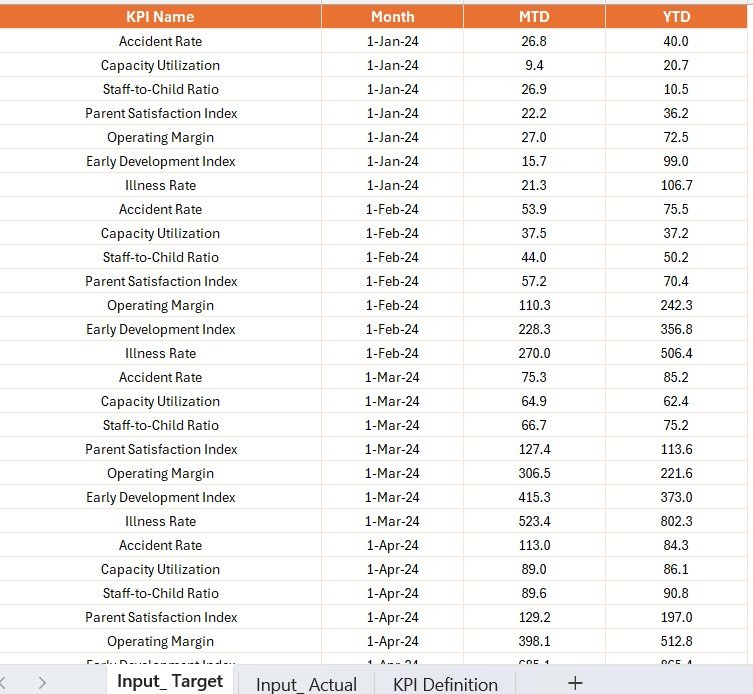
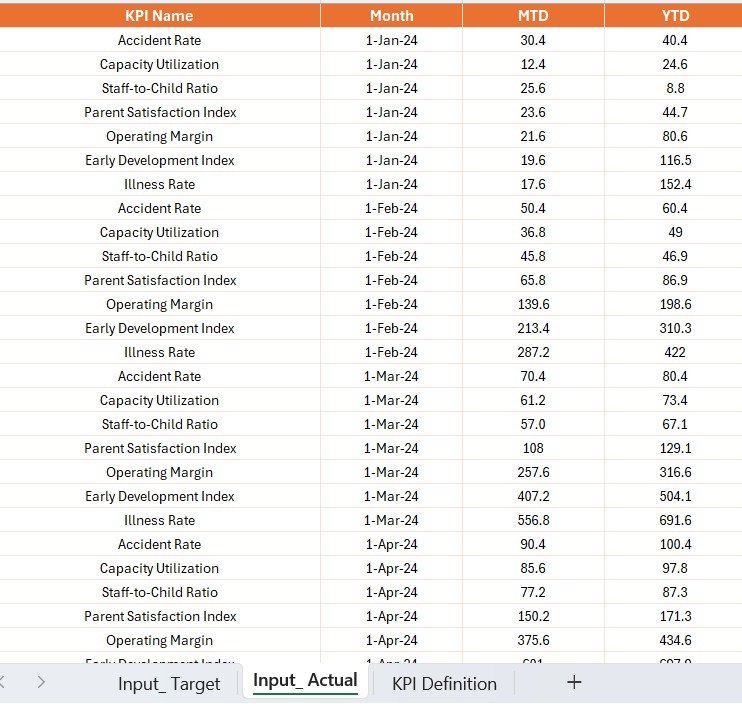
⚡ Excel Integration – Input Actual, Input Target, and KPI Definition sheets form the backend. Update Excel, and Power BI refreshes the visuals instantly.
🎯 Year-on-Year Comparisons – Track whether you are performing better or worse than last year’s results.
📱 Interactive Experience – Filters, slicers, and drill-through make the dashboard highly flexible and user-friendly.
📂 What’s Inside the Dashboard
The Childcare Center KPI Dashboard is structured into three main pages, supported by Excel as its data source:
Summary Page – A performance snapshot with KPI cards, slicers, and detailed KPI tables.
KPI Trend Page – Analyze KPI patterns over time with interactive trend charts.
KPI Definition Page – Hidden drill-through view explaining each KPI for clarity.
🛠 How to Use the Childcare KPI Dashboard
Enter Data in Excel – Add actual values, targets, and definitions into the Input_Actual, Input_Target, and KPI Definition sheets.
Load in Power BI – Refresh Power BI to update visuals with the latest data.
Use Filters & Slicers – Narrow down by month, KPI group, or specific KPI.
Monitor Status – Use KPI icons (green ▲ for target met, red ▼ for target missed) for quick evaluations.
Drill for Details – Right-click on any KPI to see definitions and calculations.
Review Trends – Switch to KPI Trend Page for MTD and YTD analysis.
Share with Stakeholders – Publish and share the dashboard through Power BI Service for collaborative access.
👥 Who Can Benefit from This Dashboard
The Childcare Center KPI Dashboard in Power BI is designed for:
👩🏫 Childcare Administrators – Monitor operations, compliance, and staff performance.
👨👩👧 Center Owners – Get transparency into overall efficiency and goal achievement.
📊 Managers – Track department-level KPIs and ensure accountability.
🧑🤝🧑 Staff Supervisors – Evaluate workload distribution and outcomes.
🏢 Compliance Officers – Ensure centers meet regulations and maintain quality standards.
📌 Click here to read the Detailed blog post
Visit our YouTube channel to learn step-by-step video tutorials