

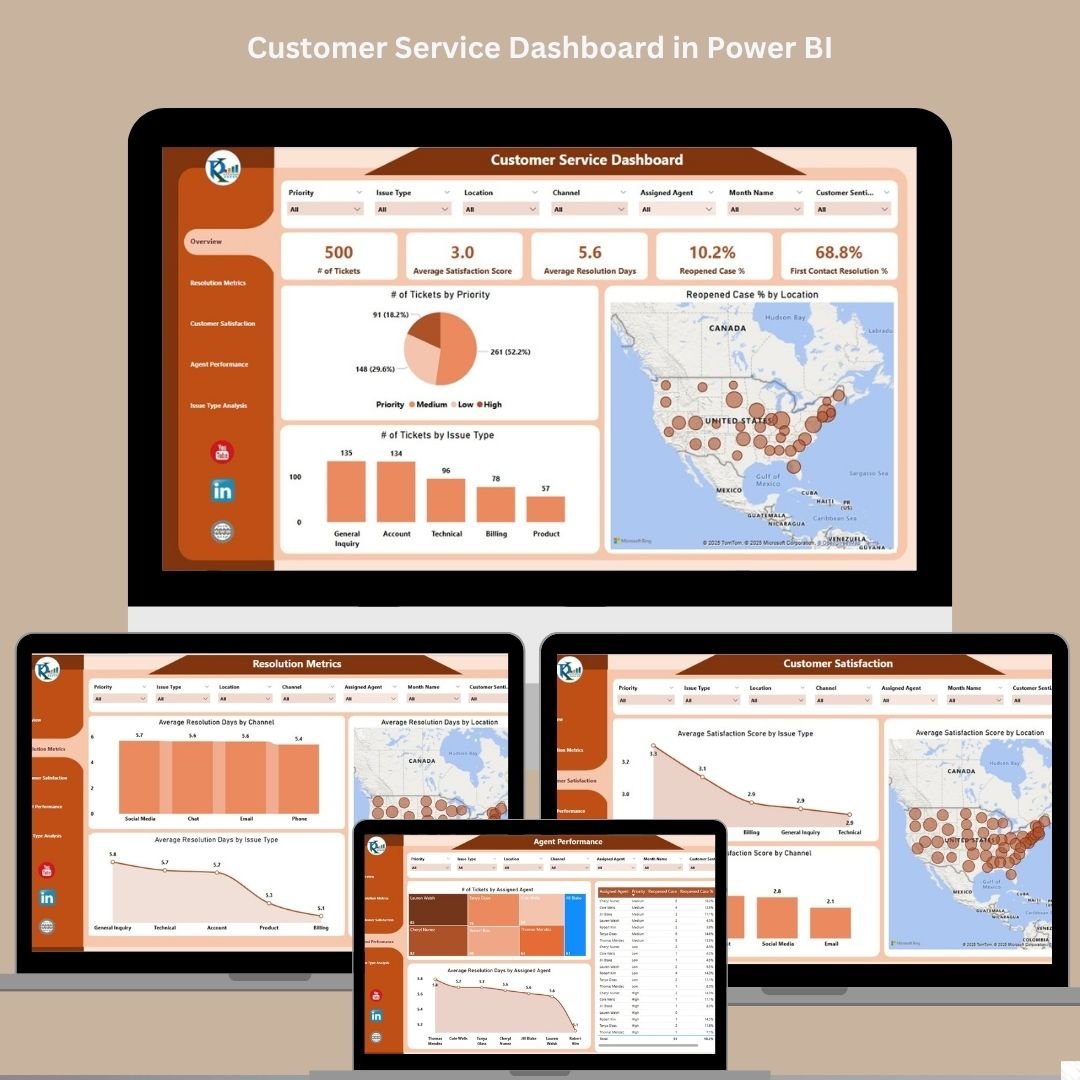

Customer satisfaction isn’t just a goal—it’s the foundation of lasting success. That’s why the Customer Service Dashboard in Power BI was built: to help you measure, analyze, and optimize your customer service operations with clarity and speed.
Whether you manage a call center, a support desk, or a multi-location service team, this ready-to-use Power BI dashboard enables real-time visibility into tickets, resolution efficiency, agent performance, and customer satisfaction metrics—all in one dynamic workspace.
🔍 Key Features of the Dashboard
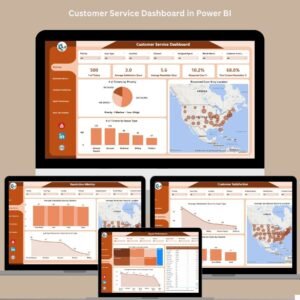
This interactive Power BI file includes five detailed sheets, each offering focused insights into different customer service KPIs:
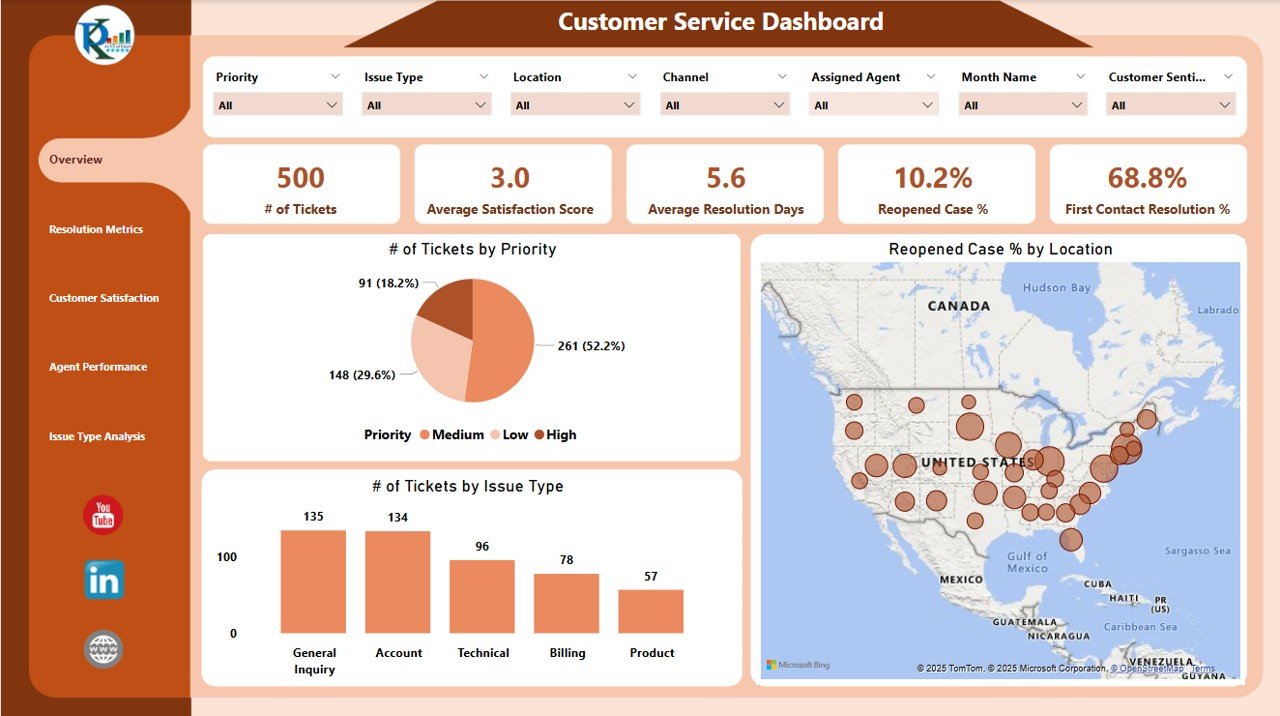
🧭 1. Overview Sheet Tab
Cards:
✅ Number of Tickets
✅ Average Satisfaction Score
✅ Average Resolution Days
✅ Reopened Case %
✅ First Contact Resolution %Charts:
📊 Tickets by Priority
📊 Tickets by Issue Type
📊 Reopened Case % by Location
Gain a comprehensive snapshot of service operations at a glance!
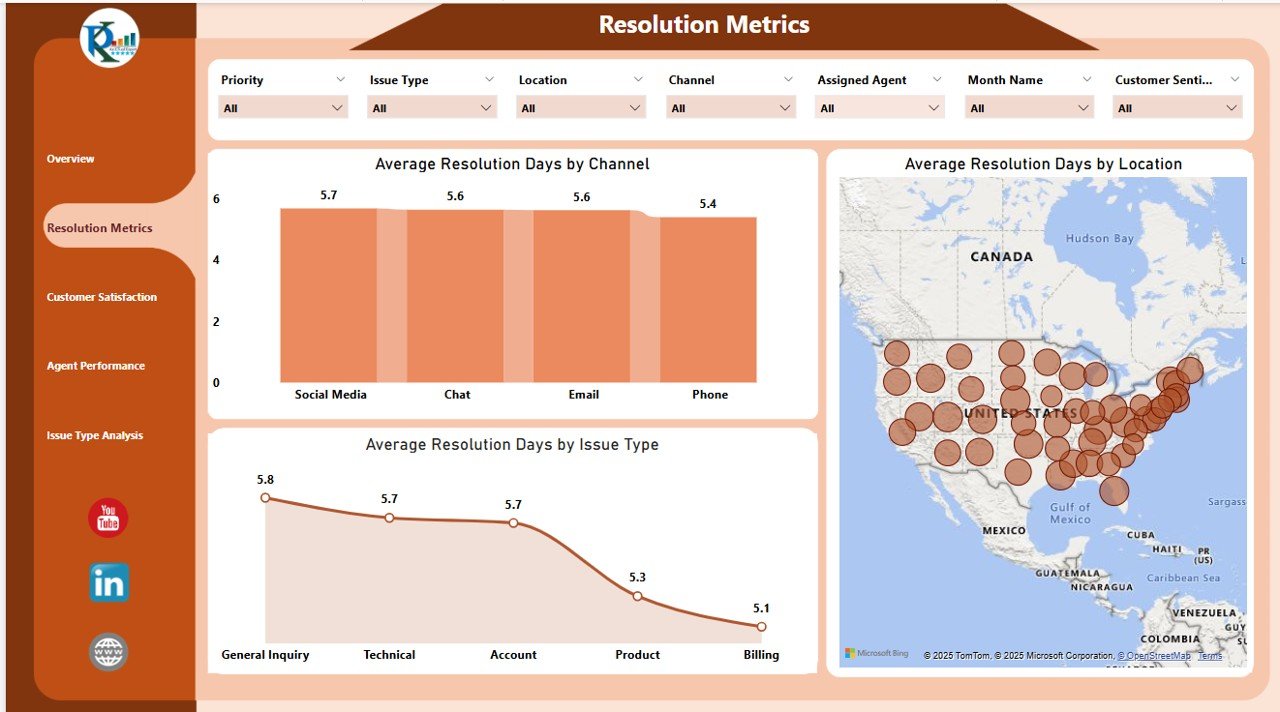
⏱ 2. Resolution Metrics Sheet Tab
Avg. Resolution Days by:
Issue Type
Channel (email, phone, chat)
Location
Identify where delays happen and take action faster.
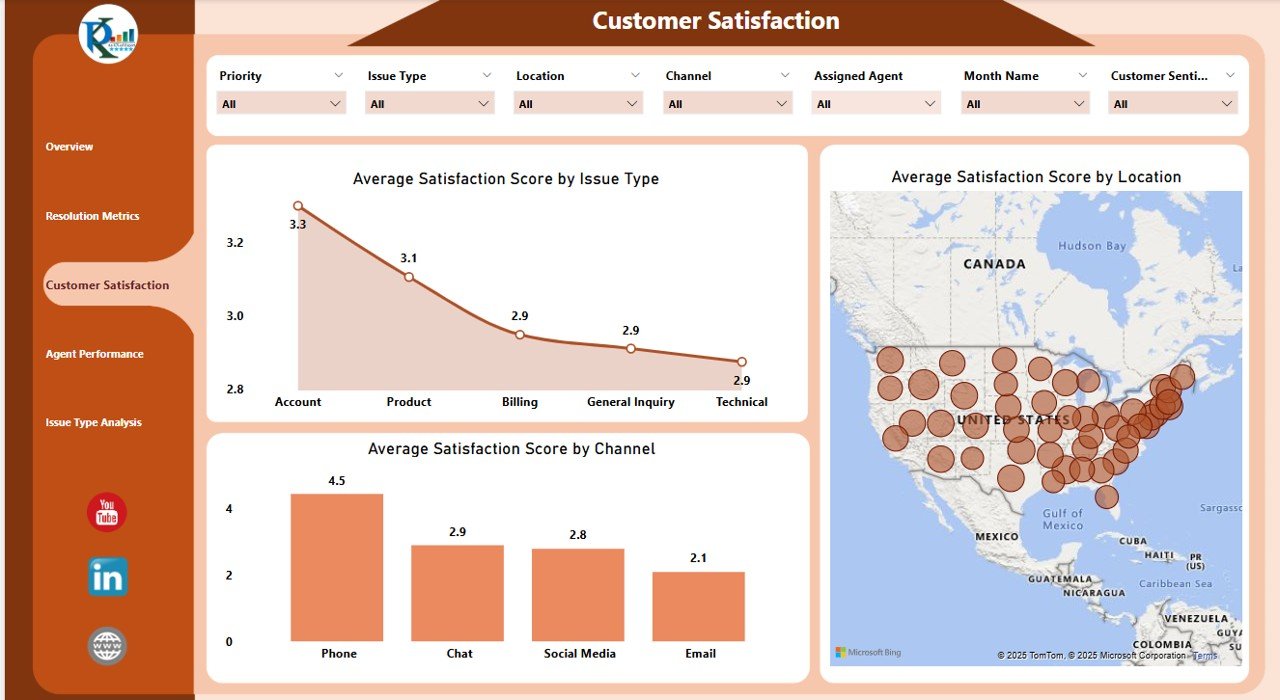
💬 3. Customer Satisfaction Sheet Tab
Satisfaction Score by:
Issue Type
Channel
Location
Pinpoint the root causes of low satisfaction and prioritize improvements.
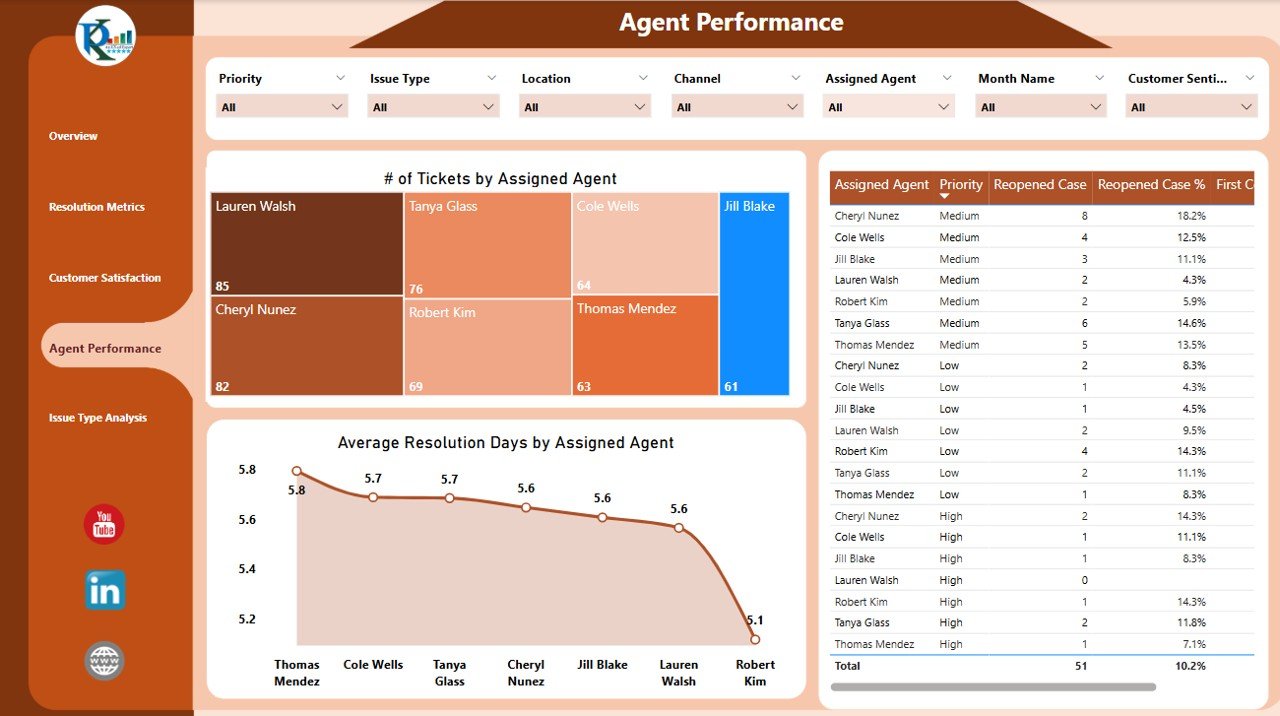
👩💼 4. Agent Performance Sheet Tab
Track:
of Tickets per Agent
Average Resolution Days per Agent
Satisfaction Score per Agent
Use this to balance workloads, guide training, and boost team productivity.
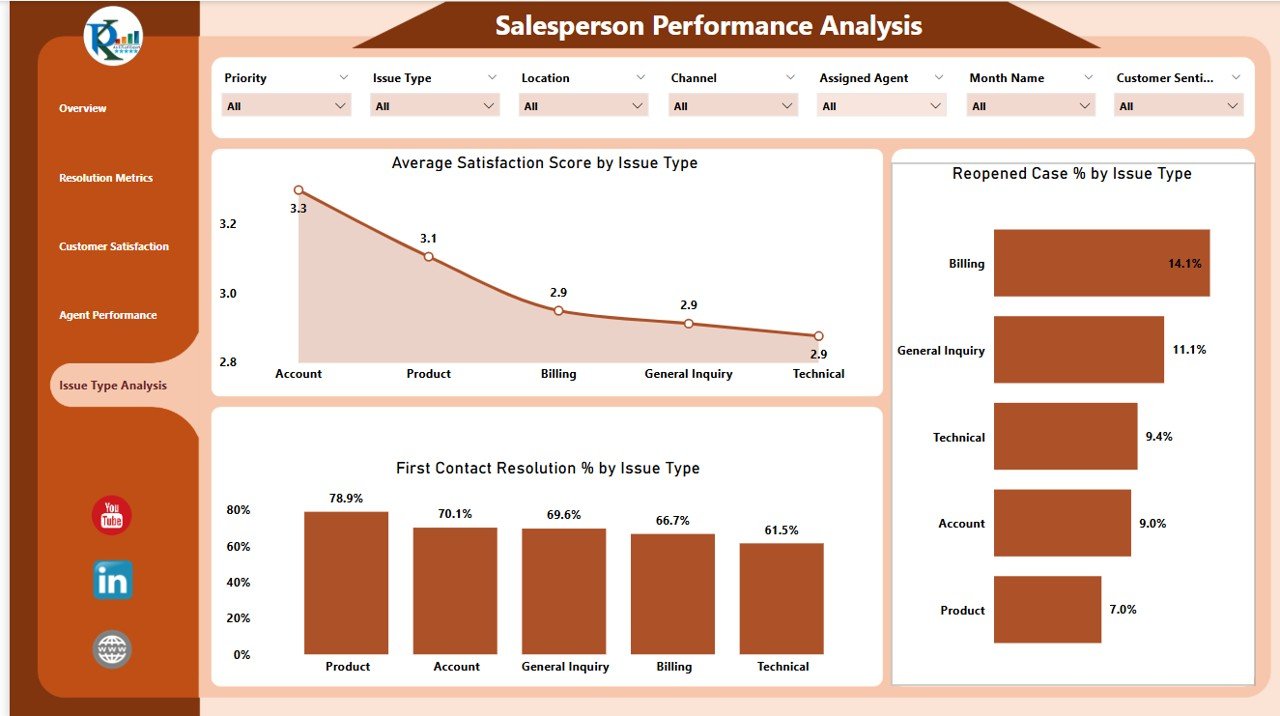
🛠 5. Issue Type Analysis Sheet Tab
Charts for:
Avg. Satisfaction Score by Issue Type
Reopened Case % by Issue Type
First Contact Resolution % by Issue Type
Discover patterns in recurring problems and reduce ticket volumes over time.
🚀 Advantages of Using This Power BI Dashboard
📈 Real-Time Insights
Get up-to-date performance data with every refresh.
🎯 Custom Filters & Slicers
Slice and dice by date, region, priority, or agent to find targeted answers quickly.
💡 Comprehensive Monitoring
Track everything from tickets to trends in satisfaction—all in one centralized tool.
📊 Visually Engaging Layout
Cards, charts, and tables bring your customer support KPIs to life.
📉 Informed Decision-Making
Make strategic improvements based on facts—not assumptions.
🎯 Best Practices for Success
✔️ Update data regularly for accurate insights
✔️ Monitor KPIs like First Contact Resolution & Satisfaction Score
✔️ Use Agent Performance data to improve team training
✔️ Share dashboard with stakeholders for transparent reporting
✔️ Schedule weekly reviews to act on real-time trends
👥 Who Should Use This Dashboard?
🧑💼 Customer Support Managers
📞 Call Center Supervisors
🧮 Business Intelligence Analysts
🏢 Operations Teams
📊 CX Strategists
Whether you’re managing a local helpdesk or a global support team, this tool is essential for keeping service quality high and customers happy.
Read the detailed blog post
📺 Learn How to Use It
Watch the full step-by-step video tutorial on our YouTube channel:
🔗 youtube.com/@PKAnExcelExpert
Compatibility and Requirements
- Works in Power BI Desktop, which is free to download. Microsoft explains the install in Get Power BI Desktop.
- You load your own ticket data and refresh the report to update the cards and charts.
Frequently Asked Questions
Which sheet tabs are included?
Five tabs: Overview, Resolution Metrics, Customer Satisfaction, Agent Performance and Issue Type Analysis.
Which KPIs show on the Overview tab?
Number of Tickets, Average Satisfaction Score, Average Resolution Days, Reopened Case % and First Contact Resolution %. Charts show tickets by priority, tickets by issue type and reopened case % by location.
Can I compare agents?
Yes. The Agent Performance tab shows the number of tickets, average resolution days and satisfaction score for each agent.
Can I see results by channel and location?
Yes. The Resolution Metrics and Customer Satisfaction tabs break results down by issue type, channel (email, phone, chat) and location.
Is there an Excel or Google Sheets version?
Yes. See the Customer Service Dashboard in Excel and the Customer Service Dashboard in Google Sheets.
Related Customer Service Templates
- Customer Service KPI Dashboard in Power BI: another Power BI view of support KPIs
- Customer Service Dashboard in Excel: the same dashboard topic in Excel
- Customer Service Dashboard in Google Sheets: the Google Sheets edition
- Customer Service Request Tracker in Excel: log incoming requests
- Power BI Dashboard Mega Collection: 15 Power BI templates in one download
Browse all Power BI dashboards.







Reviews
There are no reviews yet.