

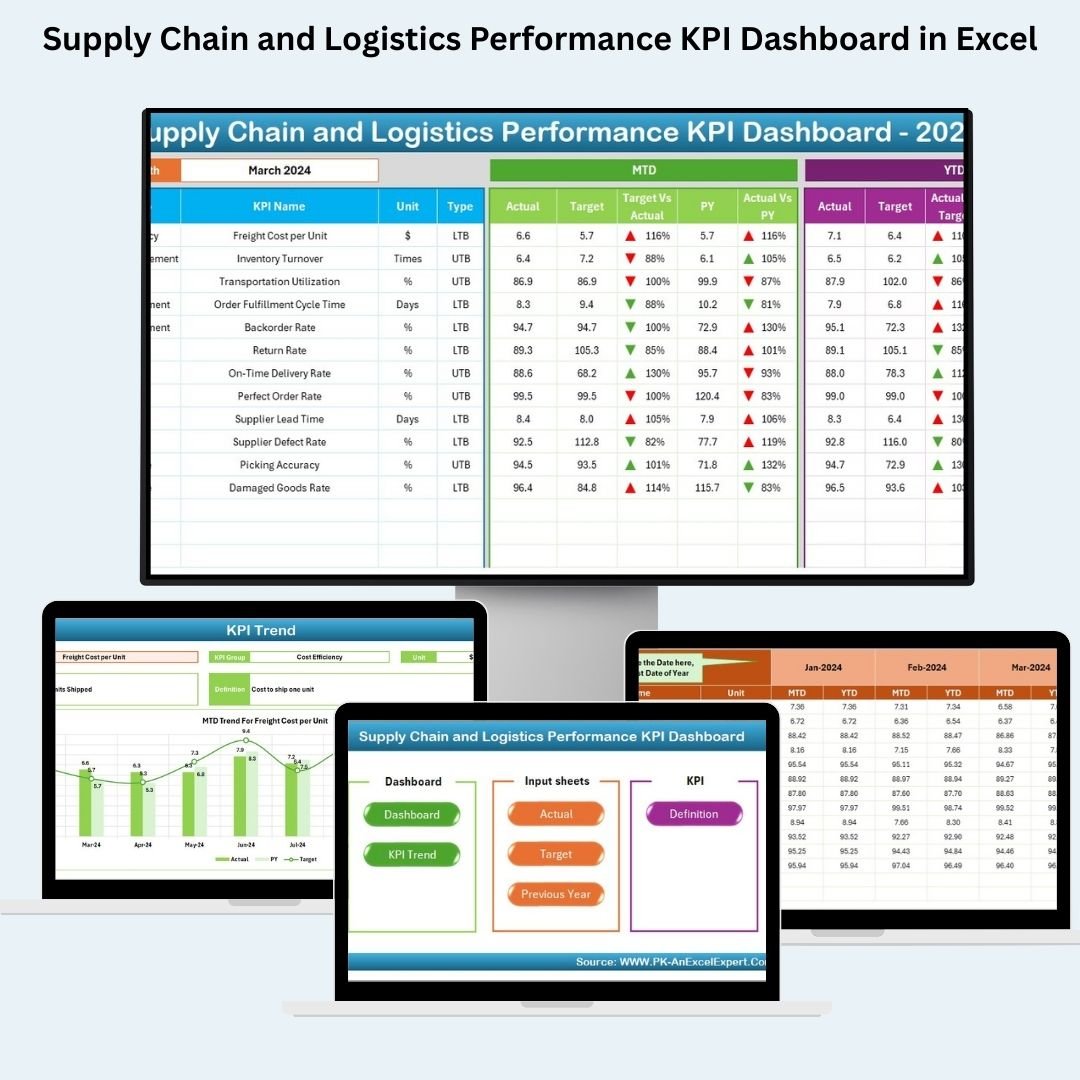

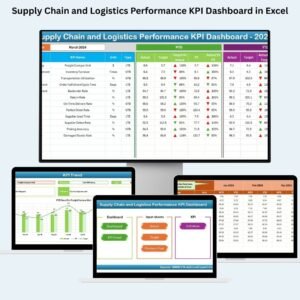
Managing supply chain operations across multiple teams and regions can get messy fast. Without a centralized view of key metrics, inefficiencies creep in. That’s why we created the Supply Chain and Logistics Performance KPI Dashboard in Excel — a powerful, ready-to-use tool to visualize KPIs, spot trends, and drive decisions with confidence.
Whether you’re a supply chain manager, logistics analyst, or operations leader, this dashboard gives you real-time insights into performance — from delivery efficiency to cost control — all in one Excel file.
✨ Key Features of the Supply Chain KPI Dashboard
📊 7 Smartly Designed Worksheets
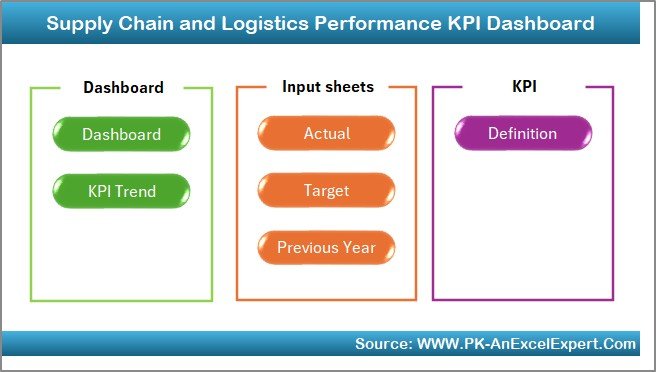
Home Sheet – Easy navigation with clickable buttons
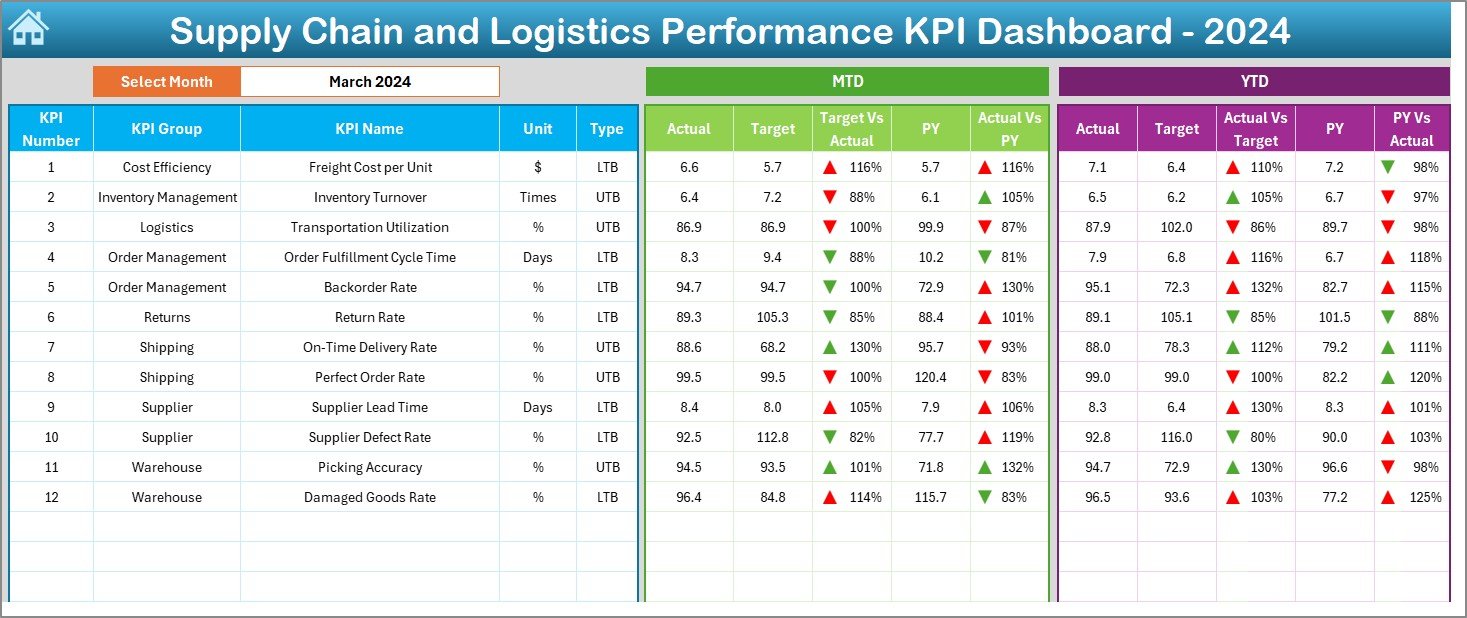
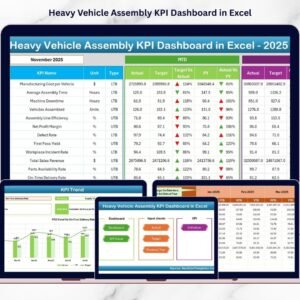
Dashboard Sheet – Month-based summary with trends and comparisons
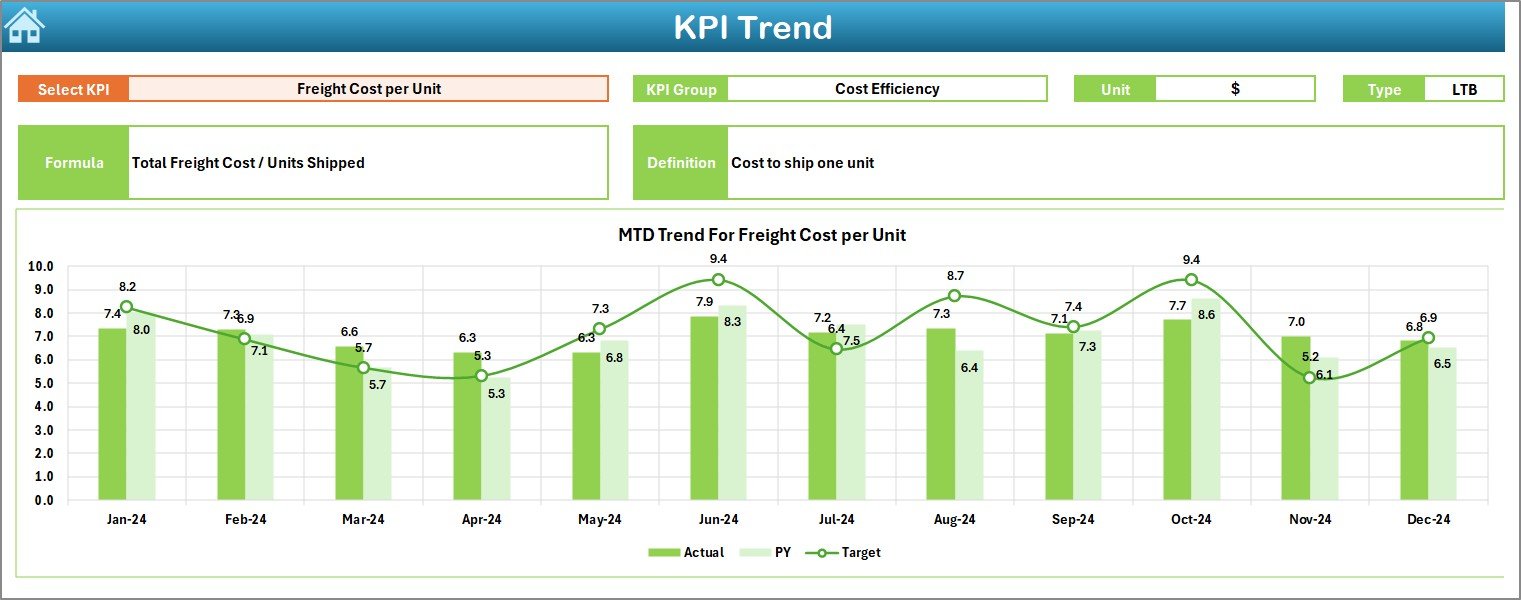
KPI Trend Sheet – Drill down into monthly and yearly performance
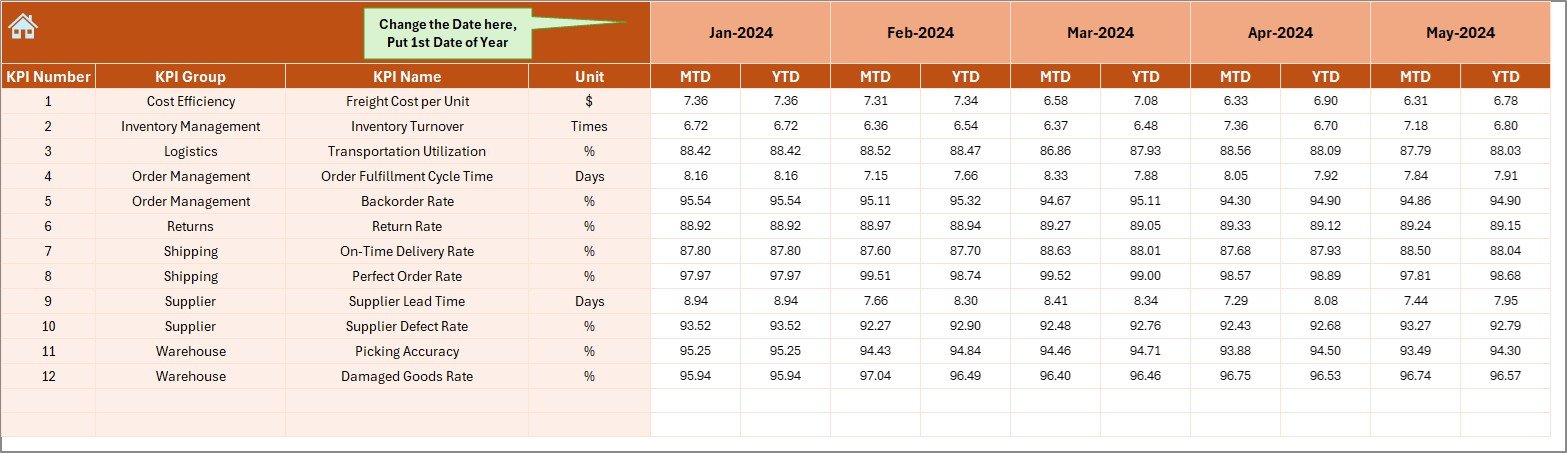
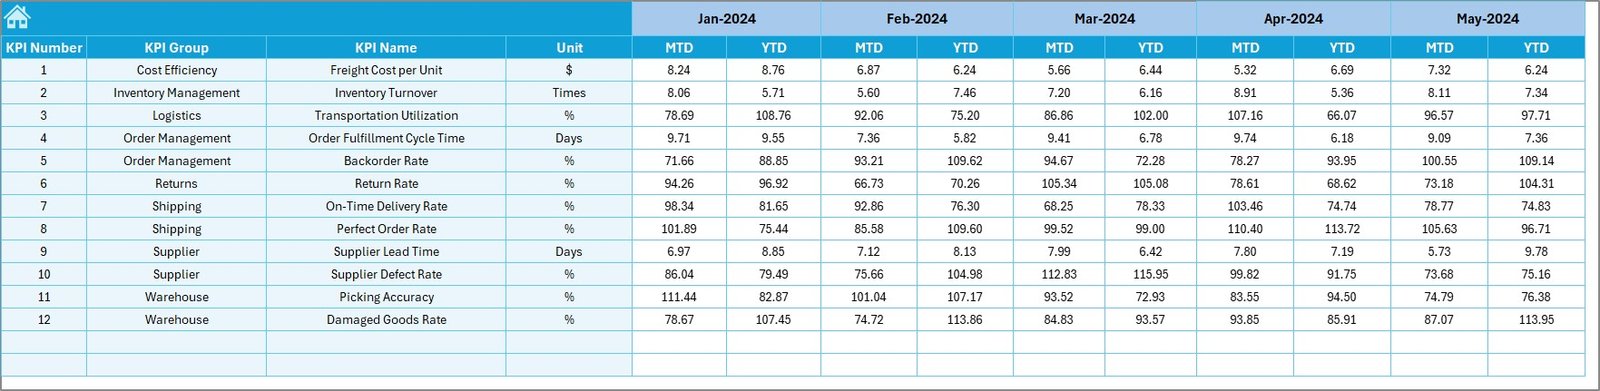
Actual Numbers Input Sheet – Enter monthly actuals with ease
Target Sheet – Set and monitor MTD/YTD performance goals
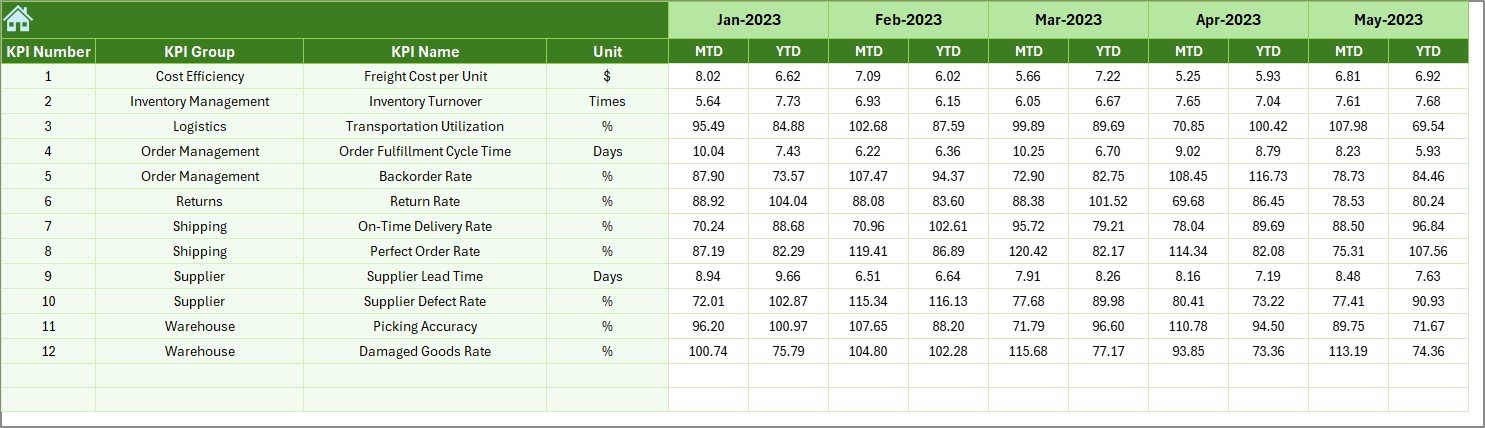
Previous Year Sheet – Track last year’s numbers for historical comparison
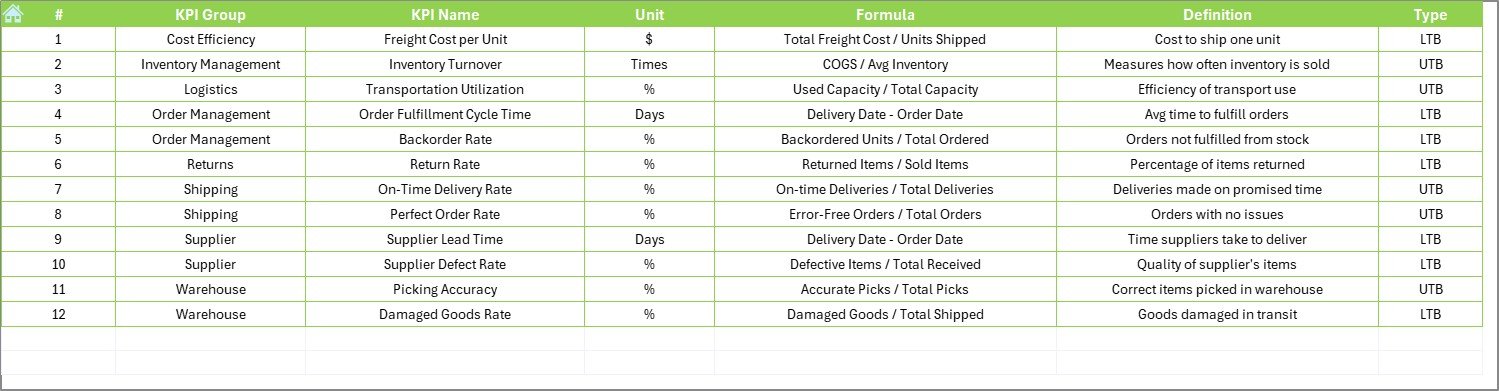
KPI Definition Sheet – Maintain formulas, units, and metric types
📆 MTD and YTD Views
Analyze Month-to-Date (MTD) vs Year-to-Date (YTD) progress
Compare Actual vs Target vs Previous Year
Track progress and gaps clearly using up/down trend arrows
📈 KPI Trend Visualization
Select any KPI from a dropdown
View MTD/YTD progress in line charts
Spot areas needing attention — fast!
🧠 User-Friendly Data Entry
No complex formulas required
Change fiscal start month in just one cell (E1)
All charts update automatically
📦 What’s Inside the Excel Dashboard?
🔹 Dynamic Dashboard Sheet – Performance snapshots for all KPIs
🔹 Drop-down Based Filters – Select the month to auto-update all visuals
🔹 Visual Performance Trends – Conditional formatting shows trends at a glance
🔹 Data Input Tabs – Simplify monthly data entry with a structured format
🔹 Definition Sheet – Keep all formulas, KPI types (UTB or LTB), and logic documented
🔹 All-in-One System – Actuals, targets, trends, and definitions in one workbook
🛠 How to Use the Dashboard
✅ Open the Excel file and go to the Actual Numbers Input sheet
📥 Enter monthly values for MTD and YTD for each KPI
🎯 Head to the Target Sheet and enter goal figures
🗂️ Load previous year’s performance in the Previous Year tab
📊 Navigate to the Dashboard to see insights update instantly
📈 Use the KPI Trend Sheet to analyze individual KPI movements
All visual elements auto-update — no manual refresh required.
👥 Who Should Use This Dashboard?
This Excel tool is perfect for:
🚚 Supply Chain Managers – Track delivery performance, costs, and delays
📦 Logistics Teams – Monitor transit time, order cycle time, and on-time delivery
📊 Operations Analysts – Identify inefficiencies and areas of cost-saving
🏢 Manufacturing, Retail, E-commerce & Distribution – Tailored for any industry
🧑💼 Executives – Use summary visuals for reporting and decision-making
🚀 Benefits of the KPI Dashboard
✅ Instant Overview – Access all performance data in one screen
✅ Customizable – Modify KPIs, formulas, visuals, and sheet layout
✅ Beginner Friendly – Drop-downs, auto-formulas, and clear instructions
✅ Printable & Presentable – Create reports for meetings in seconds
✅ No Extra Software Needed – 100% Excel-based, no subscriptions
✅ Accurate Tracking – View trends across actual, target, and past year
✅ Editable Fiscal Year Start – Align with your business calendar
💡 Best Practices for Using the Dashboard
🧾 Keep Definitions Clear – Use the KPI Definition Sheet to align your team
📅 Update Data Monthly – Enter fresh data every month for accuracy
📊 Use Trend Analysis – Focus on KPIs with declining performance
🎯 Highlight Top KPIs – Focus on metrics that impact cost, delivery, and customer service
👥 Train Your Team – Help your staff understand how to use the tool
🔁 Click here to read the Detailed blog post
📺 Visit our YouTube channel to learn step-by-step video tutorials
Watch the step-by-step video tutorial:
Compatibility and Requirements
- Works in Microsoft Excel desktop (Excel 2016 or later, or Microsoft 365).
- Microsoft’s guide Create a chart from start to finish explains the Excel feature this file is built on.
Frequently Asked Questions
What worksheets are included?
Seven: Home, Dashboard, KPI Trend, Actual Numbers Input, Target, Previous Year and KPI Definition.
Can I compare MTD and YTD results with targets?
Yes. The Dashboard compares month-to-date and year-to-date actuals with targets and the previous year, with up and down arrows to show the gaps.
How do I change the fiscal year start?
Change the start month in cell E1 of the input sheet, and the dates and charts follow.
How do I look at one KPI over time?
Pick the KPI from the dropdown on the KPI Trend sheet to see its MTD and YTD line charts.
Can I add my own supply chain KPIs?
Yes. Add them on the KPI Definition sheet with the unit, formula and type (UTB or LTB), then enter actuals and targets.
Related Supply Chain and Logistics Templates
- Supply Chain and Logistics KPI Dashboard in Google Sheets: the matching KPI dashboard in Google Sheets
- Logistics Cost Optimization KPI Dashboard in Excel: logistics cost KPIs in Excel
- Transportation & Logistics Dashboard in Excel: a transportation and logistics dashboard in Excel
- Supply Chain Report in Excel: a supply chain report in Excel
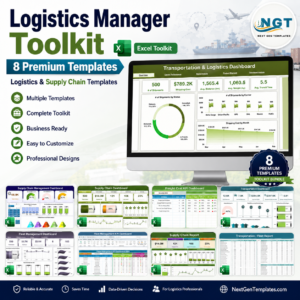
- Logistics Manager Toolkit: eight logistics templates in one bundle
Browse all Excel KPI dashboards or the Excel logistics templates.























Reviews
There are no reviews yet.