



The Project Management Resource Allocation KPI Dashboard in Excel is an essential tool for project managers, team leaders, and business analysts to effectively allocate, track, and optimize resources for project success. This Excel-based dashboard helps you visualize key performance indicators (KPIs) related to resource allocation, project timelines, and team performance, ensuring that all project resources are used efficiently and project deadlines are met.
Whether you’re managing a small team or overseeing large-scale projects, this dashboard simplifies the complex task of resource management. It allows you to track resource availability, allocation, and usage across multiple projects, helping you make data-driven decisions that maximize productivity and minimize delays.
Key Features of the Project Management Resource Allocation KPI Dashboard in Excel
📊 Resource Allocation Tracking
Monitor how resources (personnel, equipment, budget) are distributed across projects. Track whether resources are underutilized or overutilized, and adjust allocations as needed to ensure optimal project outcomes.
📅 Project Timeline Management
View project timelines and milestones. Monitor progress against planned deadlines and identify any delays that may affect resource allocation or project completion.
📈 KPI Monitoring
Track essential KPIs such as resource utilization rate, cost per resource, and project progress percentage. Stay on top of resource allocation and performance across all projects to ensure timely delivery.
🔄 Customizable Project Views
Customize the dashboard to include specific projects, resources, or metrics that align with your unique business requirements. Make the dashboard as detailed or high-level as needed.
💼 Team & Task Management
Assign tasks to team members and monitor their progress. Use the dashboard to view which tasks are completed, in progress, or pending, ensuring better visibility and control over project timelines.
🔧 Budget & Cost Monitoring
Track project budgets and actual expenditures, allowing you to compare allocated budgets with actual costs. Keep an eye on spending and ensure that the project stays within budget.
⚙️ Visual Progress Indicators
Use visual indicators like charts, graphs, and conditional formatting to easily spot trends and areas that need attention. This helps in making quick decisions based on visual cues.
Why You’ll Love the Project Management Resource Allocation KPI Dashboard in Excel

✅ Efficient Resource Management
Track and allocate resources effectively to prevent underutilization or overutilization. Ensure that the right resources are available when and where they are needed.
✅ Monitor Project Timelines
Easily manage and track project milestones, deadlines, and delays to keep your projects on schedule.
✅ Data-Driven Decision Making
Use real-time data and KPIs to make informed decisions about resource allocation and project prioritization, ensuring that your team is working efficiently.
✅ Customizable to Your Needs
Tailor the dashboard to your unique projects, resources, and KPIs. Whether you’re managing a few projects or a portfolio of multiple, this dashboard adapts to your needs.
✅ Visualize Performance
Track project and resource performance with easy-to-understand charts, graphs, and tables that provide quick insights into project health.
What’s Inside the Project Management Resource Allocation KPI Dashboard in Excel?
Resource Allocation Tracking: Visualize how resources are allocated across projects.
Project Timeline Management: Monitor project milestones, deadlines, and progress.
KPI Monitoring: Track key performance indicators related to resource utilization and project timelines.
Customizable Project Views: Adjust the dashboard to reflect the projects, resources, and metrics most relevant to you.
Team & Task Management: Assign tasks and monitor team progress.
Budget & Cost Monitoring: Keep track of project costs and compare them with allocated budgets.
Visual Progress Indicators: Use charts and graphs for quick decision-making.
How to Use the Project Management Resource Allocation KPI Dashboard in Excel
1️⃣ Download the Template: Get access to the Excel file instantly.
2️⃣ Input Project Data: Enter the details of your projects, resources, and budgets.
3️⃣ Allocate Resources: Assign resources to tasks and monitor their utilization.
4️⃣ Track Progress: Use the timeline and KPIs to monitor progress and resource allocation.
5️⃣ Make Adjustments: Adjust project timelines, tasks, or resources based on insights from the dashboard.
Who Can Benefit from the Project Management Resource Allocation KPI Dashboard in Excel?
🔹 Project Managers
🔹 Team Leaders & Managers
🔹 Business Analysts
🔹 Resource Management Teams
🔹 Operations Teams
🔹 Organizations Managing Multiple Projects
🔹 Small & Medium Businesses (SMBs)
Ensure that your projects stay on track, within budget, and with the right resources available at the right time with the Project Management Resource Allocation KPI Dashboard in Excel.
Click here to read the Detailed blog post
Visit our YouTube channel to learn step-by-step video tutorials
Youtube.com/@PKAnExcelExpert
Watch the step-by-step video Demo:
Compatibility and Requirements
- Works in Microsoft Excel desktop (Excel 2016 or later, or Microsoft 365).
- Charts, graphs and conditional formatting show the project and resource status. Microsoft explains charts in Create a chart from start to finish.
Frequently Asked Questions
What does this dashboard track?
It tracks resource allocation across projects, project timelines and milestones, KPIs such as resource utilization rate, cost per resource and project progress percentage, team tasks, and project budgets against actual costs.
Can I see which resources are underused or overused?
Yes. The resource allocation view shows how personnel, equipment and budget are spread across projects, so you can spot underutilized or overutilized resources and adjust.
Can I follow task progress for my team?
Yes. You assign tasks to team members and see which tasks are completed, in progress or pending.
Can I compare the budget with actual spending?
Yes. The dashboard tracks project budgets and actual expenditures, so you can compare allocated budgets with actual costs.
Can I change the dashboard to fit my projects?
Yes. The project views are customizable, so you can include the specific projects, resources and metrics you need.
Is there a Power BI or Google Sheets version?
There is a Resource Allocation KPI Dashboard in Power BI and a Resource Allocation KPI Dashboard in Google Sheets.
Related Resource and Project Templates
- Resource Allocation KPI Dashboard in Excel: a general resource allocation KPI view
- Resource Allocation Dashboard in Excel: another Excel view of resource allocation
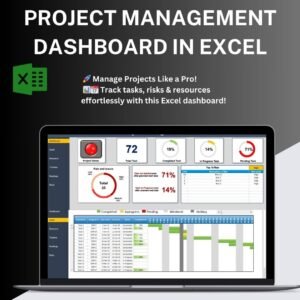
- Project Management Dashboard in Excel: an overview of project status
- Project Progress Tracker in Excel: a tracker for project progress
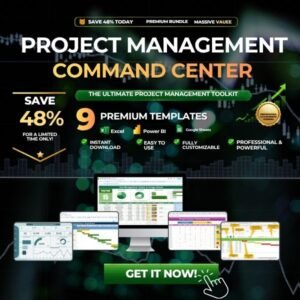
- Project Management Pro Bundle: 9 project management templates in one download
Browse all Excel KPI dashboards or Excel project management templates.













Reviews
There are no reviews yet.