



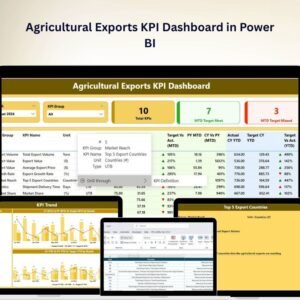
The Agricultural Exports KPI Dashboard in Power BI is a powerful and dynamic tool designed to help businesses in the agricultural export sector monitor and analyze their key performance indicators (KPIs) effectively. By leveraging this comprehensive dashboard, businesses can track important export data in real-time, making it easier to identify trends, manage performance, and optimize operations.
This Power BI dashboard provides a holistic view of agricultural export performance, integrating data from multiple sources to deliver insights that help businesses make informed decisions, drive profitability, and improve operational efficiency. Whether you’re managing export volumes, revenue, or market destinations, this tool enables businesses to stay on top of their KPIs and enhance their export strategies.

Key Features of the Agricultural Exports KPI Dashboard in Power BI
📊 Comprehensive Data Integration
Unified Data Source: Combines data from various sources for a complete view of agricultural export activities.
Real-Time Data Updates: Ensures that the dashboard reflects the most current data available, allowing businesses to make timely, data-driven decisions.
📈 Interactive Visualizations
Customizable Charts and Graphs: Provides interactive visualizations that allow you to explore data in various formats such as bar charts, line graphs, and heatmaps.
Drill-Down Functionality: Enables users to explore detailed data, helping to uncover hidden insights and trends.
📊 Key Performance Indicator Tracking
Export Volume Analysis: Tracks the volume of goods exported over specific periods, helping to identify seasonal trends and performance changes.
Revenue and Profitability Metrics: Monitors revenue trends and profit margins to assess the financial health of your export operations.
Market Destination Insights: Identifies top markets and tracks the performance of exports across different regions.
🖥 User-Friendly Interface
Intuitive Design: The dashboard is designed for ease of use, offering a clean layout and simple navigation.
Customizable Views: Users can personalize the dashboard according to their specific interests and business needs.
📉 Advanced Analytical Tools
Trend Analysis: Provides insights into long-term trends and performance forecasts, helping you plan for the future.
Comparative Analysis: Enables side-by-side comparisons of different time periods, markets, or product categories to better understand performance.
Benefits of Using the Agricultural Exports KPI Dashboard in Power BI
✅ Enhanced Decision-Making
Gain real-time insights into your export activities, empowering you to make informed decisions quickly and confidently.
✅ Operational Efficiency
Identify performance trends and bottlenecks in your export operations, helping you improve efficiency and optimize resources.
✅ Strategic Planning
Understand market dynamics and key performance drivers, enabling you to develop effective strategies for growth and expansion.
✅ Continuous Performance Monitoring
Track KPIs consistently to ensure that export activities align with your company’s overall goals and objectives.
Conclusion
The Agricultural Exports KPI Dashboard in Power BI is a vital tool for businesses involved in the agricultural export industry. By integrating real-time data, interactive visualizations, and advanced analytical features, this dashboard enables businesses to monitor performance, improve operational efficiency, and make data-driven decisions. Whether you are a small business or a large enterprise, this dashboard will help you stay competitive in the agricultural export market and achieve your business objectives.
Click here to read the Detailed blog post
Agricultural Exports KPI Dashboard in Power BI
Visit our YouTube channel to learn step-by-step video tutorials
YouTube.com/@PKAnExcelExpert
Watch the step-by-step video Demo:
Compatibility and Requirements
- Works in Power BI Desktop, which is free to download from Microsoft.
- Microsoft explains how to install it in Get Power BI Desktop.
Frequently Asked Questions
What does the dashboard track?
It tracks export volume over time, revenue and profit margins, and how exports perform across market destinations.
Can I explore the data in more detail?
Yes. The charts are interactive and support drill-down, so you can move from a summary to the detailed figures behind it.
Can I compare periods or markets?
Yes. The dashboard has comparative analysis for side-by-side views of different time periods, markets or product categories, plus trend analysis for longer-term patterns.
Can I change the views?
Yes. The views are customizable, so you can arrange the dashboard around the numbers you check most.
Is there an Excel or Google Sheets version?
Yes. See the Agricultural Exports KPI Dashboard in Excel and the Agricultural Exports KPI Dashboard in Google Sheets.
Related Agricultural and Export Templates
- Agricultural Exports KPI Dashboard in Excel: the same dashboard for Excel users
- Agricultural Exports KPI Dashboard in Google Sheets: a browser-based version
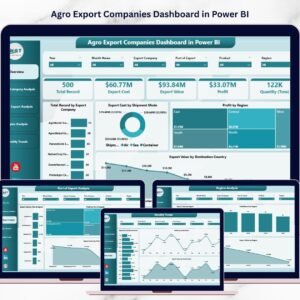
- Agro Export Companies Dashboard in Power BI: a Power BI dashboard for agro export companies
- Export Compliance KPI Dashboard in Power BI: KPIs for export compliance
- Power BI Dashboard Mega Collection: 15 Power BI templates in one download
Browse all Power BI KPI dashboards.




























Reviews
There are no reviews yet.